
Abstract
Background
Previous study consistently showed that lower serum sodium (SNa) was associated with a greater risk of mortality in hemodialysis (HD) patients. However, few studies have focused on the change in SNa (ΔSNa = post-HD SNa – pre-HD SNa) during an HD session.
Methods
In a retrospective cohort of maintenance HD adults, all-cause mortality and cardio-cerebrovascular event (CCVE) were followed up for a medium of 82 months. Baseline pre-HD SNa and ΔSNa were collected; time-averaged pre-HD SNa and ΔSNa were computed as the mean values within 1-year, 2-year and 3-year intervals after enrollment. Cox proportional hazards models were used to evaluate the relationships of pre-HD and ΔSNa with outcomes.
Results
Time-averaged pre-HD SNa were associated with all-cause mortality (2-year pre-HD SNa: HR [95% CI] 0.86 [0.74–0.99], p = 0.042) and CCVE (3-year pre-HD SNa: HR [95% CI] 0.83 [0.72–0.96], p = 0.012) with full adjustment. Time-averaged ΔSNa also demonstrated an association with all-cause mortality (3-year ΔSNa: HR [95% CI] 1.26 [1.03–1.55], p = 0.026) as well as with CCVE (3-year ΔSNa: HR [95% CI] 1.51 [1.21–1.88], p = <0.001) when fully adjusted. Baseline pre-HD SNa and ΔSNa didn’t exhibit association with both outcomes.
Conclusions
Lower time-averaged pre-HD SNa and higher time-averaged ΔSNa were associated with a greater risk of all-cause mortality and CCVE in HD patients.
Introduction
Worldwide, over 3 million end-stage kidney disease patients, 89% of whom undergo hemodialysis (HD), experience high risk of all-cause mortality and cardiovascular morbidity rates [Citation1,Citation2]. Due to the deficiency of renal function, HD population rely on regular HD to eliminate excess body water volume and sodium content, consequently leading to elevated prevalence of sodium disorders and fluctuation [Citation3]. Previous studies have consistently shown that hyponatremia is correlated with a greater risk of mortality and cardio-cerebrovascular events (CCVE) among HD patients [Citation4–11]. It remains uncertain whether the association between hyponatremia and adverse outcomes are causal (e.g., through central nervous toxicity [Citation12–14], fracture [Citation15,Citation16], infection [Citation11,Citation17], cardio-cerebrovascular complications [Citation18]), or due to confounders that predispose to hyponatremia (e.g., nutritional status, inflammation, ultrafiltration volume, interdialytic weight gain [IDWG], comorbidities) [Citation4,Citation5,Citation10].
Different approaches to handling serum sodium (SNa) can lead to distinct characteristics of correlation with adverse outcomes. Baseline pre-HD SNa exhibites an inverse linear association with all-cause mortality [Citation4,Citation6,Citation9,Citation10], while the average SNa over a period of time demonstrates a U-shaped relationship [Citation5,Citation7]. The similar time-dependent characteristic is also observed in peritoneal dialysis patients [Citation19]. Nonetheless, few studies have focused on the change in SNa concentration (ΔSNa: post-HD SNa – pre-HD SNa) during an HD session, which serves as an indication of sodium fluctuation. Recently, Fujisaki et al. reported that a higher mortality was associated with an increase of ΔSNa. However, this study focused solely on the baseline ΔSNa.
In our study, we investigated the relationships of baseline and time-averaged pre-HD SNa/ΔSNa with all-cause mortality and CCVE. We hypothesized that both pre-HD SNa and ΔSNa were associated with adverse outcomes, and time-averaged variables demonstrated superior predictive performance than baseline. Ultimately, we aspired to establish a reference target value of ΔSNa for HD prescription.
Materials and methods
Study participants
Patients on maintenance HD in dialysis center from Peking Union Medical College Hospital were enrolled from July 2013 to July 2014. The cohort was followed up until February 2021. Patients who met the following criteria were included: (1) aged ≥ 18 years; (2) received regular HD for ≥ 2 months. The exclusion criteria were as follows: (1) systemic infection, acute CCVE, cancer, surgery or trauma in the month prior to the study; (2) metabolic encephalopathy, mental disorder, emotional disorder, epilepsy, or dementia; (3) history of non-atherosclerotic arterial disease (e.g., vasculitis, Takayasu arteritis). Total 117 participants were enrolled in the cohort. We further excluded patients who had missing pre- or post-HD SNa data at baseline or had less than 2 measurements of pre- and post-HD SNa within the first year after enrollment (n = 7). Finally, 110 participants were included in the study. The occurrence of the acute illness (such as systemic infection, surgery or trauma) during the study period did not result in the exclusion of patients. A total of 13 cancer patients were included in the cohort, with their cancer diagnosis and treatment occurring at least 5 months prior to the enrollment and no progression during the follow-up. Their information is provided in Supplementary Table S1.
This retrospective study was approved by the Ethics Committee of our medical center [K23C3006], and informed consents were waived.
Serum sodium and covariates
All participants typically received regular HD thrice-weekly. Each dialysis session generally lasted for 4h. A fixed dialysate sodium of 138 mmol/L was routinely used, and it was increased when intra-dialytic hypotension occurred. SNa were measured pre- and post-HD at enrollment as baseline, followed by checkup typically every 1 to 3 months. ΔSNa was calculated by subtracting the pre-HD SNa from the post-HD SNa. Na gradient, calculated as dialysate Na minus pre-HD SNa, represented the disparity between the prescribed dialysate sodium concentration and the pre-HD SNa concentration. The average values of pre-HD SNa, ΔSNa and Na gradient over the intervals of 1, 2 and 3 years were computed.
Baseline data were collected from medical records, including demographics (age, sex, body mass index [BMI]), personal history (smoking habit, drinking habit), comorbidities (diabetes, hypertension, cardio-cerebrovascular disease [CCVD], malignant tumor), dialysis-related variables (ultrafiltration volume, dry weight, Kt/V, vintage) and laboratory parameters (albumin, hemoglobin, creatinine, blood urea nitrogen, potassium, calcium, phosphorus, parathyroid hormone, uric acid, C-reactive protein, ferritin, triglyceride, total cholesterol, high density lipoprotein-cholesterol, low density lipoprotein-cholesterol). Laboratory parameters during the follow-up period were also collected, and the mean values over the corresponding time period were used for adjustment.
Outcomes
We included two primary outcomes: (1) the time to all-cause mortality; (2) the time to CCVE. The CCVE in this study refers to myocardial infarction, cerebral infarction or cerebral hemorrhage.
Statistical methods
Data was presented as frequency (percentages) for categorical variables, means (SDs) for normally distributed continuous variables, and medians (interquartile ranges) for continuous variables with a skewed distribution. Baseline characteristics were analyzed in total or stratified according to the mean baseline pre-HD SNa, and subsequently compared using t-tests. The time-averaged characteristics were calculated by averaging the values over the corresponding time periods, with stratification based on the cutoff of time-averaged ΔSNa at 0 mmol/L, and subsequently compared using t-tests. A linear regression model was utilized to analyze the relationship between pre-HD SNa and Na gradient.
Cox proportional hazard model was employed to compute the hazard ratio (HR) and 95% confidence intervals (CI) for pre-HD SNa and ΔSNa in relation to both outcomes. Covariates plausibly associated with all-cause mortality or CCVE (identified as p < 0.1 in univariate cox hazard analysis) were selected for the adjustment, and the stepAIC function from the MASS package was subsequently applied to determine the final covariates. We constructed three models for both outcomes. Model 1 was adjusted for age, BMI, and CCVD history. Model 2 was adjusted for covariates in Model 1 plus laboratory parameters (albumin for all-cause mortality; C-reactive and ferritin for CCVE). Model 3 was adjusted for covariates in Model 1 plus pre-HD SNa. Area under curve (AUC) was calculated for the univariate model, Model 1, Model 2 and Model 3. A restricted cubic spline (RCS) model adjusted with Model 2 with 4 knots was applied to evaluate the relationship between the pre-HD SNa/ΔSNa and the outcomes.
Participants were further categorized into 4 groups based on the cutoff of pre-HD SNa = 138 mmol/L and ΔSNa = −1 mmol/L. A fully adjusted Cox proportional analysis was used to calculate the relative HR and 95% CI between the groups; additionally, Kaplan-Meier plots and log-rank tests were utilized to compare differences between the groups.
All analyses were performed using R [Citation20]. The R package ‘survival’, ‘pROC’, and ‘rms’ were used for Cox regression analysis, AUC calculation and RCS plotting, respectively. Statistical significance was defined as two-tailed p-values < 0.05.
Results
Study participants
A total of 110 participants (Age: 57.1 ± 12.43 years; Male: 55/110, 50%; vintage: 72.83 ± 59.99 months) were enrolled in this study. The baseline pre- and post-HD SNa levels was 137.9 ± 3.12 mmol/L and 137.07 ± 2.20 mmol/L, with the ΔSNa of −0.83 ± 2.86 mmol/L. Demographical, clinical and baseline laboratory data in total and subgroups stratified by mean pre-HD SNa was summarized in . The time-averaged characteristics was summarized both in total and subsets stratified by time-averaged ΔSNa (). SNa were monitored for total 7.78 ± 3.08, 13.95 ± 5.82, and 19.17 ± 8.68 times during the intervals of 1, 2 and 3 years after enrollment, respectively. The average pre-HD SNa concentrations over the 1-year, 2-year, and 3-year intervals were 137.83 ± 2.32, 137.68 ± 2.26 and 137.51 ± 2.23 mmol/L, respectively (). The corresponding ΔSNa were −0.65 ± 1.87, −0.46 ± 1.79, and −0.40 ± 1.75 mmol/L. The Na gradient and ΔSNa exhibited a significant positive linear correlation (Supplementary data, Fig. S1). Regarding the average Na gradient and ΔSNa over the 3-year period, their linear model equation was y = −0.701 + 0.608x (p < 0.001).
Table 1. Baseline characteristics of the participants.
Table 2. Pre-HD SNa and ΔSNa of the participants.
Table 3. Cox proportional hazards models of pre-HD SNa for all-cause mortality and cardio-cerebrovascular event.
Table 4. Cox proportional hazards models of ΔSNa for all-cause mortality and cardio-cerebrovascular event.
Table 5. Adjusted hazard ratio associated with stratification by pre-HD SNa and ΔSNa.
Risk of mortality and CCVE associated with pre-HD SNa
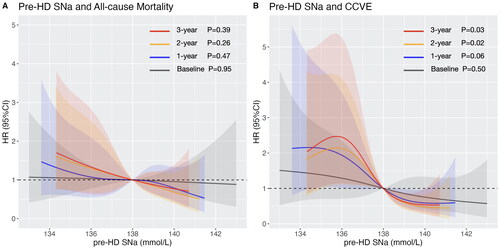
During the medium follow-up of 82 (interquartile ranges: 69–84) months, a total of 36 (32.7%) deaths and 34 (30.9%) CCVE had occurred. Cox proportional hazard analysis demonstrated a reduced risk with increase of pre-HD SNa (). After adjusting for age, BMI, and CVD history, the time-averaged pre-HD SNa were associated with all-cause mortality and CCVE. With further adjustment of albumin, only the 2-year pre-HD SNa was associated with all-cause mortality (the adjusted HR [95% CI]: 0.86 [0.74–0.99], p = 0.042); with further adjustment of C-reactive protein and ferritin, the time-averaged pre-HD SNa showed association with CCVE (the adjusted HR [95% CI] of the 3-year pre-HD SNa: 0.83 [0.72–0.96], p = 0.012). Multivariable-adjusted RCS revealed an inverse linear relationship between pre-HD SNa and all-cause mortality (), and a L-shaped relationship for CCVE (). Baseline pre-HD SNa didn’t show significant association with all-cause mortality or CCVE. The time-averaged pre-HD SNa had higher AUC compared with baseline pre-HD SNa in prediction of all-cause mortality (baseline pre-HD SNa: AUC = 0.493; 3-year pre-HD SNa: AUC = 0.572) and CCVE (baseline pre-HD SNa: AUC = 0.531; 3-year pre-HD SNa: AUC = 0.616).
Figure 1. Multivariable-adjusted restricted cubic spline plots of pre-HD SNa for (A) all-cause mortality, with adjustment of age, BMI, CCVD history, SCr, and Alb; and for (B) cardio-cerebrovascular event, with adjustment of age, BMI, CCVD history, CRP and Ferr. Grey, blue, orange and red color represent the RCS curves of baseline pre-HD SNa, 1-year pre-HD SNa, 2-year pre-HD SNa and 3-year pre-HD SNa, respectively. Shadow represents the 95% confident interval.
Risk of mortality and CCVE associated with ΔSNa
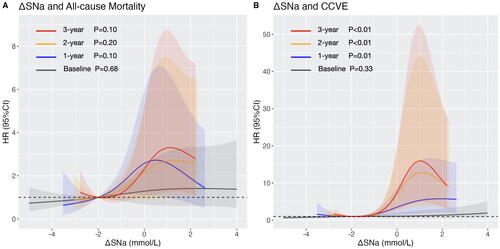
Cox proportional hazard analysis showed that high ΔSNa was associated with greater risk of both outcomes (). In Model 2, the association remained significant between the time-averaged ΔSNa and all-cause mortality (the adjusted HR [95% CI] of 2-year ΔSNa: 1.23 [1.00–1.50], p = 0.045; 3-year ΔSNa: 1.24 [1.00–1.53], p = 0.046) or CCVE (the adjusted HR [95% CI] of 1-year ΔSNa: 1.31 [1.10–1.55], p = 0.002; 2-year ΔSNa: 1.45 [1.18–1.78], p < 0.001; 3-year ΔSNa: 1.51 [1.21–1.88], p < 0.001). In Model 3, time-averaged ΔSNa showed no significant correlation with all-cause mortality but remained significantly associated with CCVE. The multivariable-adjusted RCS revealed J-shaped relationships for all-cause mortality () and CCVE (), with a rapid increase of HR when ΔSNa > −1 mmol/L. Baseline ΔSNa didn’t show significant correlation with all-cause mortality or CCVE. The time-averaged ΔSNa had the highest AUC compared with the baseline ΔSNa and the corresponding pre-HD SNa in prediction of all-cause mortality (3-year ΔSNa: AUC = 0.620; baseline ΔSNa: AUC = 0.529; 3-year pre-HD SNa: AUC 0.572) and cardi-cerebrovascular event (3-year ΔSNa: AUC = 0.722; baseline ΔSNa: AUC = 0.515; 3-year pre-HD SNa: AUC = 0.616). The AUC of time-averaged ΔSNa improved with the increase of time interval.
Figure 2. Multi-variable restricted cubic spline plots of ΔSNa for (A) all-cause mortality with adjustment of age, BMI, CCVD history, SCr, and Alb; and for (B) cardio-cerebrovascular event, with adjustment of age, BMI, CCVD history, CRP and Ferr. Grey, blue, orange and red color represent the RCS curves of baseline ΔSNa, 1-year ΔSNa, 2-year ΔSNa and 3-year ΔSNa. Shadow represents the 95% confidence interval.
Risk of mortality and CCVE associated with stratification by pre-HD SNa and ΔSNa
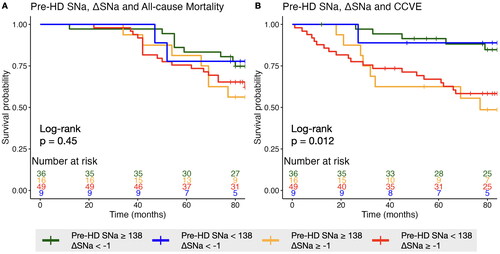
The patients were divided into four groups based on pre-HD SNa and ΔSNa (cutoff value: pre-HD SNa = 138 mmol/L, ΔSNa = −1 mmol/L) with the reference of participants with high pre-HD SNa and low ΔSNa. In fully adjusted Cox model, participants with low pre-HD SNa and high ΔSNa showed highest risk of CCVE (based on duration of 3-year: 9.78 [2.9–32.95], p < 0.001; 2-year: 7.12 [2.27–22.32], p = 0.001; 1-year: 4.91 [1.95–12.33], p = 0.001); while participants with high pre-HD SNa and high ΔSNa exhibited the second-highest risk (based on duration of 3-year: 7.96 [2.35–26.91], p = 0.001; 2-year: 3.90 [1.18–12.96], p = 0.026; 1-year: 4.33 [1.39–13.47], p = 0.011) . No significant differences in the risk of all-cause mortality were consistently observed among the four groups. Kaplan-Meier curves indicated a significant difference across the four groups for cardi-cerebrovascular event (p = 0.012), but not for all-cause mortality (p = 0.45) ().
Figure 3. Kaplan-Meier plots stratified by 3-year average pre-HD SNa and ΔSNa for (A) all-cause mortality and (B) cardio-cerebrovascular event. Significance was examined by Log-rank test.
Discussion
In the present study, we analyzed whether baseline or time-averaged pre-HD SNa/ΔSNa were associated with all-cause mortality and CCVE. Our study demonstrated that lower time-averaged pre-HD SNa and high time-averaged ΔSNa were associated with greater risk of both adverse outcomes; while baseline pre-HD and ΔSNa didn’t show such association. Moreover, we observed a rapid increase in the hazard ratio for adverse outcomes when ΔSNa exceeded −1, indicating that ΔSNa of ≤ −1 mmol/L could be a potential intervention target.
There are mainly three scenarios of the relationship between serum sodium and mortality in dialysis patients [Citation21,Citation22]. First, the confounders associated with hyponatremia indirectly lead to high mortality, including less favorable nutritional status (e.g., body mass index, albumin, serum creatinine), inadequate ultrafiltration volume, higher IDWG, less inflammation (e.g., C-reactive protein) and comorbidities [Citation4,Citation5,Citation10]. Second, hyponatremia directly contributes to mortality through multiple pathways. This includes inducing injury to the central nervous systema [Citation12,Citation13], and leading to disequilibrium, gait instability, falls and subsequent fractures [Citation15,Citation16]. Moreover, it impairs immune protection [Citation11,Citation17], and cardiac function [Citation18]. Third, the underlying disease causes hyponatremia and contributes to mortality, but hyponatremia further increases this mortality risk [Citation8]. In our study, pre-HD SNa was associated with both all-cause mortality and CCVE with adjustment of age, nutritional status and laboratory parameters. This suggested that there might be both direct and indirect connections between pre-HD SNa and adverse outcomes.
ΔSNa is an indicator of serum sodium fluctuation during a hemodialysis session. In our study, a higher ΔSNa is associated with an elevated risk of all-cause mortality and CCVE, aligning with the trend observed in the study conducted by Fujisaki et al. [Citation8]. By further adjustment of pre-HD SNa (Model 3), time-averaged ΔSNa exhibited no significant association with all-cause mortality, yet remained significantly associated with CCVE; therefore, it indicates that ΔSNa performs similarly for all-cause mortality prediction but excels in predicting CCVE compared to pre-HD SNa. Research specifically focused on ΔSNa and its underlying mechanisms remains limited. Nonetheless, considerable attention has been dedicated to the dialysate sodium concentration and the sodium gradient [Citation23]. Based on the concept of an individualized sodium set point [Citation24,Citation25], a personalized dialysis prescription considering dialysate-plasma Na gradient rather than dialysate Na concentration alone arises [Citation14,Citation23]. A positive Na gradient generally leads to a positive ΔSNa, reducing the risk of intradialytic hypotension [Citation26], and promoting hemodynamic stability and sufficient perfusion of essential organs [Citation27]; however, it also results in increased osmolarity and thirst, contributing to higher IDWG and, consequently, hypertension, left ventricular hypertension and increased cardiovascular mortality [Citation23,Citation28,Citation29]. In contrast, a negative Na gradient with a negative ΔSNa, has been associated with reduced thirst, decreased IDWG, improved blood pressure, but increased intradialytic hypotensive episodes [Citation23,Citation28,Citation30].
However, currently there are no recommended optimal Na gradient and ΔSNa targets available, in order to achieve a balance of benefits and risks. According to the RCS analysis of ΔSNa, the hazard ratio of both all-cause mortality and CCVE begin to noticeably escalate when ΔSNa exceeds −1 mmol/L. This indicates that ΔSNa of ≤ −1 mmol/L may be a favorable target. The Na gradient demonstrated a significant linear correlation with ΔSNa. Based on the linear model of 3-year ΔSNa and Na gradient (y = −0.701 + 0.608x), in order to achieve a long-term ΔSNa of −1 mmol/L, the dialysate sodium concentration should be 0.49 mmol/L lower than the pre-HD SNa concentration. Nevertheless, caution should be exercised, as this recommendation might not be applicable for patients with low pre-HD SNa levels. There are evidences showing potential benefit of high dialysate sodium concentrations in patients with low plasma sodium levels [Citation5,Citation6]. In our study, the low pre-HD SNa and low ΔSNa group comprised of fewer than 10 patients, which led to less reliable results concerning this subset of the population. The smaller population in this subgroup might be due to the difficulty in achieving ΔSNa ≤ −1 mmol/L in the presence of low pre-HD SNa, as it carried a greater risk of intra-dialytic hypotension. Therefore, maintaining a higher pre-HD SNa level to achieve ΔSNa ≤ −1 mmol/L during dialysis without the occurrence of side effects could be a more comprehensive management approach.
Despite the confirmed association between SNa, ΔSNa, and adverse outcomes in hemodialysis patients, it remains uncertain whether interventions aimed at maintaining SNa and ΔSNa can effectively improve prognosis. Some nephrologists manually individualize dialysate sodium prescription based on pre-HD SNa concentrations periodically [Citation31], but the additional efforts and frequent serum sodium monitoring could hinder its wide application in clinical practice. Recently, the incorporation of dialysis machine with automated sodium balancing module has been developed and validated [Citation3,Citation32–35]. It represents an innovative approach in dialysate sodium prescription, which could be able to fine-tune SNa and ΔSNa. Further outcome-based studies are required to validate clinical values of such a new tool [Citation14].
Our study had several limitations. First, all participants were from the same medical center, and the sample size was limited. Second, due to limitations in the size of the cohort, only a subset of the selected confounders was adjusted to mitigate overfitting of the model. Third, we didn’t adjust the influence of glucose on SNa concentration because there were missing values [Citation36]. Fourth, we possess solely the baseline ultrafiltration volume data and lack the long-term ultrafiltration volume and IDWG records of patients, preventing us from conducting an in-depth analysis of their relationships with pre-HD SNa and ΔSNa. Finally, the occurrence of intradialytic hypotension (IDH) is related to adverse outcomes. However, due to the absence of blood pressure monitoring data, we are unable to determine the incidence of IDH and the correlation between IDH and ΔSNa.
In conclusion, our study indicates that low time-averaged pre-HD SNa and high time-averaged ΔSNa are associated with greater risk of all-cause mortality and CCVE. ΔSNa of ≤ −1 mmol/L could potentially serve as an intervention target; however, further interventional studies focused on clinical outcomes are required to validate this recommendation.
Supplemental Material
Download PDF (246.1 KB)Additional information
Funding
References
- Canaud B, Köhler K, Sichart J-M, et al. Global prevalent use, trends and practices in haemodiafiltration. Nephrol Dial Transplant. 2020;35(3):1–10. doi: 10.1093/ndt/gfz005.
- Cozzolino M, Mangano M, Stucchi A, et al. Cardiovascular disease in dialysis patients. Nephrol Dial Transplant. 2018;33(suppl_3):iii28–iii34. doi: 10.1093/ndt/gfy174.
- Canaud B, Kooman J, Maierhofer A, et al. Sodium first approach, to reset our mind for improving management of sodium, water, volume and pressure in hemodialysis patients, and to reduce cardiovascular burden and improve outcomes. Front Nephrol. 2022;2:935388. doi: 10.3389/fneph.2022.935388.
- Waikar SS, Curhan GC, Brunelli SM. Mortality associated with low serum sodium concentration in maintenance hemodialysis. Am J Med. 2011;124(1):77–84. doi: 10.1016/j.amjmed.2010.07.029.
- Hecking M, Karaboyas A, Saran R, et al. Predialysis serum sodium level, dialysate sodium, and mortality in maintenance hemodialysis patients: the dialysis outcomes and practice patterns study (DOPPS). Am J Kidney Dis. 2012;59(2):238–248. doi: 10.1053/j.ajkd.2011.07.013.
- Mc Causland FR, Brunelli SM, Waikar SS. Dialysate sodium, serum sodium and mortality in maintenance hemodialysis. Nephrol Dial Transplant. 2012;27(4):1613–1618. doi: 10.1093/ndt/gfr497.
- Rhee CM, Ravel VA, Ayus JC, et al. Pre-dialysis serum sodium and mortality in a national incident hemodialysis cohort. Nephrol Dial Transplant. 2016;31(6):992–1001. doi: 10.1093/ndt/gfv341.
- Fujisaki K, Joki N, Tanaka S, et al. Pre-dialysis hyponatremia and change in serum sodium concentration during a dialysis session are significant predictors of mortality in patients undergoing hemodialysis. Kidney Int Rep. 2021;6(2):342–350. doi: 10.1016/j.ekir.2020.11.009.
- Nigwekar SU, Wenger J, Thadhani R, et al. Hyponatremia, mineral metabolism, and mortality in incident maintenance hemodialysis patients: a cohort study. Am J Kidney Dis. 2013;62(4):755–762. doi: 10.1053/j.ajkd.2013.02.367.
- Dekker MJE, Marcelli D, Canaud B, et al. Unraveling the relationship between mortality, hyponatremia, inflammation and malnutrition in hemodialysis patients: results from the international MONDO initiative. Eur J Clin Nutr. 2016;70(7):779–784. doi: 10.1038/ejcn.2016.49.
- Mandai S, Kuwahara M, Kasagi Y, et al. Lower serum sodium level predicts higher risk of infection-related hospitalization in maintenance hemodialysis patients: an observational cohort study. BMC Nephrol. 2013;14(1):276. doi: 10.1186/1471-2369-14-276.
- Arieff AI. Hyponatremia, convulsions, respiratory arrest, and permanent brain damage after elective surgery in healthy women. N Engl J Med. 1986;314(24):1529–1535. doi: 10.1056/NEJM198606123142401.
- Ayus JC, Achinger SG, Arieff A. Brain cell volume regulation in hyponatremia: role of sex, age, vasopressin, and hypoxia. Am J Physiol Renal Physiol. 2008;295(3):F619–24. doi: 10.1152/ajprenal.00502.2007.
- Canaud B. A personal and practical answer from a clinical perspective. Kidney and Dialysis. 2021;1(2):149–151. doi: 10.3390/kidneydial1020019.
- Kinsella S, Moran S, Sullivan MO, et al. Hyponatremia independent of osteoporosis is associated with fracture occurrence. Clin J Am Soc Nephrol. 2010;5(2):275–280. doi: 10.2215/CJN.06120809.
- Ayus JC, Fuentes NA, Negri AL, et al. Mild prolonged chronic hyponatremia and risk of hip fracture in the elderly. Nephrol Dial Transplant. 2016;31(10):1662–1669. doi: 10.1093/ndt/gfw029.
- van der Meer JW, Netea MG. A salty taste to autoimmunity. N Engl J Med. 2013;368(26):2520–2521. doi: 10.1056/NEJMcibr1303292.
- Movafagh S, Cleemann L, Morad M. Regulation of cardiac Ca(2+) channel by extracellular Na(+). Cell Calcium. 2011;49(3):162–173. doi: 10.1016/j.ceca.2011.01.008.
- Ravel VA, Streja E, Mehrotra R, et al. Serum sodium and mortality in a national peritoneal dialysis cohort. Nephrol Dial Transplant. 2017;32:1224–1233.
- R Core Team. R: a language and environment for statistical computing. Vienna, Austria: R foundation for statistical computing; 2023. https://www.R-project.org/.
- Hoorn EJ, Zietse R. Hyponatremia and mortality: moving beyond associations. Am J Kidney Dis. 2013;62(1):139–149. doi: 10.1053/j.ajkd.2012.09.019.
- Rhee CM, Ayus JC, Kalantar-Zadeh K. Hyponatremia in the dialysis population. Kidney Int Rep. 2019;4(6):769–780. doi: 10.1016/j.ekir.2019.02.012.
- Munoz Mendoza J, Arramreddy R, Schiller B. Dialysate sodium: choosing the optimal hemodialysis bath. Am J Kidney Dis. 2015;66(4):710–720. doi: 10.1053/j.ajkd.2015.03.034.
- Basile C, Libutti P, Lisi P, et al. Sodium setpoint and gradient in bicarbonate hemodialysis. J Nephrol. 2013;26(6):1136–1142. doi: 10.5301/jn.5000236.
- Thomson BK, Huang SH, Chan CT, et al. Plasma sodium setpoint: is it constant or changed by hemodialysis prescription? Asaio J. 2013;59(5):497–504. doi: 10.1097/MAT.0b013e31829ed829.
- Locatelli F, Stefoni S, Petitclerc T, et al. Effect of a plasma sodium biofeedback system applied to HFR on the intradialytic cardiovascular stability. Results from a randomized controlled study. Nephrol Dial Transplant. 2012;27(10):3935–3942. doi: 10.1093/ndt/gfs091.
- MacEwen C, Sutherland S, Daly J, et al. Relationship between hypotension and cerebral ischemia during hemodialysis. J Am Soc Nephrol. 2017;28(8):2511–2520. doi: 10.1681/ASN.2016060704.
- Munoz Mendoza J, Sun S, Chertow GM, et al. Dialysate sodium and sodium gradient in maintenance hemodialysis: a neglected sodium restriction approach? Nephrol Dial Transplant. 2011;26(4):1281–1287. doi: 10.1093/ndt/gfq807.
- Basile C, Pisano A, Lisi P, et al. High versus low dialysate sodium concentration in chronic haemodialysis patients: a systematic review of 23 studies. Nephrol Dial Transplant. 2016;31(4):548–563. doi: 10.1093/ndt/gfv084.
- Basile C, Lomonte C. A neglected issue in dialysis practice: haemodialysate. Clin Kidney J. 2015;8(4):393–399. doi: 10.1093/ckj/sfv038.
- Raimann JG, Ficociello LH, Usvyat LA, et al. Effects of dialysate to serum sodium (Na(+)) alignment in chronic hemodialysis (HD) patients: retrospective cohort study from a quality improvement project. BMC Nephrol. 2018;19(1):75. doi: 10.1186/s12882-018-0870-0.
- Ponce P, Pinto B, Wojke R, et al. Evaluation of intradialytic sodium shifts during sodium controlled hemodialysis. Int J Artif Organs. 2020;43(9):620–624. doi: 10.1177/0391398820903055.
- Ságová M, Wojke R, Maierhofer A, et al. Automated individualization of dialysate sodium concentration reduces intradialytic plasma sodium changes in hemodialysis. Artif Organs. 2019;43(10):1002–1013. doi: 10.1111/aor.13463.
- Kuhlmann U, Maierhofer A, Canaud B, et al. Zero diffusive sodium balance in hemodialysis provided by an algorithm-based electrolyte balancing controller: a proof of principle clinical study. Artif Organs. 2019;43(2):150–158. doi: 10.1111/aor.13328.
- Maduell F, Broseta JJ, Rodríguez-Espinosa D, et al. Practical implementation and clinical benefits of the new automated dialysate sodium control biosensor. Clin Kidney J. 2023;16(5):859–867. doi: 10.1093/ckj/sfad013.
- Penne EL, Thijssen S, Raimann JG, et al. Correction of serum sodium for glucose concentration in hemodialysis patients with poor glucose control. Diabetes Care. 2010;33(7):e91–e91. doi: 10.2337/dc10-0557.