
Abstract
Background
IgA nephropathy (IgAN) is the most common primary glomerulonephritis worldwide. Proliferation-inducing ligand (APRIL) was identified as an important cause of glycosylation deficiency of IgA1 (Gd-IgA1), which can ‘trigger’ IgAN. Our previous study indicated that high migration group protein B2 (HMGB2) in peripheral blood mononuclear cells from patients with IgAN was associated with disease severity, but the underlying mechanism remains unclear.
Materials and methods
The location of HMGB2 was identified by immunofluorescence. qRT-PCR and Western blotting were used to measure HMGB2, HMGA1, and APRIL expression. Gd-IgA1 levels were detected by enzyme-linked immunosorbent assay (ELISA). In addition, we used DNA pull-down, protein profiling, and transcription factor prediction software to identify proteins bound to the promoter region of the APRIL gene. RNA interference and coimmunoprecipitation (Co-IP) were used to verify the relationships among HMGB2, high mobility group AT-hook protein 1 (HMGA1), and APRIL.
Results
HMGB2 expression was greater in IgAN patients than in HCs and was positively associated with APRIL expression in B cells. DNA pull-down and protein profiling revealed that HMGB2 and HMGA1 bound to the promoter region of the APRIL gene. The expression levels of HMGA1, APRIL, and Gd-IgA1 were downregulated after HMGB2 knockdown. Co-IP indicated that HMGB2 binds to HMGA1. The Gd-IgA1 concentration in the supernatant was reduced after HMGA1 knockdown. HMGA1 binding sites were predicted in the promoter region of the APRIL gene.
Conclusion
HMGB2 expression is greater in IgAN patients than in healthy controls; it promotes APRIL expression by interacting with HMGA1, thereby inducing Gd-IgA1 overexpression and leading to IgAN.
Introduction
IgA nephropathy (IgAN) is one of the most common types of primary glomerulonephritis worldwide, and approximately 15–40% of patients with IgAN progress to end-stage renal disease (ESRD) within 20 years of disease onset [Citation1,Citation2]. Although IgAN was first reported more than half a century ago, its pathophysiology has remained unclear [Citation3].
High migration group protein B2 (HMGB2) is a well-conserved chromatin-binding protein that is abundant in lymphoid tissues and the testis [Citation4]. HMGB2 has a low molecular weight and consists of three domains: two 99% homologous HMG boxes (A and B) and a C-terminal acidic ‘tail’ domain [Citation5]. HMGB2 is a nuclear factor that modifies, bends, and changes the structure of chromatin via direct DNA binding or in coordination with other transcription factors, thereby regulating the transcription of several cytokines. We previously identified an association between HMGB2 and the severity of IgAN [Citation6].
A genome-wide association study of IgAN in China revealed that TNFSF13, a gene encoding APRIL, is involved in the pathogenesis of IgAN [Citation7]. APRIL is a member of the tumor necrosis factor superfamily and binds to transmembrane activator and CAML interactor (TACI)/B-cell maturation antigen (BCMA) receptors on the B-cell membrane, promoting B-cell survival, proliferation, and IgA production. The serum IgA concentration is selectively reduced in APRIL-knockout mice, suggesting that APRIL is the key inducer of IgA production [Citation8]. B-cell activating factor (BAFF) is encoded by the TNFSF13B gene; it is another member of the tumor necrosis factor superfamily with high structural and functional homology to APRIL, and it significantly increases circulating IgA levels. BAFF transgenic mice exhibited IgA deposition in the renal mesangial region with several manifestations of IgAN, including hematuria and proteinuria. These findings validate the important role of APRIL in the pathogenesis of IgAN and abnormal glycosylation [Citation9].
Our previous study [Citation10] revealed significantly increased levels of APRIL in the peripheral blood of patients with IgAN, which was closely associated with renal function. APRIL transcript levels were also increased in peripheral blood B cells. APRIL promotes Gd-IgA1 production by binding to its receptor [Citation9]. An ongoing phase II randomized double-blind controlled trial is investigating the effect of an APRIL receptor blocker (atacicept) in the treatment of IgAN (ClinicalTrials.gov Identifier: NCT02808429). The association between APRIL and Gd-IgA1 production has been widely established in IgAN; however, the upstream regulators of APRIL and Gd-IgA1 remain unclear. Thus, we explored the role of HMGB2 as a transcriptional regulator of APRIL in this study.
Materials and methods
Study population
Peripheral blood was collected from twenty patients with primary IgAN and twenty healthy controls to extract CD19+ B cells for multiplex IHC and DNA pull-down assays using an immunomagnetic bead method at The First Affiliated Hospital of Zhengzhou University between 1 February 2021, and 30 April 2021. Seventeen patients with primary IgAN were recruited between 1 May 2021, and 1 October 2021. The diagnosis of IgAN was confirmed by immunofluorescence detection as granular deposition of IgA in the glomerular mesangium. The exclusion criteria were as follows: (a) Henoch-Schonlein purpura syndrome, systemic lupus erythematosus, or chronic hepatic disease; (b) use of corticosteroids or immunosuppressants; and (c) suspected IgAN secondary to other diseases. Six age- and sex-matched healthy controls were recruited during the same period. Peripheral blood (15 mL) was obtained on the morning of renal biopsy (patients) and the day of recruitment (controls). RNA was extracted from CD19+ B cells from seven patients with severe IgAN and six healthy controls, and plasma samples were divided into aliquots and stored at −80 °C. The baseline characteristics of IgAN Patients and healthy controls are shown in Supplementary Table 1.
The Medical Ethics Committee of The First Affiliated Hospital of Zhengzhou University approved the study protocol and informed written consent was obtained from all participants (approval number 2019-KY-016). All participants provided written informed consent.
CD19+ B cells extracted by the immunomagnetic bead method and immunofluorescence detection
Peripheral blood mononuclear cells were prepared by density gradient centrifugation with Ficoll-Paque Plus (GE, United States). CD19+ B lymphocytes were extracted using immunomagnetic beads labeled with an anti-human CD19+ antibody (Miltenyi, Germany) according to the manufacturer’s instructions. Immunofluorescence detection was performed to confirm the location of HMGB2 in CD19+ B lymphocytes (CD19 and HMGB2 antibodies: Abcam, UK).
RNA extraction and cDNA synthesis
RNA was extracted from CD19+ B lymphocytes using TRIzol reagent (Invitrogen, USA). The mRNA concentration was measured by a Nanodrop (Thermo, USA), and cDNA was synthesized using a commercial kit from Whole Gold Biotechnology in a 20 μL reaction. The cDNA was stored at −20 °C.
RT–PCR
The expression of HMGB2 and APRIL was measured by semiquantitative reverse transcription-PCR using AceQ qPCR SYBR Green Master Mix (Takara, Japan) on an Applied Biosystems 7,500 Real-Time PCR system (the primers were designed with Primer 6 and Oligo 7, ). GAPDH was used for normalization, and the results were calculated using the 2−ΔΔct method and subjected to statistical analysis. The primer efficiency was determined by a standard curve, and all primer sets used were not less than 90% efficient. The r-square value of the regression line had to be no less than 0.98.
Table 1. The primer sequences used in this study.
ELISA
Plasma Gd-IgA1 levels were detected with a commercial enzyme-linked immunosorbent assay (ELISA) kit according to the manufacturer’s specifications (IBL, Japan).
Cell culture and RNA interference experiments
The DAKIKI cell line was purchased from ATCC (Manassas, USA) and cultured in RPMI 1640 medium supplemented with 10% heat-inactivated fetal bovine serum (FBS) (Gibco, USA) and 1% penicillin-streptomycin (Shanghai, China). The cells were incubated in a humidified environment with 95% atmospheric air and 5% CO2. DAKIKI cells were added to 12-well plates at 1 × 10⁶ cells/well in four groups: si-NC, HMGB2-siRNA1, HMGB2-siRNA2, and HMGA1-siRNA (RiboBio, China). HMGA1 and HMGB2 knockdown was carried out using riboFECTTMCP Reagent transfection reagent obtained from RiboBio (China) (siRNA/transfection reagent =100 nM). The supernatant was collected for ELISA detection of Gd-IgA1, and the cells were collected for protein and RNA extraction.
Western blot
HMGB2 and β-actin were quantified by Western blotting. Briefly, DAKIKI cells were collected and lysed, after which the proteins were extracted. Protein samples were separated using sodium dodecyl sulfate–polyacrylamide gel electrophoresis for 50 min and transferred to polyvinylidene difluoride membranes for 3 h. Bands were excised according to the molecular weight of the target protein and blocked (5% BSA) for 2 h at room temperature. Primary antibodies diluted with blocking solution were added and incubated overnight at 4 °C or room temperature for 2 h. The samples were washed three times with TBST (10 min), incubated with secondary antibodies (HMGA1: Abcam, England; HMGB2: Abcam, England; β-actin: Servicebio, China) for 1 h at room temperature, and then washed three times at room temperature (10 min). The membrane was immersed in a chemiluminescent substrate (Solarbio, China) for 2 min and visualized in a Bio-Rad gel imaging system (USA).
DNA pull-down and protein mass spectrometry
Briefly, nuclear protein was extracted according to the instructions of the nuclear protein extraction kit (ThermoFisher, USA). The nuclear protein supernatant was transferred to a tube, and an equal amount of DNA probe was added. The biotin-labeled and unbiotin-labeled groups were labeled, and the biotin-methylated probes were mixed and incubated for 6–8 h at 4 °C. The next day, streptavidin magnetic beads (Fitgene, China) were prepared, added to the protein solution, mixed at 4 °C and incubated for 2 h. Then, the magnetic beads were placed in a magnetic separator, and after removing the liquid, 1 mL of RIP wash buffer was added. After 30 cycles of manual mixing, the beads were placed in the magnetic separator, and the liquid was removed. The above steps were repeated twice. After removing the supernatant, biotin eluate was added, and the mixture was eluted at room temperature for 15 min. Then, the mixture was placed in a magnetic separator, and the DNA was removed. The target products were identified by agarose electrophoresis and SDS–PAGE. The primers used for amplification of the TNFSF13 promoter are shown in Supplementary Table 2. The products were eluted and analyzed by protein mass spectrometry for identification (protein mass spectrometry was performed and analyzed by Shandong Weizhen Biosciences, Inc.).
Database retrieval
The raw mass spectra were processed and transformed by MM File Conversion software to obtain MGF files, which were subsequently searched against the UniProt database with MASCOT (http://www.matrixscience.com/).
Co-IP
For coimmunoprecipitation (Co-IP) experiments, cells were collected with a cell scraper and added to RIPA cell lysate containing protease inhibitors according to the instructions of the assay kit. After 20 min of lysis, the cells were centrifuged at 13,000 × g for 10 min at 4 °C. The supernatant was incubated overnight at 4 °C with anti-Flag magnetic beads (Beyotime, Shanghai, China). The beads were washed three times with the inhibitor-containing lysate, and the immune complexes were eluted by SDS–PAGE loading buffer and verified by Western blot analysis.
Transcription factor-binding site prediction
The binding site in the TNFSF13 promoter region was predicted using online transcription factor prediction software (http://consite.genereg.net/).
Statistical analysis
Statistical analyses were performed using SPSS 26.0. Continuous variables were compared using independent sample t-tests and Pearson’s correlations if necessary. Normally distributed data are expressed as the mean ± standard deviation. Other data were analyzed using the Mann–Whitney U test and Spearman’s correlation test and are expressed as medians (first quartile and third quartile). For comparisons among three or more groups, one-way analysis of variance (ANOVA) was used to identify significant differences between groups. A p value <0.05 was considered to indicate statistical significance. *p < 0.05, **p < 0.01, ***p < 0.001, ****p < 0.0001. The mapping was performed using GraphPad Prism software.
Results
Localization of HMGB2 in CD19+ B lymphocytes
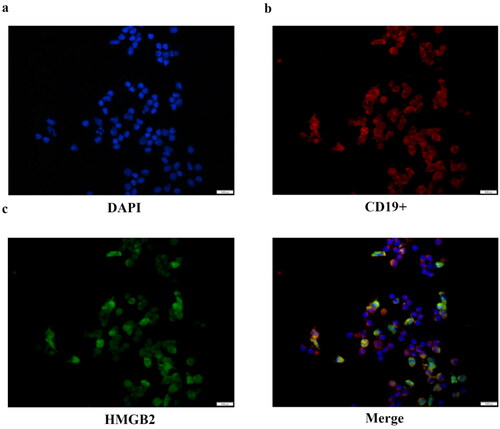
In our previous study, HMGB2 was found to be involved in IgAN and associated with the severity of the disease [Citation6]. Therefore, additional studies are needed to determine the role of B cells in the pathogenesis of IgAN. We detected differences in HMGB2 expression between patients and healthy controls, but the regulatory mechanism involved remains unclear, and additional exploration was performed in this study (Supplementary Figure 2). Previous studies have shown that HMGB2 can be expressed both in the nucleus and cytoplasm [Citation11,Citation12]. We used CD19+ B cells extracted by immunomagnetic beads for immunofluorescence and found that HMGB2 is expressed in the nucleus and cytoplasm of peripheral B cells in both patients and healthy controls ().
Figure 1. The location of HMGB2 in CD19+ B lymphocytes. Ficoll-Paque Plus density gradient centrifugation was used to produce peripheral blood mononuclear cells. Immunomagnetic beads tagged with an anti-human CD19+ antibody were used to extract CD19+ B cells. Representative image of B lymphocytes stained by multiplex IHC. Scale bar, 1000 μm. DAPI (blue), CD19+ (red), HMGB2 (green).
HMGB2 expression was elevated in B cells and was positively associated with APRIL
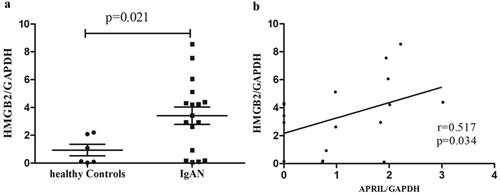
HMGB2 expression was significantly greater in the B cells of patients with IgAN than in those of healthy controls (IgAN vs. HC: 3.40 ± 2.58 vs. 0.94 ± 1.01, p = 0.021; ). Given that APRIL promotes Gd-IgA1 production, we analyzed the correlation between HMGB2 and APRIL in B cells and found a significant positive correlation between them in patients with IgAN (r = 0.517, p = 0.034; ).
Figure 2. The expression level of HMGB2 in IgAN patients and the correlation between HMGB2 and APRIL in CD19+ B lymphocytes. (a) Peripheral blood was drawn from normal controls (n = 6) and IgAN patients (n = 17), and B cells were isolated for RNA extraction. qRT-PCR was used to detect the expression level of HMGB2. p = 0.021. (b) The expression levels of HMGB2 and APRIL were measured by qRT–PCR. Spearman’s correlation test was used to analyze the correlation between HMGB2 and APRIL. R = 0.517, p = 0.034.
APRIL and Gd-IgA1 expression decreased after HMGB2 siRNA knockdown
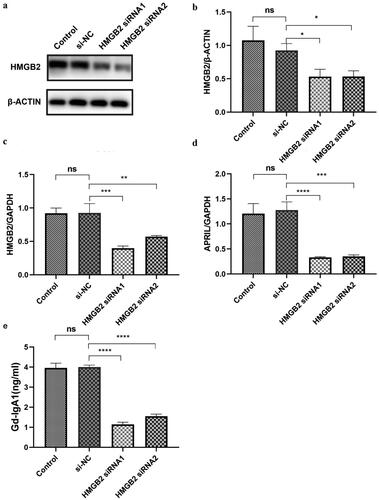
The human immortalized B-cell line DAKIKI was cultured and transfected with HMGB2 siRNA. The protein expression levels of HMGB2 were determined by Western blotting (). The expression of Gd-IgA1 in cell culture supernatants was determined by ELISA, and the relationships among HMGB2, APRIL, and Gd-IgA1 were also assessed. We found that, compared with those in the NC group, the mRNA levels of HMGB2 were significantly lower after DAKIKI cells were treated with siRNA (NC vs. siRNA1: 1 ± 0 vs. 0.40 ± 0.13, p < 0.001; NC vs. siRNA2: 1 ± 0 vs. 0.32 ± 0.10, p < 0.001; ). APRIL expression was also significantly reduced compared with that in the NC group (NC vs. siRNA1: 1 ± 0 vs. 0.50 ± 0.07, p < 0.001; NC vs. siRNA2: 1 ± 0 vs. 0.51 ± 0.07, p < 0.001; ). ELISA revealed that Gd-IgA1 levels also decreased significantly after HMGB2 knockdown (NC vs. siRNA1: 4.07 ± 0.71 vs. 1.20 ± 0.42 ng/mL, p = 0.001; NC vs. siRNA2: 4.07 ± 0.71 vs. 1.57 ± 0.40 ng/mL, p = 0.001; ).
Figure 3. The expression levels of APRIL and Gd-IgA1 after HMGB2 knockdown in the DAKIKI cell line. DAKIKI cells were transfected with si-NC, HMGB2 siRNA1, or HMGB2 siRNA2. The control group was untreated DAKIKI cells. (a) The protein expression level of HMGB2 was detected by Western blot. (b) Densitometric analysis of the WB signals. (c) The mRNA level of HMGB2 was measured by qRT–PCR. (d) The mRNA expression level of APRIL was measured by qRT–PCR. (e) The expression level of Gd-IgA1 in the cell culture supernatant was determined by enzyme-linked immunosorbent assay (ELISA). The experiments were repeated three times. The data are presented as the mean ± SD. *p < 0.05; **p < 0.01; ***p < 0.001; ****p < 0.0001; ns: not significant.
The TNFSF13 promoter-binding protein was identified using a DNA pull-down assay and mass spectrometry
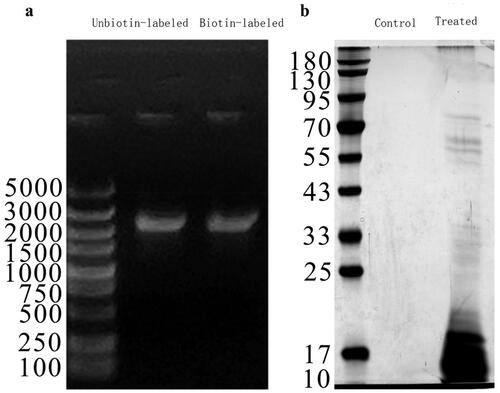
We used DNA pull-down and mass spectrometry to identify proteins that bind to the APRIL-encoding gene TNFSF13 (Supplementary Figure 1 and Supplementary Table 3). CD19+ B cells were extracted from 10 patients with IgAN not treated with hormones or immunosuppressants via immunomagnetic beads. The target fragments were obtained by probe agarose gel electrophoresis and gel extraction. The observed fragment size of the PCR product was similar to that of the target fragment on a 1% agarose gel (). After nucleoprotein extraction from CD19+ B cells, a DNA pull-down assay was conducted, and the products were separated by SDS–PAGE (). The pull-down products with the biotinylated DNA probe and the unbiotin-labeled control were detected by mass spectrometry to screen for differentially expressed proteins. This study identified 276 proteins. Excluding 15 control proteins, 261 proteins can bind to the promoter region of TNFSF13. STRING software was used to construct a protein–protein interaction (PPI) network of the 261 proteins (Supplementary Figure 1). HMGB2 was among these proteins.
Figure 4. Electrophoresis diagram of agarose and SDS–PAGE gel diagram. (a) Agarose electrophoresis map of the DNA probes; (b) SDS–PAGE gel diagram of DNA pull-down.
HMGB2 bound to HMGA1
To explore how HMGB2 regulates APRIL expression, we used STRING software to determine the relationships between the 261 proteins (Figure S1) and HMGB2. In total, 11 proteins had direct or indirect relationships with HMGB2 (HMGA1, HIST1H1B, HIST1H1C, HIST1H1D, HIST1H1E, H1FX, H1F0, NCL, XRCC5, GZMA, and SET; ). Previously, RP-HPLC and mass spectrometry revealed that HMGB2 bound to the high-mobility family member protein HMGA1 [Citation13]. To verify these findings, Western blotting was used to measure the expression of HMGA1 after HMGB2 knockdown (). Furthermore, Co-IP was performed to investigate the possible interactions between HMGB2 and HMGA1. Co-IP demonstrated an interaction between HMGB2 and HMGA1 ().
Figure 5. HMGB2 combined with HMGA1 and HMGA1 may regulate the expression of APRIL and Gd-IgA1. (a) The PPI network shows the relationships of proteins that bind to the promoter region of TNFSF13 with HMGB2. These small circles represent proteins, and the lines linking two proteins represent interactions between proteins. (b–d) DAKIKI cells were transfected with si-NC, HMGB2 siRNA1, or HMGB2 siRNA2. The control group was untreated DAKIKI cells. The protein expression of HMGB2 and HMGA1 after HMGB2 knockdown in DAKIKI cells were decreased. (e) The lysate was immunoprecipitated with an anti-HMGB2 antibody. Western blotting was used to detect the expression of HMGB2 and HMGA1. The experiments were repeated three times. The data are presented as the mean ± SD. *p < 0.05; **p < 0.01, ns not significant.
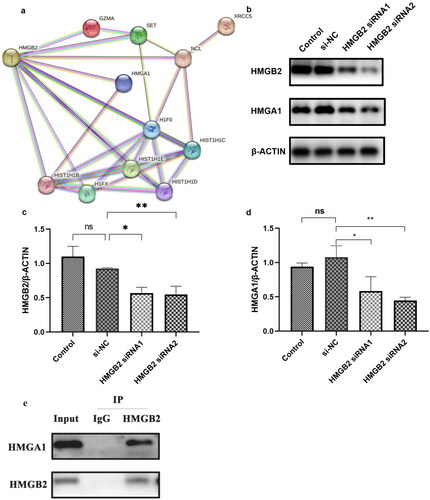
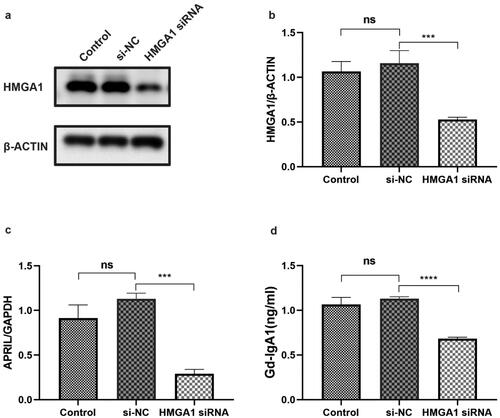
HMGA1 regulates the expression of APRIL and Gd-IgA1
We transfected DAKIKI cells with HMGA1 siRNA to determine the correlation between HMGA1 and APRIL (). Subsequently, the APRIL mRNA expression level was detected by qRT-PCR. The mRNA level of APRIL was reduced after HMGA1 knockdown (). We also detected the expression level of Gd-IgA1 in the supernatant. The results showed that the concentration of Gd-IgA1 in the supernatant was significantly reduced after the cells were treated with HMGA1 siRNA ().
Figure 6. The expression levels of HMGA1, APRIL and Gd-IgA1 in HMGA1-knockdown DAKIKI cells. DAKIKI cells were transfected with si-NC or HMGA1 siRNA. The control group was untreated DAKIKI cells. (a,b) Western blotting and qRT–PCR were used to verify the efficiency of HMGA1 siRNA knockdown. (c) The mRNA expression level of APRIL detected by qRT-PCR. (d) The concentration of Gd-IgA1 in cell supernatants was determined by ELISA. The experiments were repeated three times. The data are presented as the mean ± SD. ***p < 0.001; ****p < 0.0001; ns: not significant.
Predicted binding sites of HMGA1 in the promoter of the TNFSF13 gene
Transcription factor prediction software (http://consite.genereg.net/) identified four putative HMGA1-binding sites in the promoter of the TNFSF13 gene ().
Table 2. The position and sequence of HMGA1 bound to the APRIL-encoding gene TNFSF13.
Discussion
IgAN is one of the most common forms of primary glomerulonephritis worldwide, although its pathogenesis has not been fully elucidated [Citation14,Citation15]. Our results showed that elevated HMGB2 expression in the circulating B lymphocytes of patients with IgAN may promote APRIL expression and induce Gd-IgA1, possibly by interacting with HMGA1, a transcriptional regulator of the APRIL-encoding gene (TNFSF13).
The current study supports APRIL-mediated production of Gd-IgA1 [Citation9,Citation10]. We previously used recombinant human APRIL protein to stimulate peripheral blood B cells and found that patients’ B cells secreted more Gd-IgA1, indicating that APRIL increases Gd-IgA1 production in IgAN [Citation10]. APRIL-targeting drugs have been applied in clinical practice to treat IgAN [Citation16], demonstrating the important role of APRIL in the pathogenesis of IgAN. In our previous study, we verified that HMGB2 expression was slightly correlated with serum Gd-IgA1 levels [Citation6]. In this study, we found that the mRNA expression of HMGB2 was associated with APRIL expression in circulating B lymphocytes. We used siRNA to reduce HMGB2 expression in DAKIKI cells. APRIL expression and Gd-IgA1 levels decreased, suggesting that HMGB2 regulates APRIL and consequently affects Gd-IgA1 expression. However, the mechanism by which HMGB2 regulates APRIL expression remains unknown.
By binding to DNA, the HMGB family, which consists of HMGB1-HMGB4, is involved in the inflammatory response. Following antigen stimulation, cells release HMGB1, which binds and stimulates cell surface receptors in the innate immune system [Citation17]. Since HMGB2 and HMGB1 are nearly identical, they share similar functions and are frequently investigated in the same studies [Citation18]. HMGB2 has antimicrobial effects on several commensal and pathogenic gut microbiota and is involved in the pathogenesis of IgAN [Citation19], which is consistent with our previous report [Citation6]
HMGB2 is involved in transcription, chromatin remodeling, and recombination. HMGB2 can act as a transcription factor, directly inducing target gene expression. A study by Yamanaka also showed that HMGB2 can interact with other transcription factors to promote target gene transcription [Citation20]. Previous studies suggested that ubiquitous expression of HMGB1 and HMGB2 downregulates or upregulates the in vivo transcriptional activity of various p53 family members in cell-specific and promoter-specific manners [Citation21]. Additionally, HMGB2 controls chondrocyte hypertrophy via Wnt signaling and Runt-related transcription Factor 2 [Citation22]. Therefore, we employed DNA pull-down technology to determine the levels of TNFSF13 promoter-binding proteins. We also performed mass spectrometry analysis on the identified proteins. HMGB2 was also among the 261 proteins, suggesting that HMGB2 may directly or indirectly regulate TNFSF13. We used STRING software to assess the relationships between the promoter-binding proteins and HMGB2 and identified 11 proteins directly or indirectly related to HMGB2 (HMGA1, HIST1H1B, HIST1H1C, HIST1H1D, HIST1H1E, H1FX, H1F0, NCL, XRCC5, GZMA, and SET). Sgarra R–RP-HPLC and mass spectrometry indicated that HMGA1 binds to HMGB2 [Citation13]. We also measured the mRNA expression level of APRIL and the concentration of Gd-IgA1 after treating cells with HMGA1 siRNA. The results showed that the expression levels of APRIL and Gd-IgA1 were downregulated. Moreover, co-IP also showed that HMGB2 interacted with HMGA1. As an architectural transcription factor, HMGA1 remodels chromatin structure and promotes interactions between transcriptional regulators and DNA [Citation23]. Shen et al. reported that HMGA1 positively regulates HBV transcription by binding to the conserved ATTGG site within the enhancer II/core promoter (EII/Cp) and recruiting the transcription factors FOXO3α and PGC1α [Citation24]. HMGA1 has recently been implicated in cell proliferation and migration, especially in cancers [Citation25]. Similarly, APRIL promotes lymphocyte proliferation and has been implicated in various cancers [Citation26].
Using transcription factor prediction software (http://consite.genereg.net/), we predicted four HMGA1-binding sites in the promoter region of the TNFSF13 gene. HMGA1 and HMGB2 can regulate gene expression by binding to other transcription factors and regulating the expression of APRIL and Gd-IgA1. Thus, these results showed that HMGB2 regulates APRIL expression by interacting with HMGA1.
However, this study has several limitations that must be addressed. First, more patients should be included to verify our findings; Second, we did not investigate whether HMGA1 is involved in HMGB2 recruitment; Third, we did not explore whether HMGB2 also changed in T cells or other cells in PBMCs.
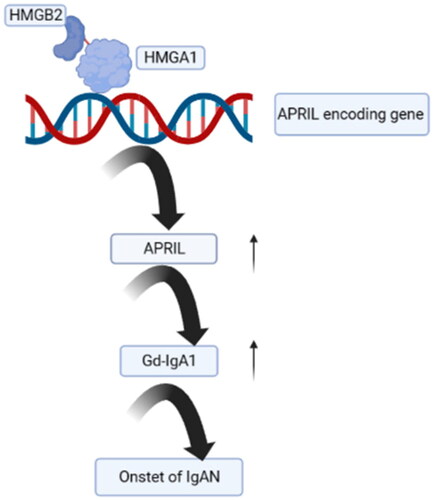
In summary, this study showed that highly expressed HMGB2 binds to HMGA1 and promotes APRIL expression, which in turn increases the production of Gd-IgA1, an initiating factor that eventually leads to the onset of IgAN ().
Figure 7. Hypothesis diagram: HMGB2 can promote the expression of APRIL by binding to HMGA1, leading to the onset of IgAN.
Ethical approval
The Medical Ethics Committee of The First Affiliated Hospital of Zhengzhou University approved the study protocol, and informed written consent was obtained from each participant. All methods reported here were carried out in accordance with the relevant guidelines and regulations of The First Affiliated Hospital of Zhengzhou University.
Author contributions
Conceived and designed experiments: Yaling Zhai and Zhanzheng Zhao; analyzed the data: Huijuan Tian, Wenhui Zhang and Shuaigang Sun; contributed reagents/materials/analysis tools: Zhanzheng Zhao; wrote the paper: Huijuan Tian and Yaling Zhai. All authors read and approved the final manuscript.
Supplemental Material
Download PDF (703.1 KB)Acknowledgements
We would like to express our gratitude to all patients involved in this study and all colleagues in the nephrology lab and the renal pathology department. Extensively acknowledgments are given to the ACS Authoring services (https://acsauthoringservices.enago.cn/) and EditSprings (https://www.editsprings.cn) for competent correction and polishing of the text.
Disclosure statement
No potential conflict of interest was reported by the author(s).
Data availability statement
Raw data used during the current study are available from the corresponding author on reasonable request for noncommercial use.
Additional information
Funding
References
- Berthoux FC, Mohey H, Afiani A. Natural history of primary IgA nephropathy. Semin Nephrol. 2008;28(1):1–11. doi: 10.1016/j.semnephrol.2007.10.001.
- Hassler JR. IgA nephropathy: a brief review. Semin Diagn Pathol. 2020;37(3):143–147. doi: 10.1053/j.semdp.2020.03.001.
- Wyatt RJ, Julian BA. IgA nephropathy. N Engl J Med. 2013;368(25):2402–2414. doi: 10.1056/NEJMra1206793.
- Chao JC, Wan XS, Engelsberg BN, et al. Intracellular distribution of HMG1, HMG2 and UBF change following treatment with cisplatin. Biochim Biophys Acta. 1996;1307(2):213–219. doi: 10.1016/0167-4781(96)00052-8.
- Kropotov AV, Yau P, Bradbury P, et al. Nonhistone chromosome proteins HMG1 and HMG2 stabilize one of the sequence-specific complexes, formed on the promotor of human retroposons of the ALU-family of other nuclear proteins. Mol Gen Mikrobiol Virusol. 1997;(4):32–36.
- Zhai Y, Qi Y, Long X, et al. Elevated hsa-miR-590-3p expression down-regulates HMGB2 expression and contributes to the severity of IgA nephropathy. J Cell Mol Med. 2019;23(11):7299–7309. doi: 10.1111/jcmm.14582.
- Yu X-Q, Li M, Zhang H, et al. A genome-wide association study in Han Chinese identifies multiple susceptibility loci for IgA nephropathy. Nat Genet. 2011;44(2):178–182. doi: 10.1038/ng.1047.
- Castigli E, Scott S, Dedeoglu F, et al. Impaired IgA class switching in APRIL-deficient mice. Proc Natl Acad Sci USA. 2004;101(11):3903–3908. doi: 10.1073/pnas.0307348101.
- Makita Y, Suzuki H, Kano T, et al. TLR9 activation induces aberrant IgA glycosylation via APRIL- and IL-6-mediated pathways in IgA nephropathy. Kidney Int. 2020;97(2):340–349. doi: 10.1016/j.kint.2019.08.022.
- Zhai Y-L, Zhu L, Shi S-F, et al. Increased APRIL expression induces IgA1 aberrant glycosylation in IgA nephropathy. Medicine. 2016;95(11):e3099. doi: 10.1097/MD.0000000000003099.
- Fan Z, Beresford PJ, Zhang D, et al. HMG2 interacts with the nucleosome assembly protein SET and is a target of the cytotoxic T-lymphocyte protease granzyme A. Mol Cell Biol. 2002;22(8):2810–2820. doi: 10.1128/MCB.22.8.2810-2820.2002.
- Küchler R, Schroeder BO, Jaeger SU, et al. Antimicrobial activity of high-mobility-group box 2: a new function to a well-known protein. Antimicrob Agents Chemother. 2013;57(10):4782–4793. doi: 10.1128/AAC.00805-13.
- Sgarra R, Furlan C, Zammitti S, et al. Interaction proteomics of the HMGA chromatin architectural factors. Proteomics. 2008;8(22):4721–4732. doi: 10.1002/pmic.200800193.
- Rodrigues JC, Haas M, Reich HN. IgA nephropathy. Clin J Am Soc Nephrol. 2017;12(4):677–686. doi: 10.2215/CJN.07420716.
- Selvaskandan H, Cheung CK, Muto M, et al. New strategies and perspectives on managing IgA nephropathy. Clin Exp Nephrol. 2019;23(5):577–588. doi: 10.1007/s10157-019-01700-1.
- Lv J, Liu L, Hao C, et al. Randomized phase 2 trial of telitacicept in patients with IgA nephropathy with persistent proteinuria. Kidney Int Rep. 2023;8(3):499–506. doi: 10.1016/j.ekir.2022.12.014.
- Harris HE, Andersson U, Pisetsky DS. HMGB1: a multifunctional alarmin driving autoimmune and inflammatory disease. Nat Rev Rheumatol. 2012;8(4):195–202. doi: 10.1038/nrrheum.2011.222.
- Davies JE, Apta BHR, Harper MT. Cross-reactivity of anti-HMGB1 antibodies for HMGB2. J Immunol Methods. 2018;456:72–76. doi: 10.1016/j.jim.2018.02.006.
- Takaishi H, Kanai T, Nakazawa A, et al. Anti-high mobility group box 1 and box 2 non-histone chromosomal proteins (HMGB1/HMGB2) antibodies and anti-Saccharomyces cerevisiae antibodies (ASCA): accuracy in differentially diagnosing UC and CD and correlation with inflammatory bowel disease phenotype. J Gastroenterol. 2012;47(9):969–977. doi: 10.1007/s00535-012-0566-3.
- Yamanaka Y, Faghihi MA, Magistri M, et al. Antisense RNA controls LRP1 sense transcript expression through interaction with a chromatin-associated protein, HMGB2. Cell Rep. 2015;11(6):967–976. doi: 10.1016/j.celrep.2015.04.011.
- Stros M, Ozaki T, Bacikova A, et al. HMGB1 and HMGB2 cell-specifically down-regulate the p53- and p73-dependent sequence-specific transactivation from the human bax gene promoter. J Biol Chem. 2002;277(9):7157–7164. doi: 10.1074/jbc.M110233200.
- Taniguchi N, Kawakami Y, Maruyama I, et al. HMGB proteins and arthritis. Hum Cell. 2018;31(1):1–9. doi: 10.1007/s13577-017-0182-x.
- Wang Y, Hu L, Zheng Y, et al. HMGA1 in cancer: cancer classification by location. J Cell Mol Med. 2019;23(4):2293–2302. doi: 10.1111/jcmm.14082.
- Shen Z, Wu J, Gao Z, et al. High mobility group at-hook 1 (HMGA1) is an important positive regulator of hepatitis B virus (HBV) that is reciprocally upregulated by HBV X protein. Nucleic Acids Res. 2022;50(4):2157–2171. doi: 10.1093/nar/gkac070.
- Li L, Kim J-H, Lu W, et al. HMGA1 chromatin regulators induce transcriptional networks involved in GATA2 and proliferation during MPN progression. Blood. 2022;139(18):2797–2815. doi: 10.1182/blood.2021013925.
- Ullah MA, Mackay F. The BAFF-APRIL system in cancer. Cancers. 2023;15(6):1791. doi: 10.3390/cancers15061791.