
Abstract
Thioredoxin-interacting protein (TXNIP) is an important regulatory protein for thioredoxin (TRX) that elicits the generation of reactive oxygen species (ROS) by inhibiting the redox function of TRX. Abundant evidence suggests that TXNIP is involved in the fibrotic process of diabetic kidney disease (DKD). However, the potential mechanism of TXNIP in DKD is not yet well understood. In this study, we found that TXNIP knockout suppressed renal fibrosis and activation of mammalian target of rapamycin complex 1 (mTORC1) and restored transcription factor EB (TFEB) and autophagy activation in diabetic kidneys. Simultaneously, TXNIP interference inhibited epithelial-to-mesenchymal transformation (EMT), collagen I and fibronectin expression, and mTORC1 activation, increased TFEB nuclear translocation, and promoted autophagy restoration in HK-2 cells exposed to high glucose (HG). Rapamycin, an inhibitor of mTORC1, increased TFEB nuclear translocation and autophagy in HK-2 cells under HG conditions. Moreover, the TFEB activators, curcumin analog C1 and trehalose, effectively restored HG-induced autophagy, and abrogated HG-induced EMT and collagen I and fibronectin expression in HK-2 cells. Taken together, these findings suggest that TXNIP deficiency ameliorates renal fibrosis by regulating mTORC1/TFEB-mediated autophagy in diabetic kidney diseases.
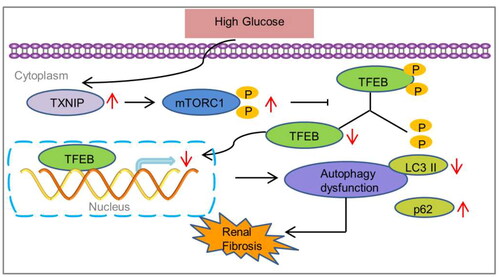
Graphical abstract
1. Introduction
Diabetic kidney disease (DKD), the primary cause of end-stage renal disease, is a major diabetes-related microvascular complication, which increases the heavy economic burden and mortality of diabetic patients worldwide. The deposition of extracellular matrix (ECM) proteins is a typical feature of DKD, which eventually results in glomerulosclerosis and interstitial fibrosis [Citation1]. However, the molecular mechanisms underlying fibrosis in DKD remain unclear, and an optimal therapeutic approach requires further study.
Accumulating evidence has demonstrated that oxidative stress plays an essential role in the process of diabetes-related renal fibrosis [Citation2,Citation3]. Oxidative stress generally results from the alteration of the cellular redox state due to excessive production of reactive oxygen species (ROS), which contributes to the activation of profibrotic signaling pathways [Citation4]. Thioredoxin-interacting protein (TXNIP) is an important regulatory protein for thioredoxin (TRX). TXNIP inhibits the redox function of TRX by binding to its cysteine residues and eliciting the generation of ROS, which results in damage to DNA, proteins, and even organelles in diabetes mellitus [Citation5]. Previous studies have suggested a potential role for TXNIP in DKD through its pro-oxidative stress and profibrotic actions [Citation6,Citation7]. TXNIP deletion ameliorates renal fibrosis, extracellular matrix accumulation, podocyte injury, and inflammation in diabetic mice [Citation8]. In addition, our prior study showed that TXNIP deficiency inhibited high glucose-induced epithelial-to-mesenchymal transformation (EMT) in HK-2 cells [Citation9]. Moreover, TXNIP deoxyribozyme prevents tubulointerstitial fibrosis and oxidative stress by directly suppressing TXNIP activity in diabetic rats [Citation10]. Therefore, the inhibition of TXNIP may be a potential target for the treatment of DKD.
Autophagy is an evolutionarily conserved process of protein degradation by fusion with lysosomes and is responsible for the digestion of redundant cellular components, such as misfolded proteins and damaged organelles. The degradation products can then be used to provide energy or synthesize new proteins [Citation11]. Increasing evidence indicates that impaired autophagy is involved in the development of DKD [Citation12]. Targeting the autophagic pathway to activate and restore autophagy may be a potential therapeutic strategy against DKD [Citation12]. Previous studies have demonstrated that TXNIP mediated dysfunctional autophagy in renal tubular cells in DKD [Citation13,Citation14]. However, the exact mechanism by which this occurs remains unclear.
Transcription factor EB (TFEB) is an important transcriptional factor that enhances autophagy and lysosomal biogenesis [Citation15,Citation16]. A previous study revealed that TFEB expression is decreased in the kidneys of patients with diabetic kidney disease [Citation17]. TFEB activation prevents tubular epithelial cell injury by restoring lysosomal homeostasis in diabetic nephropathy [Citation18]. Recent studies have revealed the crucial role of mTORC1 as a TFEB regulator [Citation19,Citation20]. Our previous study demonstrated that TXNIP deficiency suppresses mTORC1 activation in podocytes exposed to high glucose and glomeruli of diabetic mice [Citation21]. Therefore, we postulated that TXNIP deficiency protects against DKD by modulating mTORC1/TFEB-regulated autophagy, which will be verified in the present study.
2. Materials and methods
2.1. Antibodies and other reagents
Streptozotocin (STZ), mannitol, and d-glucose were purchased from Sigma-Aldrich (St. Louis, MO). The curcumin analog C1, trehalose, rapamycin, and bafilomycin A1 were purchased from MedChemExpress (Monmouth Junction, NJ, USA). Antibodies against fibronectin and collagen I were obtained from Abcam (Cambridge, UK). Antibodies against TXNIP, p-p70S6K, p70S6K, TFEB, LC3B, p62, α-smooth muscle actin (α-SMA), E-cadherin, Histone H3, and β-actin were obtained from Proteintech (Chicago, IL). Biochemical parameter reagent kits for urine and plasma were purchased from BioSino Bio-technology and Science Inc. (Beijing, China). TXNIP shRNA plasmid was obtained from Santa Cruz Biotechnology (Dallas, TX, USA). FuGENE® HD transfection reagent and reverse transcription system were obtained from Promega (Madison, WI, USA). TRIzol reagent was obtained from Invitrogen (Carlsbad, CA, USA). SYBR Premix Ex Taq™ II was purchased from Takara (Shiga, Japan).
2.2. Animals and treatment
C57BL/6J background TXNIP–/– (TXNIP knockout, TKO) mice were obtained using the transcription activator-like effector nuclease (TALEN) technique [Citation22]. Wild-type (WT) littermates were used as the controls. To induce diabetes, 8-week-old male mice received intraperitoneal injections of streptozocin (STZ, 50 mg/kg, dissolved in fresh 0.1 M sodium citrate buffer, pH 4.5) daily for 5 days, and control mice (nondiabetic) merely received citrate buffer. One week later, mice with blood glucose greater than 16.7 mmol/l were regarded as successful models. Blood glucose levels were monitored weekly by using a glucometer (Roche, Basel, Switzerland). Mice were sacrificed at 24 weeks after the onset of diabetes. The kidneys were collected, weighed, and snap-frozen for further analysis. All animal experiments were approved by the Laboratory Animal Ethical and Welfare Committee of Hebei Medical University (No. IACUC-Hebmu-2021030).
2.3. Histology and immunohistochemistry
Renal tissues were fixed in 4% paraformaldehyde and embedded in paraffin. Sections (3-μm thick) were prepared for periodic acid-Schiff (PAS) staining, Sirius red staining and Masson’s trichrome staining. Staining was performed according to the manufacture’s protocol. Subsequently, the glomerular mesangial expansion and sclerosis were evaluated by a semiquantitative index [Citation23]. In addition, immunohistochemistry for the TFEB on renal sections was conducted using an SP kit according to the manufacturer’s protocol, and the semi-quantitative analysis was operated using Imagepro plus software. Briefly, after deparaffinization, rehydration, internal peroxidase inactivation, and antigen retrieval, the sections were blocked with 10% normal goat serum for 30 min at room temperature and then incubated with TFEB antibody overnight at 4 °C. Subsequently, biotinylated secondary antibodies were added to the renal tissues, followed by horseradish peroxidase-conjugated streptavidin and 3,3-diaminobenzidine to produce a brown color. The sections were counterstained with hematoxylin.
2.4. Cell culture and transfection
HK-2 cells (ATCC, American Type Culture Collection, Manassas, VA) were cultured in DMEM-F12 medium containing 10% fetal bovine serum in a humidified 5% CO2 atmosphere at 37 °C. When HK-2 cells were approximately grown at a density of 75%, a plasmid containing TXNIP shRNA or a control shRNA was stably transfected with the transfection reagent FuGENE®HD. Cells were stimulated with normal glucose (NG, 5.6 mM glucose), NG plus mannitol (24.4 mM), high glucose (HG, 30 mM), HG plus shTXNIP, HG plus shTXNIP and bafilomycin A1(100 nM), HG plus curcumin analog C1 (1 μM), rapamycin (50 nM), or trehalose (50 mM) at the indicated time points.
2.5. Immunofluorescence assay
The renal tissues were fixed with 4% paraformaldehyde for 10 min, permeabilized in 0.2% Triton X-100 at room temperature for 10 min, then blocked with goat serum for 30 min at 37 °C. Subsequently, the renal tissues were incubated with antibodies against collagen Ι and TFEB in PBS overnight at 4 °C, and followed by fluorescently labeled secondary antibody for 1 h at 37 °C. After washing five times with PBS, the sections were incubated with DAPI dissolved in PBS for 10 min. Images were captured using a fluorescence microscope (Olympus, Tokyo, Japan).
HK-2 cells were washed twice with PBS and fixed with 4% paraformaldehyde at 4 °C for 10 min. Subsequently, the cells were permeabilized with Triton X-100, sealed with goat serum at room temperature for 30 min, and then incubated with specific primary antibodies against TFEB, LC3B, p62, E-cadherin, and α-SMA at 4 °C overnight, followed by fluorescently labeled secondary antibodies (Proteintech, Chicago, IL) for 1 h at room temperature without light. The cells were then incubated with DAPI for 5 min. Images were obtained using a fluorescence microscope (Olympus, Japan).
2.6. Western blot
Total proteins from the renal cortex or HK-2 cells were extracted using RIPA lysis buffer. Nuclear and cytosolic proteins were obtained using a Minute Cytosolic and Nuclear Extraction Kit (Invent Biotechnologies, Eden Prairie, MN, USA) according to the manufacturer’s instructions. The protein concentration was measured using the Pierce BCA Protein Assay. Equal amounts of total protein (50 μg) in each group were loaded, separated by SDS–PAGE, and transferred to polyvinylidene difluoride membranes (Millipore, Billerica, MA). The membranes were incubated with primary antibodies overnight at 4 °C, followed by goat antirabbit or mouse secondary antibodies, and then the results were analyzed using the Odyssey Fc System (LI-COR, USA).
2.7. Quantitative real-time PCR
After kidneys or HK-2 cells were lysed, total RNA was extracted using the TRIzol reagent and RT-qPCR kits. The sequences of the primers () were designed and synthesized by Sangon Biotech Co, Ltd. (Shanghai, China). RT-qPCR was conducted in a 96-well plate using SYBR Premix Ex Taq™ II, and the reactions were performed on an Agilent Mx3000P QPCR System (Agilent, CA, USA). The results were calculated using the 2−ΔΔCT method, and all experiments were repeated at least thrice.
Table 1. The sequences of the PCR primers in this study.
2.8. Transmission electron microscopy
Renal tissue and HK-2 cells were fixed in 2.5% glutaraldehyde and 1% osmium tetroxide and washed three times with PBS. The samples were then immersed in a series of graded ethyl alcohol solutions for dehydration, embedded in a Quetol 812 mixture (Nissin, Tokyo, Japan), and made into ultrathin sections (70–80 nm). The sections were then double-stained with uranyl acetate and lead citrate. Subsequently, the autophagic vacuoles in cytoplasm were observed and photographed under a transmission electron microscope (Hitachi, Tokyo, Japan). According to the literature, autophagic vacuole is morphologically characteristic as a double membrane organelle containing undegraded cytoplasmic material and no lysosomal proteins under transmission electron microscope [Citation24].
2.9. Statistical analysis
All data are expressed as mean ± standard deviation (SD). Statistical analysis was performed using one-way ANOVA with IBM SPSS Statistics 21.0. Statistical significance was defined as p < 0.05.
3. Results
3.1. Animal characteristics
At the end of 24 weeks, the levels of body weight, kidney/body weight, serum creatinine, blood urea nitrogen, and urine albumin excretion for 24 h were significantly changed in diabetic mice compared to those in wild-type mice, and were effectively reversed by TXNIP knockout (). Blood glucose level was remarkably higher in the DM group than in the WT group, whereas TXNIP knockout had no effect on blood glucose level (). In addition, kidney weight and blood pressure levels were similar among all groups ().
Table 2. Animal characteristics.
3.2. TXNIP deletion mitigated fibrosis in diabetic kidneys
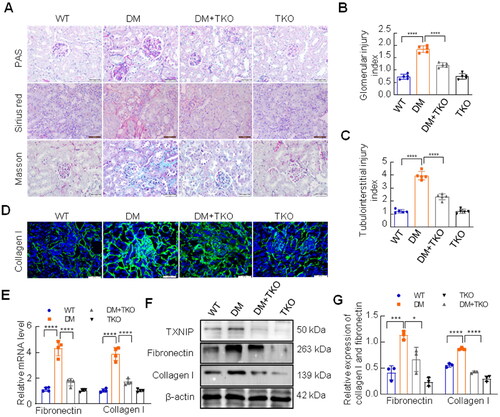
The results of PAS staining exhibited that diabetes-induced mesangial area expansion was efficiently suppressed by TXNIP absence (). Sirius red staining and Masson’s trichrome staining were performed to assess the impact of TXNIP on renal fibrosis. The results revealed huge amounts of collagen deposition in diabetic kidneys, which was alleviated by TXNIP knockout (). Immunofluorescence staining displayed that the expression of collagen I was reduced by TXNIP excision in diabetic mice (). As shown in , the mRNA levels of collagen I and fibronectin were significantly elevated in the DM group, but were reduced by TXNIP knockout (). Western blotting analysis showed that the protein level of TXNIP was significantly increased in kidneys of DM group compared with WT group, while it was completely blocked by TXNIP knockout (). TXNIP absence reversed diabetes-induced increased expression of collagen I and fibronectin in renal tissues ().
Figure 1. Effects of TXNIP deficiency on renal fibrosis in diabetic kidneys. (A) Renal pathological changes were examined by PAS staining, Sirius red staining and Masson trichrome staining (Bar = 50 μm). Glomerular injury index for PAS staining (B) and tubulointerstitial injury index for Masson trichrome staining (C) were measured. (D) The expression of collagen I was detected by immunofluorescence (Bar = 50 μm). (E) The mRNA levels of collagen I and fibronectin were analyzed by RT-qPCR. (F, G) The expression of TXNIP, collagen I and fibronectin was analyzed by western blotting. ****p < 0.0001; 0.0001 <***p < 0.001; 0.01<*p < 0.05.
3.3. TXNIP deletion inhibited mTORC1 activation and reverted TFEB and autophagy activation in diabetic kidneys
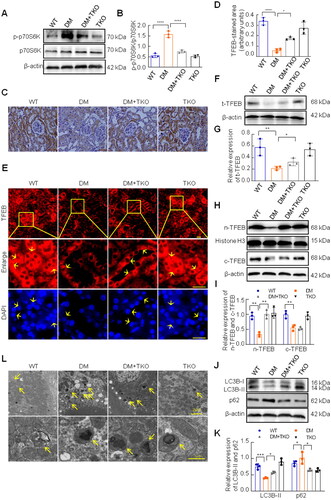
mTORC1 activates various signaling molecules in eukaryotic cells depending on its phosphorylation status and has been confirmed to be involved in many diseases, including DKD [Citation25]. Therefore, we examined the activation of mTORC1 in the diabetic mice. Compared to the WT group, the expression of phosphorylated p70S6K, the downstream effector of mTORC1 activation, was increased in the DM group, which was inhibited by TXNIP knockout (). It is well known that TFEB is a key effector of mTORC1 to regulate the transcription of various genes, including autophagy-related ones [Citation26]. In the present study, we assessed TFEB expression and autophagy activation in the kidneys of diabetic mice. Immunohistochemical staining showed that the expression of TFEB was obviously decreased in the DM group compared to that in the WT group, and increased in the DM plus TKO group (). The immunofluorescence staining of TFEB demonstrated more precisely that both cytoplasmic TFEB and nuclear TFEB were strongly expressed in tubule epitheliums in WT group and WT + TKO group, but significantly lightened in DM group. However, the deletion of TXNIP could promote the increase of nuclear TFEB under diabetic condition (). Because TFEB activation is characterized by increased nuclear translocation [Citation26], we further determined the expression of total TFEB, nuclear TFEB and cytoplasmic TFEB respectively by western blotting analysis, and the results showed that TFEB expression was reduced in the DM group compared to the WT group, while the absence of TXNIP significantly promoted the expression of TFEB, dominantly nuclear TFEB in diabetic kidneys (). Compared with WT mice, the expression of LC3B-II was markedly decreased and the expression of p62 was obviously increased in the kidneys of diabetic mice. However, TXNIP knockout effectively reversed these changes (). We assessed the number of autophagic vacuoles using a transmission electron microscopy. Compared with WT mice, diabetic mice exhibited more autophagic vacuoles in the renal tubular epithelial cells, which were improved by TXNIP deletion ().
Figure 2. Effects of TXNIP deficiency on activation of mTORC1 and TFEB, and autophagy in diabetic kidneys. (A, B) The expression of p-p70S6K and p70S6K was analyzed by western blotting. (C) Immunohistochemical staining with TFEB antibody (Bar = 50 μm), and semi-quantitative analysis for TFEB (D). (E) Immunofluorescence staining with TFEB antibody, and yellow arrows displayed nuclear TFEB or tubular nuclear(Bar = 20 μm). Western blotting was implemented to examined the levels of total TFEB (F, G), nuclear TFEB and cytoplasmic TFEB (H, I), LC3B and p62 (J, K). (L) Autophagic vacuoles in renal tubular cells were observed by the transmission electron microscope, and yellow arrows represented autophagic vacuoles (bar = 2 μm, or 1 μm). ****p < 0.0001; 0.0001 <***p < 0.001; 0.001 <**p < 0.01; 0.01 <*p < 0.05.
3.4. Knockdown of TXNIP inhibited fibrotic response in HK-2 cells exposed to HG
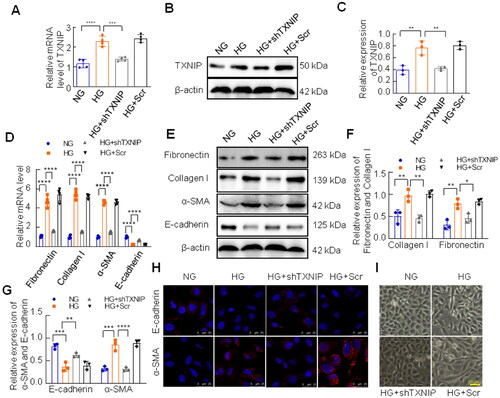
Matrix protein deposition and spindle-shaped structural polarity in tubular epithelial cells are characteristics of EMT, which contributes to the pathogenesis of renal fibrosis [Citation27,Citation28]. In the present study, we assessed the role of TXNIP deficiency in the EMT in vitro. HK-2 cells were transfected with TXNIP shRNA plasmid or control vector and treated with HG for 48 h. The mRNA and protein level of TXNIP was efficiently inhibited by the TXNIP shRNA plasmid in HK-2 cells under HG conditions (). Meanwhile, high glucose significantly increased the mRNA levels of fibronectin, collagen I, and α-SMA and reduced the mRNA level of E-cadherin (), which was consistent with the results of western blotting analysis (). However, these alterations were reversed by transfection with TXNIP shRNA plasmid (). In addition, immunofluorescence of E-cadherin and α-SMA further confirmed the results above (). Morphologically, HG-induced changes, which were from typical epithelial cuboidal shape to spindle-shaped structural polarity, were improved by TXNIP knockdown ().
Figure 3. Effects of TXNIP deficiency on fibrotic responses in HK-2 cells exposed to HG. The mRNA and protein levels of TXNIP were analyzed by RT-qPCR and western blotting respectively (A–C). (D) The mRNA levels of fibronectin, collagen I, α-SMA and E-cadherin were assessed by RT-qPCR. (E–G) The expression of fibronectin, collagen I, E-cadherin and α-SMA was analyzed by western blotting. (H) E-cadherin and α-SMA was detected by immunoinfluorence (bar = 25 μm). (I) Morphological alterations of HK-2 cells were observed by the inverted microscope (bar = 50 μm). ****p < 0.0001; 0.0001 < ***p < 0.001; 0.001 <**p < 0.01; 0.01 <*p < 0.05.
3.5. Knockdown of TXNIP inhibited HG-induced mTORC1 activation and promoted TFEB and autophagy activation in vitro
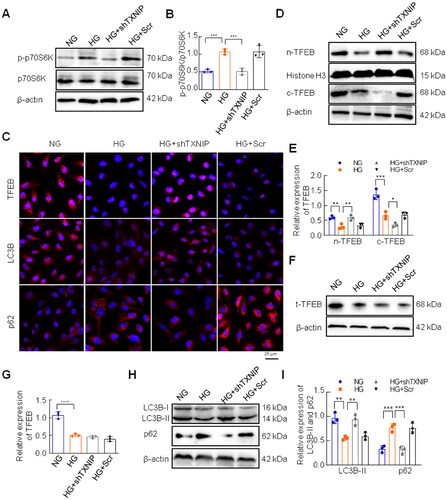
We evaluated the effects of TXNIP knockdown on mTORC1 and TFEB activation in HK-2 cells exposed to HG. Western blotting showed that HG-induced phosphorylation of p70S6K was inhibited by TXNIP knockdown (). TFEB nuclear translocation, which reflects TFEB activity, was significantly lower in the HG group than in the NG group, and this change was restored by TXNIP interference (). Western blotting analysis showed that high glucose decreased the levels of nuclear TFEB, cytoplasmic TFEB and total TFEB in HK-2 cells, whereas TXNIP knockdown mainly restored the nuclear TFEB, not cytoplasmic or total TFEB (). In addition, we found that TXNIP knockdown obviously modified the expression of LC3B and p62 in HK-2 cells under HG conditions. Compared to the NG group, LC3B-II expression was decreased and p62 expression was increased in the HG group, whereas these HG-induced alterations were reversed by TXNIP knockdown (). To further clarify whether TXNIP impacts the fibrotic injury of DKD via autophagy, we employed bafilomycin A1, an autophagy inhibitor, to stimulate HK-2 cells transfected with TXNIP shRNA plasmid. Our results showed that TXNIP knockdown changed the expression of LC3B and p62 induced by high glucose in HK-2 cells, which was restored by bafilomycin A1 (Supplementary Figure S1(A–C)). Interestingly, bafilomycin A1 also retarded the inhibitory effect of TXNIP knockdown on fibrotic responses in HK-2 cells under high glucose conditions (Supplementary Figure S1(A,D,E)).
Figure 4. Effects of TXNIP deficiency on activation of mTORC1 and TFEB, as well as autophagy in HK-2 cells exposed to HG. (A, B) The expression of p-p70S6K and p70S6K was analyzed by western blotting. (C) The expression of TFEB, LC3B and p62 was examined in HK-2 cells by immunofluorescence (Bar = 25 μm). The expression of cytoplasmic TFEB, nuclear TFEB and total TFEB (D–G), LC3B and p62 (H, I) was analyzed by western blotting. ****p < 0.0001; 0.0001 <***p < 0.001; 0.001 <**p < 0.01; 0.01 <*p < 0.05.
3.6. Inhibition of mTORC1 restored HG-induced TFEB and autophagy activation in HK-2 cells
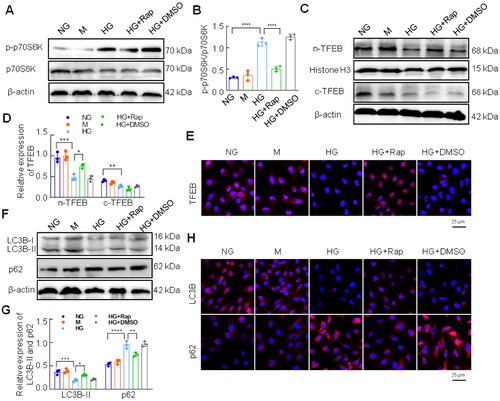
Rapamycin is an effective mTORC1 inhibitor that we used to ascertain the effects of mTORC1 on TFEB activation and autophagy in HG-treated HK-2 cells. As shown in , rapamycin significantly suppressed phosphorylation of p70S6K in HK-2 cells under HG conditions (). Western blotting results showed that nuclear TFEB was remarkably increased by rapamycin stimulation in HG-treated HK-2 cells (), which was consistent with the results of the immunofluorescence assay (). Moreover, rapamycin treatment reversed the expression of LC3B and p62 in HG-exposed HK-2 cells (). The immunofluorescence assay also showed that the levels of LC3B and p62 in HK-2 cells under high conditions were reversed by rapamycin treatment of HK-2 cells ().
Figure 5. Effects of inhibition of mTORC1 on activation of TFEB and autophagy in HK-2 cells under high glucose conditions. (A, B) The expression of p-p70S6K and p70S6K was analyzed by western blotting. (C, D) The expression of cytoplasmic TFEB and nuclear TFEB was analyzed by western blotting. (E) Immunofluorescence staining for TFEB was conducted in HK-2 cells (Bar = 25 μm). Western blotting (F, G) and immunofluorescence staining (H) were performed to examine the expression of LC3B and p62 (Bar = 25 μm). ****p < 0.0001; 0.0001 <***p < 0.001; 0.001 <**p < 0.01; 0.01 <*p < 0.05.
3.7. Activated TFEB improved autophagy in HG-treated HK-2 cells
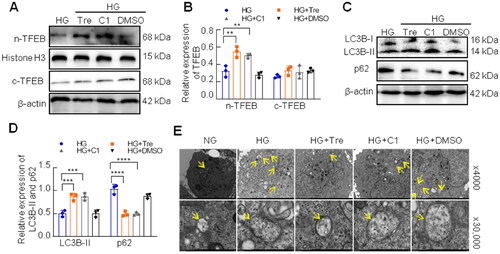
Several studies have shown that trehalose and curcumin analog C1 are nontoxic activators of TFEB by enhancing its nuclear translocation [Citation29,Citation30]. To explore the effect of activated TFEB on autophagy, HK-2 cells were pretreated with the curcumin analog C1 or trehalose for 2 h and co-cultured with HG for 48 h. As shown in , the TFEB nuclear translocation was significantly enhanced by curcumin analog C1 or trehalose treatment in HK-2 cells under HG conditions (). Curcumin analog C1 or trehalose increased LC3B-II expression and decreased p62 expression in HK-2 cells exposed to HG (). In addition, transmission electron microscopy revealed that curcumin analog C1 and trehalose significantly reduced the number of autophagic vacuoles in HK-2 cells under HG conditions ().
Figure 6. Effect of activated TFEB on autophagy flux in HK-2 cells exposed to HG. (A, B) The expression of cytoplasmic TFEB and nuclear TFEB was analyzed by western blotting. (C, D) Western blotting analysis for the expression of LC3B and p62. (E) Autophagic vacuoles in HK-2 cells were observed by the transmission electron microscope, and yellow arrows represented autophagic vacuoles (×4,000, or ×30,000). ****p < 0.0001; 0.0001 <***p < 0.001; 0.001 <**p < 0.01.
3.8. Activated TFEB improved EMT of HK-2 cells under high glucose conditions
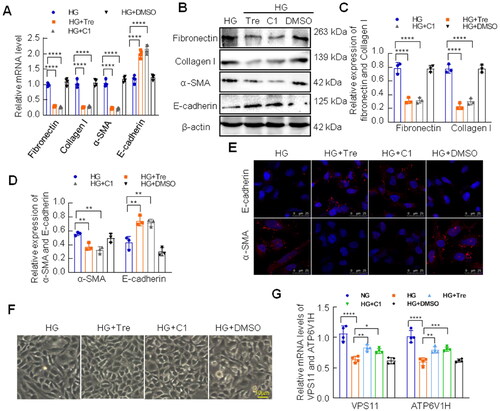
To further investigate the effect of activated TFEB on the HG-induced fibrotic response in HK-2 cells, we examined the levels of fibronectin, collagen I, E-cadherin, and α-SMA using RT-qPCR and western blotting analysis. The results showed that the mRNA and protein levels of fibronectin, collagen I, and α-SMA were reduced by treatment with curcumin analog C1 or trehalose in HG-treated HK-2 cells (). However, curcumin analog C1 and trehalose significantly increased E-cadherin expression (). Consistent with the results above, immunofluorescence staining displayed that the expression of E-cadherin and α-SMA induced by HG was efficiently reversed by curcumin analog C1 or trehalose treatment (). Furthermore, inverted microscopy confirmed that curcumin analog C1 or trehalose restored the morphological changes induced by HG (). Taken together, these results suggest that the activation of TFEB alleviates fibrosis by restoring autophagy in HK-2 cells under HG conditions. Additionally, we examined the mRNA levels of TFEB target genes, VSP11 and ATP6V1H, to observe the activation status of TFEB in HK-2 cells cultured with trehalose or curcumin analog C1 in HK-2 cells under high glucose conditions. We found that the high glucose suppressed the mRNA levels of VPS11 and ATP6V1H, which were restored by trehalose or curcumin analog C1 ().
Figure 7. Effect of activated TFEB on EMT of HK-2 cells under HG conditions. (A) The mRNA levels of fibronectin, collagen I, α-SMA and E-cadherin were assessed by RT-qPCR. (B–D) The expression of fibronectin, collagen I, E-cadherin and α-SMA was analyzed by western blotting. (E) E-cadherin and α-SMA was detected by immunoinfluorence staining (Bar = 25 μm). (F) Morphological alterations of HK-2 cells were observed by the inverted microscope (Bar = 50 μm). (G) The mRNA levels of VPS11and ATP6V1H were assessed by RT-qPCR. ****p < 0.0001; 0.0001 <***p < 0.001; 0.001 <**p < 0.01; 0.01 <*p < 0.05.
4. Discussion
In the present study, we demonstrated that TXNIP was involved in renal fibrosis in diabetic kidney disease. TXNIP knockout inhibited fibrosis and mTORC1 activation, and restored TFEB and autophagy activation in diabetic kidneys. In addition, the in vitro results indicated that TXNIP deficiency prevented HG-induced fibrotic responses by regulating the mTORC1/TFEB-mediated autophagy pathway.
As a key regulator of reductase TRX, TXNIP plays a critical role in the progression of DKD via regulating oxidative stress [Citation7,Citation8]. Several reports have suggested that the high level of TXNIP is always accompanied by collagen accumulation in diabetic kidneys, indicating that TXNIP may be associated with renal fibrosis [Citation7,Citation10,Citation31,Citation32]. Ji et al. demonstrated that inhibition of TXNIP improves oxidative stress and renal fibrosis by reversing the redox activity of TRX in a diabetic environment [Citation32]. In addition, our previous studies showed that TXNIP knockout improved renal function, alleviated lipid accumulation, podocyte apoptosis and phenotypic alterations, as well as oxidative stress in DKD [Citation21,Citation22,Citation33]. In this study, we employed TXNIP-knockout mice to explore its role in diabetes-induced renal fibrosis. We found that TXNIP deficiency impeded kidney fibrosis and deposition of ECM proteins fibronectin and collagen I in diabetic kidneys. Our results are consistent with those of previous studies [Citation8].
Accumulating evidence indicates that autophagy, one of the mechanisms underlying the pathogenesis of DKD, has attracted considerable research attention. Autophagy suppresses transforming growth factor-beta 1(TGF-β1)-induced collagen I expression in primary mouse mesangial cells, and prevents excess accumulation of collagen in the kidneys [Citation34]. In addition, inhibition of autophagy by 3-MA increases tubular cell apoptosis and tubulointerstitial fibrosis in the kidney after unilateral ureteral obstruction (UUO) [Citation35]. Autophagy deficiency in the kidney proximal tubules enhances collagen deposition in the renal interstitium of diabetic mice, indicating a protective role of autophagy in DKD [Citation36]. Moreover, promoting autophagy activation may be a target for alleviating renal tubulointerstitial fibrosis in DKD [Citation37]. In the present study, we demonstrated that TXNIP deletion promoted renal autophagy activity in diabetic mice. Meanwhile, HG-induced autophagy disorder, EMT, and expression levels of fibronectin and collagen I were reversed by TXNIP knockdown in HK-2 cells. These results suggest that TXNIP deficiency alleviates fibrosis by restoring autophagic activity in DKD.
Previous studies have demonstrated that TFEB-related lysosome and autophagy disorders play pivotal roles in acute kidney injury and chronic kidney disease, including DKD [Citation38–40]. Overexpression of TFEB inhibits cisplatin-induced apoptosis by restoring autophagy in HK-2 cells [Citation40]. In addition, pharmacological activation of TFEB attenuates renal tubule injury, apoptosis, and inflammation in db/db mice [Citation18]. The present study showed that HG led to a reduction in TFEB nuclear translocation in HK-2 cells. TXNIP knockdown promotes TFEB nuclear translocation and restores autophagic flux in HG-treated HK-2 cells. Moreover, we found that two activators of TFEB, trehalose and curcumin analog C1, efficiently increased TFEB nuclear translocation, promoted autophagy restoration, and inhibited EMT, and fibronectin and collagen I expression in HK-2 cells exposed to HG. These results imply that TXNIP deficiency exerts a protective effect against renal fibrosis by activating TFEB/autophagy in DKD.
As an evolutionarily conserved protein kinase, mTOR consists of two distinct complexes, mTOR complex 1 (mTORC1) and mTOR complex 2 (mTORC2). The former can be activated by amino acids, suppressed by energy deficiency, and is involved in cell metabolism, growth, and proliferation. In general, high levels of downstream molecules, such as phosphorylated p70S6K, represent activation of the mTORC1 signaling pathway in cells [Citation41]. There is growing evidence that mTORC1 activation plays a role in the pathophysiology of DKD [Citation42]. Inhibition of mTORC1 activity alleviates the progression of DKD in diabetic mice [Citation43]. In diabetes, mTORC1 activity is increased in renal proximal tubule cells (RPTCs), and partial blockage of mTORC1 activity in RPTCs inhibits renal fibrosis [Citation44]. Moreover, previous studies showed that activated mTORC1 prevented TFEB nuclear translocation, and further decreased lysosome biogenesis and autophagy-related proteins transcription [Citation19,Citation20,Citation41]. In the present study, TXNIP deficiency repressed mTORC1 activation and promoted TFEB nuclear translocation in diabetic mice and HK-2 cells exposed to HG. Rapamycin, an effective mTORC1 inhibitor, remarkably promoted TFEB nuclear translocation and restored autophagic flux in HG-treated HK-2 cells. Taken together, our results indicate that TXNIP deficiency promotes TFEB activity by suppressing mTORC1 activation in DKD mice.
There is growing evidence that TXNIP plays an essential role in the progression of DKD. Through directly binding to TRX, TXNIP fosters the production of ROS, activates TGF-β1 signaling pathway and consequently induces renal fibrosis in DKD [Citation5,Citation10]. It was also reported that activation of mTORC1 induced by TGF-β1 is involved in renal fibrosis in chronic kidney disease [Citation45]. Additionally, dysfunction of TFEB, accompanied with impaired mitophagy, is associated with tubular senescence and renal fibrosis [Citation46]. Chronic senescence of tubular epithelial cells exacerbates renal fibrosis by mTORC1-autophagy axis [Citation47,Citation48]. Huang and colleagues revealed that TXNIP deficiency attenuates diabetes-induced blockage of tubular autophagic flux via suppressing mTOR in diabetic rat kidneys [Citation14]. Moreover, it has been reported that high expression of TXNIP, which blocks mTORC1/TFEB-mediated autophagy, attributes to the progression of the liver inflammation and fibrosis in nonalcoholic steatohepatitis [Citation49]. Currently, it is recognized that overproduction of ROS leads to dysfunction of autophagy by activating mTORC1 in CKD [Citation50]. Therefore, we concluded that excessive TXNIP is responsible for impaired autophagy through ROS/mTORC1/TFEB signaling axis in renal tubular epitheliums under diabetic conditions.
In conclusion, our results demonstrated that TXNIP deficiency alleviates renal fibrosis by modulating mTORC1/TFEB-mediated autophagy in diabetic kidney disease. These data suggest that TXNIP is a potential target for the treatment of renal fibrosis in DKD.
Credit statements
Du Y: Conceptualization, methodology, investigation, writing–original draft. Wu M: Validation, formal analysis. Song S: Visualization, investigation. Bian Y: Investigation, data duration. Shi Y: Supervision, project administration, writing–reviewing and editing, funding acquisition.
Supplemental Material
Download PDF (74.4 KB)Disclosure statement
All of the authors declared no competing interests.
Data availability statement
The authors confirm that all the data supporting the results of this study are available within the article and from the corresponding authors upon reasonable request.
Additional information
Funding
References
- Reidy K, Kang HM, Hostetter T, et al. Molecular mechanisms of diabetic kidney disease. J Clin Invest. 2014;124(6):1–14. doi: 10.1172/JCI72271.
- Jha JC, Banal C, Chow BS, et al. Diabetes and kidney disease: role of oxidative stress. Antioxid Redox Signal. 2016;25(12):657–684. doi: 10.1089/ars.2016.6664.
- Ren H, Shao Y, Wu C, et al. VASH-1 regulates oxidative stress and fibrosis in diabetic kidney disease via SIRT1/HIF1α and TGFβ1/Smad3 signaling pathways. Front Mol Biosci. 2020;7:137. doi: 10.3389/fmolb.2020.00137.
- Sedeek M, Nasrallah R, Touyz RM, et al. NADPH oxidases, reactive oxygen species, and the kidney: friend and foe. J Am Soc Nephrol. 2013;24(10):1512–1518. doi: 10.1681/ASN.2012111112.
- Schulze PC, Yoshioka J, Takahashi T, et al. Hyperglycemia promotes oxidative stress through inhibition of thioredoxin function by thioredoxin-interacting protein. J Biol Chem. 2004;279(29):30369–30374. doi: 10.1074/jbc.M400549200.
- Advani A, Gilbert RE, Thai K, et al. Expression, localization, and function of the thioredoxin system in diabetic nephropathy. J Am Soc Nephrol. 2009;20(4):730–741. doi: 10.1681/ASN.2008020142.
- Kobayashi T, Uehara S, Ikeda T, et al. Vitamin D3 up-regulated protein-1 regulates collagen expression in mesangial cells. Kidney Int. 2003;64(5):1632–1642. doi: 10.1046/j.1523-1755.2003.00263.x.
- Shah A, Xia L, Masson EA, et al. Thioredoxin-interacting protein deficiency protects against diabetic nephropathy. J Am Soc Nephrol. 2015;26(12):2963–2977. doi: 10.1681/ASN.2014050528.
- Wei J, Shi Y, Hou Y, et al. Knockdown of thioredoxin-interacting protein ameliorates high glucose-induced epithelial to mesenchymal transition in renal tubular epithelial cells. Cell Signal. 2013;25(12):2788–2796. doi: 10.1016/j.cellsig.2013.09.009.
- Tan CY, Weier Q, Zhang Y, et al. Thioredoxin-interacting protein: a potential therapeutic target for treatment of progressive fibrosis in diabetic nephropathy. Nephron. 2015;129(2):109–127. doi: 10.1159/000368238.
- Parzych KR, Klionsky DJ. An overview of autophagy: morphology, mechanism, and regulation. Antioxid Redox Signal. 2014;20(3):460–473. doi: 10.1089/ars.2013.5371.
- Ding Y, Choi ME. Autophagy in diabetic nephropathy. J Endocrinol. 2015;224(1):R15–30. doi: 10.1530/JOE-14-0437.
- Huang C, Lin MZ, Cheng D, et al. Thioredoxin-interacting protein mediates dysfunction of tubular autophagy in diabetic kidneys through inhibiting autophagic flux. Lab Invest. 2014;94(3):309–320. doi: 10.1038/labinvest.2014.2.
- Huang C, Zhang Y, Kelly DJ, et al. Thioredoxin interacting protein (TXNIP) regulates tubular autophagy and mitophagy in diabetic nephropathy through the mTOR signaling pathway. Sci Rep. 2016;6(1):29196. doi: 10.1038/srep29196.
- Sardiello M, Palmieri M, di Ronza A, et al. A gene network regulating lysosomal biogenesis and function. Science. 2009;325(5939):473–477. doi: 10.1126/science.1174447.
- Settembre C, Di Malta C, Polito VA, et al. TFEB links autophagy to lysosomal biogenesis. Science. 2011;332(6036):1429–1433. doi: 10.1126/science.1204592.
- Brijmohan AS, Batchu SN, Majumder S, et al. HDAC6 inhibition promotes transcription factor EB activation and is protective in experimental kidney disease. Front Pharmacol. 2018;9:34. doi: 10.3389/fphar.2018.00034.
- Wang S, Jing K, Wu H, et al. Activation of transcription factor EB alleviates tubular epithelial cell injury via restoring lysosomal homeostasis in diabetic nephropathy. Oxid Med Cell Longev. 2022;2022:2812493. doi: 10.1155/2022/2812493.
- Martina JA, Chen Y, Gucek M, et al. MTORC1 functions as a transcriptional regulator of autophagy by preventing nuclear transport of TFEB. Autophagy. 2012;8(6):903–914. doi: 10.4161/auto.19653.
- Vega-Rubin-de-Celis S, Peña-Llopis S, Konda M, et al. Multistep regulation of TFEB by MTORC1. Autophagy. 2017;13(3):464–472. doi: 10.1080/15548627.2016.1271514.
- Song S, Qiu D, Shi Y, et al. Thioredoxin-interacting protein deficiency alleviates phenotypic alterations of podocytes via inhibition of mTOR activation in diabetic nephropathy. J Cell Physiol. 2019;234(9):16485–16502. doi: 10.1002/jcp.28317.
- Du C, Wu M, Liu H, et al. Thioredoxin-interacting protein regulates lipid metabolism via akt/mTOR pathway in diabetic kidney disease. Int J Biochem Cell Biol. 2016;79:1–13. doi: 10.1016/j.biocel.2016.08.006.
- Zhao HJ, Wang S, Cheng H, et al. Endothelial nitric oxide synthase deficiency produces accelerated nephropathy in diabetic mice. J Am Soc Nephrol. 2006;17(10):2664–2669. doi: 10.1681/ASN.2006070798.
- Eskelinen E-L. Fine structure of the autophagosome. Methods Mol Biol. 2008;445:11–28. doi: 10.1007/978-1-59745-157-4_2.
- Yasuda-Yamahara M, Kume S, Maegawa H. Role of mTOR in diabetic kidney disease. Antioxidants (Basel). 2021;10(2):321. doi: 10.3390/antiox10020321.
- Zhang W, Li X, Wang S, et al. Regulation of TFEB activity and its potential as a therapeutic target against kidney diseases. Cell Death Discov. 2020;6(1):32. doi: 10.1038/s41420-020-0265-4.
- Badid C, Desmouliere A, Babici D, et al. Interstitial expression of alpha-SMA: an early marker of chronic renal allograft dysfunction. Nephrol Dial Transplant. 2002;17(11):1993–1998. doi: 10.1093/ndt/17.11.1993.
- Carew RM, Wang B, Kantharidis P. The role of EMT in renal fibrosis. Cell Tissue Res. 2012;347(1):103–116. doi: 10.1007/s00441-011-1227-1.
- Li Z, Yao Q, Tian Y, et al. Trehalose protects against cisplatin-induced cochlear hair cell damage by activating TFEB-mediated autophagy. Biochem Pharmacol. 2022;197:114904. doi: 10.1016/j.bcp.2021.114904.
- Song JX, Sun YR, Peluso I, et al. A novel curcumin analog binds to and activates TFEB in vitro and in vivo independent of MTOR inhibition. Autophagy. 2016;12(8):1372–1389. doi: 10.1080/15548627.2016.1179404.
- Jha JC, Dai A, Garzarella J, et al. Independent of renox, NOX5 promotes renal inflammation and fibrosis in diabetes by activating ROS-sensitive pathways. Diabetes. 2022;71(6):1282–1298. doi: 10.2337/db21-1079.
- Ji L, Wang Q, Huang F, et al. FOXO1 overexpression attenuates tubulointerstitial fibrosis and apoptosis in diabetic kidneys by ameliorating oxidative injury via TXNIP-TRX. Oxid Med Cell Longev. 2019;2019:3286928. doi: 10.1155/2019/3286928.
- Song S, Qiu D, Wang Y, et al. TXNIP deficiency mitigates podocyte apoptosis via restraining the activation of mTOR or p38 MAPK signaling in diabetic nephropathy. Exp Cell Res. 2020;388(2):111862. doi: 10.1016/j.yexcr.2020.111862.
- Kim SI, Na HJ, Ding Y, et al. Autophagy promotes intracellular degradation of type I collagen induced by transforming growth factor (TGF)-β1. J Biol Chem. 2012;287(15):11677–11688. doi: 10.1074/jbc.M111.308460.
- Kim WY, Nam SA, Song HC, et al. The role of autophagy in unilateral ureteral obstruction rat model. Nephrology (Carlton). 2012;17(2):148–159. doi: 10.1111/j.1440-1797.2011.01541.x.
- Ma Z, Li L, Livingston MJ, et al. p53/microRNA-214/ULK1 axis impairs renal tubular autophagy in diabetic kidney disease. J Clin Invest. 2020;130(9):5011–5026. doi: 10.1172/JCI135536.
- Han YC, Tang SQ, Liu YT, et al. AMPK agonist alleviate renal tubulointerstitial fibrosis via activating mitophagy in high fat and streptozotocin induced diabetic mice. Cell Death Dis. 2021;12(10):925. doi: 10.1038/s41419-021-04184-8.
- Lee SJ, Kim YA, Park KK. Anti-fibrotic effect of synthetic noncoding decoy ODNs for TFEB in an animal model of chronic kidney disease. Int J Mol Sci. 2022;23(15):8138. doi: 10.3390/ijms23158138.
- Yang C, Chen XC, Li ZH, et al. SMAD3 promotes autophagy dysregulation by triggering lysosome depletion in tubular epithelial cells in diabetic nephropathy. Autophagy. 2021;17(9):2325–2344. doi: 10.1080/15548627.2020.1824694.
- Zhu L, Yuan Y, Yuan L, et al. Activation of TFEB-mediated autophagy by trehalose attenuates mitochondrial dysfunction in cisplatin-induced acute kidney injury. Theranostics. 2020;10(13):5829–5844. doi: 10.7150/thno.44051.
- Condon KJ, Sabatini DM. Nutrient regulation of mTORC1 at a glance. J Cell Sci. 2019;132(21):jcs222570. doi: 10.1242/jcs.222570.
- Fantus D, Rogers NM, Grahammer F, et al. Roles of mTOR complexes in the kidney: implications for renal disease and transplantation. Nat Rev Nephrol. 2016;12(10):587–609. doi: 10.1038/nrneph.2016.108.
- Inoki K, Mori H, Wang J, et al. mTORC1 activation in podocytes is a critical step in the development of diabetic nephropathy in mice. J Clin Invest. 2011;121(6):2181–2196. doi: 10.1172/JCI44771.
- Kogot-Levin A, Hinden L, Riahi Y, et al. Proximal tubule mTORC1 is a central player in the pathophysiology of diabetic nephropathy and its correction by SGLT2 inhibitors. Cell Rep. 2020;32(4):107954. doi: 10.1016/j.celrep.2020.107954.
- Nakano T, Watanabe H, Imafuku T, et al. Indoxyl sulfate contributes to mTORC1-induced renal fibrosis via the OAT/NADPH oxidase/ROS pathway. Toxins (Basel). 2021;13(12):909. doi: 10.3390/toxins13120909.
- Wang D, Kang L, Chen C, et al. Loss of legumain induces premature senescence and mediates aging-related renal fibrosis. Aging Cell. 2022;21(3):e13574. doi: 10.1111/acel.13574.
- Luo C, Zhou S, Zhou Z, et al. Wnt9a promotes renal fibrosis by accelerating cellular senescence in tubular epithelial cells. J Am Soc Nephrol. 2018;29(4):1238–1256. doi: 10.1681/ASN.2017050574.
- Cayo A, Venturini W, Rebolledo-Mira D, et al. Palbociclib-induced cellular senescence is modulated by the mTOR complex 1 and autophagy. Int J Mol Sci. 2023;24(11):9284. doi: 10.3390/ijms24119284.
- Park HS, Song JW, Park JH, et al. TXNIP/VDUP1 attenuates steatohepatitis via autophagy and fatty acid oxidation. Autophagy. 2021;17(9):2549–2564. doi: 10.1080/15548627.2020.1834711.
- Guo H, Bechtel-Walz W. The interplay of autophagy and oxidative stress in the kidney: what do we know? Nephron. 2023;147(10):627–642. doi: 10.1159/000531290.