Abstract
Azo dyes are widely used in the food, pharmaceutical, paper, and textile industries. Some azo dyes are known to produce carcinogenic compounds upon reductive cleavage of the azo bond (N =N) by intestinal flora. There is not much information available on the effect of these dyes on the physiology of the gut microflora as well as their kinetics of reduction in different environments. The azoreductase activity of Enterococcus faecalis, an important opportunistic intestinal pathogen, was tested using the azo dyes Methyl Red, Direct Blue 15 and tartrazine under the following conditions: a complex supplemented brain heart infusion (BHIS) medium under aerobic and anaerobic conditions, a simple phosphate-buffered saline glucose (PBSG) medium under anaerobic conditions, and cell extracts using NADH and NADPH as electron donors, under aerobic conditions. The kinetics of reduction in all these conditions was determined. The effect of high and low concentrations of each dye on the growth of E. faecalis was also tested. Our results show that the sulfonated azo dye tartrazine was completely reduced extracellularly in BHIS under aerobic and anaerobic conditions while the other sulfonated azo dye, Direct Blue 15 was completely reduced only under anaerobic conditions. The non-polar azo dye, Methyl Red was also completely reduced, with the highest rate of reduction in both conditions. The generation time of E. faecalis in the presence of high concentration of tartrazine was significantly lower than the control, while the generation time was unaffected in the presence of low and high concentrations of Methyl Red, Direct Blue 15 and 20 µM tartrazine. Our results suggest that the metabolism of different azo dyes by E. faecalis depends on the physiochemical properties of the azo dyes and the conditions of the surrounding environment in the presence of actively dividing cells.
Introduction
Human beings are constantly exposed to various xenobiotics from the environment. The main route of entry for these xenobiotics is the gastrointestinal (GI) tract Citation[1]. The metabolic complexity of gut microflora has played an important role in the metabolism of drugs Citation[2] and azo dyes Citation[3], Citation[4].
Azo dyes are widely used in the paper, textile, food, cosmetic, and pharmaceutical industries and the reduction of the azo bond (N = N) is observed by decolorization of the dye Citation[5]. The distal region of the GI tract is mainly anaerobic and under these conditions most of the azo compounds are biologically reduced Citation[6]. Azo dye metabolism is of interest from the human health perspective because several intestinal microorganisms possess azoreductase activity and some of these dyes are known to produce mutagenic and carcinogenic compounds upon reduction Citation[7]. Besides their role in carcinogenesis, the biological role of azo reduction and the impact from these types of diverse azo dyes on the intestinal microbial ecology and overall human health is poorly understood. To this end, very little information is available regarding the physiological effect of azo dyes on the gut flora.
Enterococcus faecalis is an important organism and opportunistic pathogen of the gut due to its role in food fermentation, nosocomial infections, and resistance to multiple antibiotics Citation[8]. The biochemical and molecular biology of the bacterium has been well characterized. The azoreductase activity of the cellular extracts has been shown for Red 2G as a model azo dye Citation[9]. In addition, an aerobic FMN-dependent azoreductase gene from E. faecalis has been isolated Citation[10] and the protein has been crystallized Citation[11]. Unfortunately, there is not much information on the growth phase response and the corresponding azoreductase activity rates for E. faecalis with different sulfonated and nonsulfonated azo dyes, which can provide valuable biological information and impact measurements for this important intestinal bacterium.
This study investigated the effects of azo dyes on the growth of an E. faecalis strain isolated from the human intestine. The kinetics of azo dye reduction in the lag and log phase of growth under both aerobic and anaerobic conditions in complex and simple media as well as in the cell extracts of this strain was studied. Methyl Red, a mono, nonsulfonated azo dye and pH indicator is a model azo dye used in several studies. Tartrazine is also a mono, sulfonated azo dye and is currently used in the food industry. Direct Blue 15 is a bis, sulfonated azo dye, which upon reduction, produces 3′,3′-dimethoxybenzidine, a known carcinogenic compound Citation[12].
Materials and methods
Bacterial strain and media
E. faecalis ATCC 27274 was grown in Brain Heart Infusion (Difco Laboratories, Sparks, MD, USA) supplemented with (per liter): 10 g yeast extract, 0.075 mg K2HPO4, 0.175 mg KH2PO4, 0.450 mg (NH4)2SO4, 0.045 mg NaCl, 0.09 mg MgSO4, 0.015 mg CaCl2, 0.002 mg hemin, 400 mg Na2CO3, and 600 mg cysteine-HCl; pH was adjusted to 7.0. This supplemented BHI medium (BHIS) was prepared anaerobically in an ethanol-sterilized anaerobic glove-box (Forma Scientific, Model 1024, Marietta, OH, USA) after sterilization in an autoclave at 15 psi for 20 min at 121°C. Modified phosphate-buffered saline-glucose (PBSG: 137 mM NaCl, 2.7 mM KCl, 10 mM Na2PO4, 2 mM KH2PO4, 600 mg cysteine-HCl, 6 mM glucose, pH adjusted to 7.4) was used as the growth-arrest medium. To prepare the glycerol stocks, 200 µl of sterile 80% glycerol was mixed with 800 µl E. faecalis culture (grown in BHIS) and stored at −80°C.
Azo dyes
Azo dyes used in this study were, Methyl Red (MCB Chemicals, Norwood, OH, USA; molecular weight, 269.31, 2[4-(CH3)2NC6H4N:N]C6H4CO2H, CAS registry 63451-28-5), Direct Blue 15 (MP Biomedicals, Solon, OH, USA, molecular weight 992.8, C34H24N6O16S4Na4, CAS registry 2429-74-5), and tartrazine (Sigma, St Louis, MO, USA, molecular weight, 534.4, C16H9N4Na3O9S2, CAS registry 1934-21-0).
The assay for each dye in all culture and cell extract experiments was carried out using three independent replicates and the data are presented as the mean of the three data points with standard deviations.
Anaerobic azoreductase assay for whole cells
Nine ml of BHIS containing 20 µM of each azo dye was dispensed into separate screw-capped (with a rubber septum) test-tubes in the anaerobic glove-box with an atmosphere of nitrogen. A loopful of E. faecalis from a frozen glycerol stock was aseptically transferred to a sterile BHIS tube (containing no dye) and incubated at 37°C without shaking. After incubation for 12 h, 5 ml of this culture was transferred to a 250 ml bottle containing 100 ml of BHIS and incubated again at 37°C. The culture was allowed to grow to mid-log phase (optical density600 ∼0.4) and immediately 1 ml was transferred to the 9 ml BHIS test-tubes containing the respective azo dyes using a sterile 1 ml syringe and needle (26 G1/2) (BD, Franklin Lakes, NJ, USA) in the anaerobic glove-box. For the control experiment, 1 ml of sterile BHIS was added to the test-tubes instead of the E. faecalis culture. The tubes were inverted twice to mix and incubated at 37°C. After 5 min time intervals for Methyl Red and 10 min time intervals for tartrazine and Direct Blue 15, the set of three test-tubes (for each dye) were removed from the incubator and 1 ml from each tube was transferred to a 1.5 ml microfuge tube. The samples were centrifuged at 14 000 g for 1 min and the supernatant was transferred to a plastic cuvette (Spectrocell, Oreland, PA, USA). The azoreductase activity was determined by a decrease in the absorbance maxima wavelength peak area for the azo dyes using a UV-visible spectrophotometer (UV-1601PC, Shimadzu, Columbia, MD, USA). The peak area for Direct Blue 15 was determined between wavelengths 500 and 700 nm, tartrazine between 400 and 500 nm, and Methyl Red between 420 and 500 nm. The concentration of the dyes was determined from the dye calibration graph using known concentrations of the azo dyes dissolved in BHIS. The pellet from the centrifuged sample was resuspended in distilled water and the optical density (OD) at 600 nm was used to determine growth.
PBSG was used as the growth-arrest medium to determine azoreductase activity. One hundred ml of mid-log phase E. faecalis culture in BHIS was centrifuged at 6000 g for 10 min. The supernatant was discarded and the pellet was washed and resuspended in 100 ml of sterile oxygen-free PBSG. One ml of this sample was subsequently transferred to 9 ml of PBSG containing the azo dye and incubated at 37°C. The amount of each dye used in the assay was the same and azoreductase activity was determined as above.
Aerobic azoreductase activity by whole cells
Ten ml of mid-log phase E faecalis culture was added to 40 ml of BHIS containing 20 µM of the azo dyes in separate 500 ml Erlenmeyer flasks. The flasks were incubated at 37°C. To assure oxygen saturation, the flasks were incubated on a shaker at 200 rpm. At 1 h time intervals, 1 ml samples were removed aseptically and the azoreductase activity was determined as above. Ten ml of sterile BHIS was added instead of the E. faecalis culture for the control experiments.
Preparation of cell extracts
E. faecalis was grown for 24 h in 2 L BHIS at 37°C. The cells were harvested at 6000 g for 10 min at 4°C. The pellet was resuspended in 30 ml lysis buffer (50 mM K2HPO4- KH2PO4 buffer, pH 8.0, 300 mM NaCl, and 10% glycerol). Lysozyme was added to a final concentration of 1 mg/ml and the sample was incubated on ice for 1 h. The sample was sonicated for 2 min on ice using an intermediate probe of a Sonic 300 Dismembrator (Artek Systems Corporation, Farmindale, NY, USA). The homogenate was centrifuged at 20 000 g for 20 min at 4°C and the supernatant was collected and stored at −20°C.
Azoreductase assay of the cell extract
The assay was performed in a final volume of 1 ml and contained 50 mM K2HPO4-KH2PO4 buffer, pH 7.2, 20 µM azo dye, 20 µM FMN, 0.5 mM NADH or NADPH, and an appropriate amount of cell extract. The solution was made anaerobic by bubbling with oxygen-free nitrogen for 20 min. The sample was preincubated at 37°C for 5 min and the reaction was initiated by the addition of NADH or NADPH. Azoreductase activity was determined by an absorbance reduction in the first 2 min at 430 nm for Methyl Red, 428 nm for tartrazine, and 604 nm for Direct Blue 15 using a UV-visible spectrophotometer (UV-1601PC, Shimadzu). The concentrations of the respective dyes were determined from a calibration graph using known concentrations of the azo dyes dissolved in the assay buffer.
Protein determination
The Lowry method Citation[13] was used to determine the protein content from whole cells (prepared by alkaline lysis) for the experiments in BHIS and PBSG using bovine serum albumin (BSA) as a standard. The protein content in the cell extracts was determined by applying the formula: mg/ml = 1.55A280–0.76A260Citation[14].
Results
Reduction of azo dyes by whole cells
Methyl Red, tartrazine, and Direct Blue 15 were completely reduced in 20 min, 40 min, and 50 min, respectively, when E. faecalis was grown in BHIS anaerobically (a). The dye controls remained stable over the time course for the experiments (data not shown). Due to an increase in biomass with every subsequent time interval, each dye concentration data point was divided by the whole cell total protein amount (determined by the Lowry method) for that particular time interval to normalize the data for biomass content.
Figure 1. Reduction of Direct Blue 15, Methyl Red, and tartrazine by E. faecalis whole cells. The units on the y-axis are expressed as dye concentration (µM) per milligram of total protein. (a) Anaerobic reduction. The 10 ml culture inoculated with mid-log phase cells was incubated without shaking at 37°C. (b) Aerobic reduction. The 500 ml flasks containing 50 ml culture were incubated at 37°C and 200 rpm. Due to the high biomass, the ratio of dye concentration to amount to total protein on the y-axis is lower compared with the anaerobic assay. (c) PBSG medium (prolonged lag phase/growth-arrest). The 10 ml culture inoculated with mid-log phase cells (washed in PBSG buffer) was incubated without shaking at 37°C. The controls contained dye only in BHIS or PBSG. Each data point is the mean of triplicates.
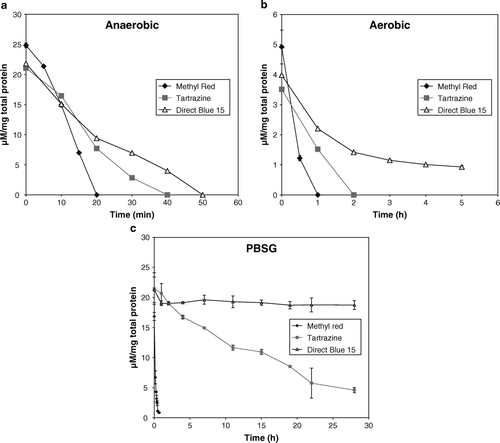
Under aerobic conditions, it took three times longer to completely reduce Methyl Red and tartrazine compared with anaerobic conditions (b). Similarly, Direct Blue 15 was not completely reduced under aerobic conditions and only 75% of the dye was reduced in 4 h. The incomplete reduction of Direct Blue 15 produced a non-linear reduction rate that was asymptotic to time.
To address the influence of bacterial growth phase and the contribution of a complex medium on azo dye reduction, the reduction of these dyes was tested in a simple buffered medium (PBSG) anaerobically. Glucose was added to the PBS buffer as a source of electrons for azo dye reduction. The cells, which had grown to log phase in BHIS, were washed with the buffer before their introduction into the PBSG medium. Although there was no growth in this medium (OD600 remained constant over time), the cells were still viable because cell growth resumed when the cells, after 24 h incubation in PBSG, were transferred to BHIS (data not shown). Hence, the cells are in a prolonged lag phase in the PBSG medium. c shows that Direct Blue 15 was not reduced. The 90% Methyl Red reduction, which occurred in 20 min (c), was similar to the value obtained in the anaerobic BHIS condition (a). Tartrazine was reduced by 80% in 28 h (c), which was significantly longer than its complete reduction in anaerobic BHIS, which took 40 min (a). The overall pattern of reduction for the azo dyes in PBSG was the same as BHIS, i.e. the reduction rate for Methyl Red was the highest followed by tartrazine and Direct Blue 15. The data suggest that the rate of azo dye reduction is influenced by the growth phase of the cells and possibly contribution from BHIS as well.
Kinetics of azo dye reduction
The quantitative rates of azo dye reduction under various conditions are shown in . The kinetic rate values were calculated from the linear portion of the curves. All the data were compared to the reduction rate kinetics of whole cells in BHIS under anaerobic conditions, since these rates were highest for all three dyes. The reduction rate for Methyl Red was consistently high in BHIS under anaerobic conditions, PBSG medium, and the cell extract using NADH as the electron source. However, the reduction of Methyl Red decreased when cells were incubated aerobically and the kinetic rate for NADPH was less than NADH.
Table I. Kinetics of azo dye reduction by E. faecalis whole cells and cell extract.
The reduction rate kinetics for tartrazine reduced by more than half in the cell extract assay using NADH and a further decrease was observed in activity under aerobic growth conditions and with cell extract using NADPH. However, in the PBSG medium, there was a 60-fold decrease in reduction kinetics. Direct Blue 15 showed a fourfold decrease in reduction kinetics under aerobic conditions and very low activity in the cell extract assays. There was no detectable reduction for Direct Blue 15 in the PBSG medium. Even when the biomass was increased almost 10-fold for the experiment in PBSG, the reduction rate kinetics for tartrazine and Direct Blue 15 was still lower than the values in BHIS under anaerobic conditions (data not shown). The decrease in azoreductase activity in the cell extract compared to the whole cells for tartrazine and Direct Blue 15 suggests that most of the reduction of these dyes occurs outside the cell or is associated with actively growing cells. The reduction kinetics of Direct Blue 15 is >90% lower than tartrazine in the cell extract assays, while it is only 25% lower in the anaerobic BHIS condition (). The reduction rate of Methyl Red was the same in the whole cell and cell extract assay using NADH as the electron donor, which suggests that due to its small size (molecular weight 269.31) and hydrophobic nature, the dye may diffuse into the cell.
Effect of azo dyes on cell growth
The effect of the three azo dyes, at concentrations of 20 µM and 200 µM, on the generation time of E. faecalis when grown anaerobically in the presence of BHIS is shown in . There was no significant difference between the generation times of E. faecalis grown in the presence of Methyl Red compared to the control. However, the generation time and biomass in 200 µM of Methyl Red was significantly higher than 20 µM (c). There was a significant decrease in the generation times of E. faecalis when grown in the presence of tartrazine as compared with the control. In addition, the final biomass increased when the cells were grown in the presence of 200 µM tartrazine compared with 20 µM (a). The results suggest that tartrazine stimulates growth of cells in BHIS. When E. faecalis was grown in mineral salt medium with 20 µM tartrazine as the only carbon source and monitored over a 4 week period, there was no increase in biomass, although there was approximately 50% reduction in dye concentration compared with the control (data not shown). Hence the stimulation of growth by tartrazine in BHI is not due to its role as an additional carbon source. There was no significant difference in the generation time and biomass of cells grown in 200 µM Direct Blue 15 compared to the 20 µM Direct Blue 15 (b).
Figure 2. The effect of azo dyes on the growth of E. faecalis. (a) Tartrazine, 20 µM and 200 µM. (b) Direct Blue 15, 20 µM, and 200 µM. (c) Methyl Red, 20 µM and 200 µM. The data are a mean of triplicates.
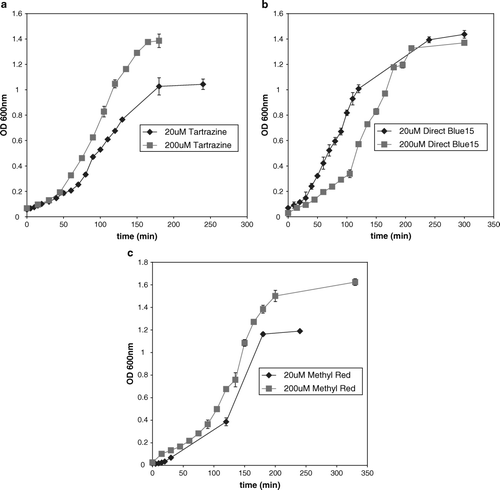
Table II. Generation time of E. faecalis in the presence of various azo dyes.
The growth profiles of E. faecalis in the presence of both concentrations of Methyl Red and tartrazine was the same, but there was a difference in the growth profile when the cells were grown in the presence of 200 µM Direct Blue 15 compared with 20 µM. The cells grown in the presence of 200 µM Direct Blue 15 reached log phase after 2 h, while the cells grown in 20 µM reached log phase after 30 min (b). However, after 3 h of growth in the presence of both concentrations of Direct Blue 15 the overall biomass was the same. The initial 200 µM concentration of Direct Blue 15 may have an inhibitory effect on the growth rate because the dye to cell ratio is high. This was observed by the presence of a blue pellet when the sample was prepared (see Materials and methods). The blue pellet may signify that the reduction rate is saturated and the non-reduced dye molecules have attached to the cell wall. Since the dye is a large molecule (molecular weight = 992.8), its presence on the cell wall may prevent the transport of essential nutrients from the medium to the cell. When the dye to cell ratio is reduced, maximum growth rate resumes. This was observed by the disappearance of the blue color in the pellet during later sample processing.
Discussion
The role of intestinal microflora in health and disease is not fully understood and currently there is very little information available on the physiological effect of these azo dyes on them. This is the first study to show the kinetics of azo dye reduction at different physiological growth phases as well as the effect of these azo dyes on the growth rate of E. faecalis.
The milieu of the GI tract is rich in nutrients and the metabolic activity of the microflora is very high. E. faecalis is an important and major resident of the distal region of GI tract. Hence, BHIS was chosen to simulate a nutrient-rich and complex environment to study the azoreductase activity. The colon, where E. faecalis resides, is similar to a chemostat, since the flow of nutrients in a healthy adult is continuous and the microflora rarely encounters a nutrient-poor situation in order to reach stationary phase Citation[15]. Since the microflora are constantly dividing and are metabolically very active, it was reasoned that azoreductase activity would be highest in the log phase. The current study demonstrated, via kinetic analysis, that the reduction was highest when cells were actively growing in BHIS under anaerobic conditions ().
The three azo dyes used in this study were chosen because of their unique properties (). Methyl Red is a non-polar, mono azo dye, tartrazine is a polar, sulfonated, mono azo dye, and Direct Blue 15 is a polar, sulfonated, bis azo dye. It has been shown that the functional group in the vicinity of the azo bond can affect the rate of azo reduction Citation[16], Citation[17]. In Methyl Red, the hydrogen of the hydroxyl group from the carboxylic acid in the ortho position can form a hydrogen bond with the nitrogen from the azo bond, thus reducing the electron density around it. The reduced electron density around the azo bond may make it more amenable to reductive cleavage. Tartrazine and Direct Blue 15 have multiple sulfonic acid groups, making them very hydrophilic. The close proximity of the sulfonic group and the methyl ester group in Direct Blue 15, both of which are ortho to the azo bond, may cause steric hindrance for azo bond cleavage. In tartrazine, as compared with Direct Blue 15, the lack of bulky groups around the azo bond may lower steric hindrance, providing more access for reductive cleavage. A greater amount of tartrazine may be entering the cell compared with Direct Blue 15, possibly due to tartrazine (molecular weight = 534.4) being a smaller compound than Direct Blue 15 (molecular weight = 992.8). Since the redox potential of the three azo dyes is lower than the redox potential of oxygen, the data suggest that the presence of oxygen may sequester the electrons from the azo bond, thereby reducing the rate of reduction. On the other hand, BHIS medium, which is complex and supports rapid growth of E. faecalis, may contribute indirectly by acting in concert with extracellular byproducts of the metabolically active E. faecalis to reduce the azo dyes. Therefore the physiological state of rapidly growing E. faecalis in BHIS may also contribute to the rate of azo dye reduction because metabolism and transport in the log phase is high. Currently, there is no information available on the effect of the bacterial growth phase on azo dye reduction and our results are the first to demonstrate this effect.
Figure 3. Structure of Methyl Red, Direct Blue 15 and tartrazine Citation[5].
![Figure 3. Structure of Methyl Red, Direct Blue 15 and tartrazine Citation[5].](/cms/asset/e8502af1-8747-43da-b888-4998a161163a/zmeh_a_317129_f0003_b.gif)
Further, the non-polar Methyl Red may enter the cell through simple or facilitated diffusion, while the entry of the polar dyes tartrazine and Direct Blue 15 is more difficult because the cell membrane is non-polar. In addition, their entry may be further limited in the lag phase (PBSG medium) where metabolism and transport is low. The non-detectable and low azoreductase activity of Direct Blue 15 and tartrazine, respectively, in PBSG and very low reduction level in cell extracts may indicate that the high reduction rate in the complex BHIS medium in an anaerobic environment occurs by a non-enzymatic mechanism, since it is known that reduced inorganic compounds from microbial metabolism increase the reduction rate of azo dyes Citation[6]. Rafii et al. Citation[5] showed that azoreductase activity in Clostridium perfringens and other intestinal bacteria was irreversibly inactivated in the presence of oxygen, but our data show that azoreductase activity in the presence of oxygen was only reduced but not inhibited (b, ). BHIS alone does not contribute to azo dye reduction, as observed in the control experiments that contained dye only and no cells. When E. faecalis was boiled and added to BHIS with the azo dyes and incubated for 12 h, there was no reduction observed (data not shown). Similarly, the growth of another unrelated organism in BHIS did not contribute to azo dye reduction, as observed by the growth of Actinomyces odontolyticus in the presence of 20 µM Direct Blue 15 (unpublished data). This shows that the reduction of Direct Blue 15 in BHI by E. faecalis is specific to the organism and not the medium.
The majority of the current research in this field has focused on identifying and isolating the azoreductase gene from the organisms. The azoreductase flavoprotein that was isolated from E. faecalis was specific for NADH and not NADPH Citation[10]. However, our results with cell extract show that azoreductase activity was observed with NADPH as well (). This result is in agreement with an earlier study Citation[9]. It strongly suggests that there are other azoreductases present within a cell. However, the higher extracellular azoreductase activity observed for the sulfonated dyes indicates that the role of intracellular azoreductases in the reduction of these dyes is minimal.
The results have shown that the azo dyes tested did not inhibit growth and tartrazine had the most effect on growth as it decreased generation time (). Methyl Red had the highest overall kinetic rate of reduction under all conditions, except in the cell extract using NADPH. Azoreductase activity for all three dyes was higher under anaerobic compared with aerobic conditions in BHIS. The reduction kinetics for sulfonated azo dyes, Direct Blue 15, and tartrazine was lowest in PBSG; this may be due to the lack of specific metabolic byproducts that are only produced in BHIS when the cells are actively dividing. Also, the physiological state of the E. faecalis cells in PBSG (lag phase) may prevent the sulfonated azo dyes from entering the cells.
The azoreductase activity of E. faecalis is a complex process and cannot be generalized for all azo dyes. In addition, there maybe multiple enzymes and metabolic byproducts that are involved in this process. Future work will involve the identification of the metabolic by-products produced in BHIS by E. faecalis and any extracellular enzymes that contribute to the azo reduction of sulfonated azo dyes.
Acknowledgements
The authors are grateful to the National Institute of Health (R25 GM069516-01) for financial support and would like to thank Dr Babu Z. Fathepure and Shawn Daley for their assistance with experimental design and manuscript preparation. Declaration of interest: The authors report no conflicts of interest. The authors alone are responsible for the content and writing of the paper.
References
- Hanninen O, Lindstrom-Seppa P, Pelkonen K. Role of gut in xenobiotic metabolism. Arch Toxicol 1987; 60: 34–6
- Mikov M. The metabolism of drugs by the gut flora. Eur J Drug Metab Pharmacokinet 1994; 19: 201–7
- Chen H. Recent advances in azo dye degrading enzyme research. Curr Protein Pept Sci 2006; 7: 101–11
- Chung KT, Stevens SE, Jr, Cerniglia CE. The reduction of azo dyes by the intestinal microflora. Crit Rev Microbiol 1992; 18: 175–90
- Rafii F, Franklin W, Cerniglia CE. Azoreductase activity of anaerobic bacteria isolated from human intestinal microflora. Appl Environ Microbiol 1990; 56: 2146–51
- Stolz A. Basic and applied aspects in the microbial degradation of azo dyes. Appl Microbiol Biotechnol 2001; 56: 69–80
- Chung KT. The significance of azo-reduction in the mutagenesis and carcinogenesis of azo dyes. Mutat Res 1983; 114: 269–81
- McBride, SM, Fischetti, VA, Leblanc, DJ, Moellering, RC, Jr, Gilmore, MS. Genetic diversity among Enterococcus faecalis. PLoS ONE 2007;2:e582.
- Walker R, Gingell R, Murrells DF. Mechanisms of azo reduction by Streptococcus faecalis. I. Optimization of assay conditions. Xenobiotica 1971; 1: 221–9
- Chen H, Wang RF, Cerniglia CE. Molecular cloning, overexpression, purification, and characterization of an aerobic FMN-dependent azoreductase from Enterococcus faecalis. Protein Expr Purif 2004; 34: 302–10
- Liu ZJ, Chen H, Shaw N, Hopper SL, Chen L, Chen S, et al. Crystal structure of an aerobic FMN-dependent azoreductase (AzoA) from Enterococcus faecalis. Arch Biochem Biophys 2007; 463: 68–77
- Cerniglia CE, Freeman JP, Franklin W, Pack LD. Metabolism of azo dyes derived from benzidine, 3,3′-dimethyl-benzidine and 3,3′-dimethoxybenzidine to potentially carcinogenic aromatic amines by intestinal bacteria. Carcinogenesis 1982; 3: 1255–60
- Lowry OH, Rosebrough NJ, Farr AL, Randall RJ. Protein measurement with the Folin phenol reagent. J Biol Chem 1951; 193: 265–75
- Groves WE, Davis FC, Jr, Sells BH. Spectrophotometric determination of microgram quantities of protein without nucleic acid interference. Anal Biochem 1968; 22: 195–210
- Gibson SAW. Human health: the contribution of microorganisms. Springer-Verlag, London 1994
- Walker R, Ryan AJ. Some molecular parameters influencing rate of reduction of azo compounds by intestinal microflora. Xenobiotica 1971; 1: 483–6
- Russ R, Rau J, Stolz A. The function of cytoplasmic flavin reductases in the reduction of azo dyes by bacteria. Appl Environ Microbiol 2000; 66: 1429–34
- Florencio MH, Heerma W. Behaviour of Methyl Red under fast atom bombardment conditions. Organic Mass Spectrometry 1993; 28: 657–64
- Semde R, Pierre D, Geuskens G, Devleeschouwer M, Moes AJ. Study of some important factors involved in azo derivative reduction by Clostridium perfringens. Int J Pharmaceut 1998; 161: 45–54