
Abstract
This study was conducted to investigate the effect and underlying mechanism of endonuclease G (ENDOG) on preeclampsia (PE). Differentially expressed genes in four Gene Expression Omnibus datasets (GSE147776, GSE96984, GSE102897, and GSE65271) were identified using a Venn diagram. Normal and PE placental tissues were collected from normal and PE parturients. The expression of ENDOG in tissues was tested using western blotting, quantitative reverse transcription-polymerase chain reaction, and immunohistochemistry. Cell viability, proliferation, invasion, and migration were detected using Cell Counting Kit-8, 5-ethynyl-2′-deoxyuridine, transwell, and wound healing assays, respectively. Angiogenesis was detected using tube formation and enzyme-linked immunosorbent assays. Kyoto Encyclopedia of Genes and Genomes analysis was performed to analyze the downstream mechanisms of ENDOG in PE. Wnt pathway-related protein levels were detected using western blotting. ENDOG was highly expressed in preeclampsia tissues and HTR-8/SVneo cells. Overexpression of ENDOG inhibited HTR-8/SVneo cell growth, proliferation, invasion, migration, and angiogenesis. Moreover, the levels of angiopoietin-1 and pathway-related proteins were markedly decreased by ENDOG upregulation. Knockdown of ENDOG had the opposite effects, which were counteracted by the inhibitor of Wnt production-2. ENDOG expression was upregulated in preeclampsia and affected HTR-8/SVneo cell proliferation, invasion, migration, apoptosis, and angiogenesis via the Wnt signaling pathway. This provided a novel strategy for the prevention and treatment of PE.
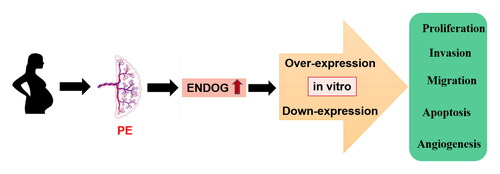
Graphical Abstract
Introduction
Preeclampsia (PE) is a distinctive complication of pregnancy, with an incidence rate of 3%–5% [Citation1]. PE is the second leading cause of maternal mortality worldwide and the primary cause of maternal mortality in developed countries [Citation2,Citation3]. The only effective treatment for PE is to deliver both the placenta and fetus, leading to iatrogenic preterm birth. However, premature delivery increases the risk of fetal complications and long-term complications in the mother [Citation4]. Therefore, it is crucial to explore new methods for preventing and treating PE.
Endonuclease G (ENDOG), an Mg2+-dependent non-specific endonuclease, is a critical factor in the non-caspase-dependent apoptosis pathway. ENDOG is mainly found in the mitochondria [Citation5,Citation6]. Previous reports showed that ENDOG is involved in the caspase-independent death of several somatic cell types [Citation6,Citation7]. Wang et al. demonstrated that ENDOG conservatively promotes autophagy in multiple species [Citation8]. In addition, ENDOG promotes the apoptosis of cancer cells [Citation9–15] and increases the sensitivity of breast and prostate cancer cell lines to chemotherapy drugs [Citation9,Citation10]. Although previous studies demonstrated that ENDOG is involved in the progression and development of cancer, ageing, and heart and neurodegenerative diseases, its role in PE is unclear [Citation16].
The Wnt signaling pathway is an evolutionarily highly conserved signaling pathway with a vital role in various physiological and pathological processes, such as embryonic development, tumorigenesis, and stem cell maintenance [Citation17,Citation18]. β-Catenin is a critical protein involved in this signaling pathway [Citation19]. Wang et al. reported that the Wnt/β-catenin signaling pathway strongly affects PE pathogenesis by regulating trophoblast invasion and proliferation [Citation20]. However, the interplay between ENDOG and Wnt signaling in PE and its regulatory mechanism require further investigation.
In this study, we investigated the expression of ENDOG in patients with PE. We also examined the predominant mechanisms by which ENDOG affects the growth, proliferation, invasion, migration, apoptosis, and angiogenesis of trophoblasts. The above research involves the fetal (not maternal) components susceptible to preeclampsia, which provides a basis for the prevention and treatment of PE.
Materials and methods
To investigate the effect and underlying pathway of ENDOG on PE, differentially expressed genes (DEGs) in four datasets were identified using a Venn diagram. ENDOG mRNA was detected using quantitative reverse transcription polymerase chain reaction (qRT-PCR), and ENDOG protein expression was detected using western blotting and immunohistochemistry. Cell viability, proliferation, invasion, and migration were detected using Cell Counting Kit (CCK)-8, 5-ethynyl-2′-deoxyuridine (EdU), transwell, and wound healing assays, respectively. Angiogenesis was measured using a tube formation assay and an enzyme-linked immunosorbent assay kit. Kyoto Encyclopedia of Genes and Genomes (KEGG) pathway enrichment analysis was performed to evaluate the downstream mechanisms of ENDOG function in PE. Proliferation-, apoptosis-, and angiogenesis-related proteins were analyzed using western blotting.
Bioinformatics analysis
PE datasets (GSE147776, GSE96984, GSE102897, and GSE65271) were obtained from the Gene Expression Omnibus database (https://www.ncbi.nlm.nih.gov/geo/). The DEGs in these datasets were identified using R software and the Limma package [Citation21]. The threshold for DEGs was set as |log2(fold-change)| > 1 and p < 0.05. Overlapping between the different datasets were identified using Venn diagrams. To evaluate the function of ENDOG in PE, KOBAS-KEGG enrichment analysis was performed on the GSE147776 dataset using Gene Set Enrichment Analysis software. Particularly, we used ENDOG as the phenotype and chose the C2 (c2.cp.kegg.v6.1.symbols.gmt) sub-collection downloaded from the Molecular Signatures Database (http://software.broadinstitute.org/gsea/msigdb/index.jsp) as the reference gene set. The threshold for significance was defined as p < 0.05.
Cell culture
HTR-8/SVneo cells (ATCC, Manassas, VA, USA) were cultured in RPMI-1640 medium containing 5% fetal bovine serum, 100 U/mL penicillin, and 100 mg/mL streptomycin and incubated at 37 °C with 5% CO2. The specific inhibitor of Wnt production-2 (IWP-2) (HY-1391, MedChemExpress, USA) was provided and incubated with HTR-8/SVneo cells for 2 h. The culture medium was refreshed for three times each week.
Transfection
The overexpressing plasmids pcDNA3.1-ENDOG and pcDNA3.1-NC were completed by Tsingke Biotechnology Co., Ltd (Beijing, China). Small interfering (si) RNAs specifically targeting ENDOG (si-ENDOG-1 and si-ENDOG-2) and negative controls were synthesized and purified using RiboBio (Guangzhou, China). The cells were transfected with si-ENDOG, pcDNA3.1- ENDOG, or its negative controls (si-control and pcDNA3.1-NC) using Lipofectamine 2000 reagent (Invitrogen, Carlsbad, CA, USA). The transfection efficiency was determined using RT-PCR.
Tissue samples
Normal and PE placental tissues were collected from normal (n = 10) and PE parturients (n = 10) who visited our hospital for treatment, respectively. PE is defined as a systolic blood pressure >140 mmHg or diastolic blood pressure >90 mmHg, combined with urine protein >0.3 g/day after 20 weeks of pregnancy. Informed written consent was obtained from patients, and the study was approved by the Ethics Committee of the Cancer Institute of Shandong Province (No.: 20200216). The clinical characteristics of normal and PE parturients are shown in .
Table 1. Clinical characteristics of Normal group and PE group.
qRT-PCR
Total RNA was isolated by homogenizing the samples with Trizol (Invitrogen). The quality and 28S/18S ratio of the isolated total RNA were determined using a FOTODYNE gel imaging analysis system (Fotodyne, Inc., Hartland, WI, USA). cDNA was synthesized using a cDNA Cycle Kit (Thermo Fisher Scientific, Waltham, MA, USA). The primer sequences used for qPCR amplification were as follows: ENDOG, F: 5′-ATATAGCCGCAGCTTGACCC-3′, R: 5′-CATCAGCCTCTGTCCTGGG-3′; and GAPDH, F: 5′-CATGTTGCAACCGGGAAGGA-3′, R: 5′-GCCCAATACGACCAAATCAGAG-3′. The expression level of GADPH was used to normalize the mRNA expression levels, and the fold-change in ENDOG expression was calculated using the 2–ΔΔCT method.
Western blotting
Total proteins were isolated and quantified using a protein concentration detection kit (Nanjing Jiancheng Bioengineering Institute, Nanjing, China). Samples were separated using 10% sodium dodecyl sulfate-polyacrylamide gel electrophoresis and then transferred onto polyvinylidene fluoride membranes (Millipore, Billerica, MA, USA). Non-specific sites were blocked with 5% milk powder diluted in Tris-buffered saline containing 0.05% Tween 20. The membranes were incubated with the following primary antibodies overnight at 4 °C: rabbit anti-ENDOG (Abcam, Cambridge, UK, ab76122, 1:2000 dilution), rabbit anti-Wnt7B (Abcam, ab227607, 1:1500), rabbit anti-Wnt5B (Abclonal, Wuhan, China, A8313, 1:1500), rabbit anti-C-myc (Abcam, ab32072, 1:1000), rabbit anti-β-catenin (Abcam, ab224803, 1:2000), rabbit anti-E-cadherin antibody (abs120336, 1:500, Absin, Shanghai, China), rabbit anti-N-cadherin antibody (abs131133, 1:500, Absin), rabbit anti-vimentin antibody (abs112750, 1:4000, Absin), rabbit anti-cyclin A antibody (K009488P, 1:300, Solarbio, Beijing, China), rabbit anti-proliferating cell nuclear antigen (PCNA) antibody (abs120180, 1:500, Absin), rabbit anti-cyclin-dependent kinase 1 (CDK1) antibody (abs113546, 1:600, Absin), rabbit anti-TIR-domain-containing adapter-inducing interferon-β (TRIF) antibody (23288-1-AP, 1:500, Proteintech, Rosemont, IL, USA), rabbit anti-Bax antibody (50599-2-Ig, 1:1000, Proteintech), rabbit anti-Bcl-2 antibody (26593-1-activator protein (AP), 1:500, Proteintech), rabbit anti-p53 upregulated modulator of apoptosis (PUMA) antibody (A3752, 1:500, Abclonal), rabbit anti-vascular endothelial growth factor A (VEGFA) antibody (A12303, 1:1000, Abclonal), and rabbit anti- glyceraldehyde-3-phosphate dehydrogenase (GAPDH; ab9485, 1:2500, Abcam). The membranes were incubated in horseradish peroxidase-conjugated goat anti-rabbit immunoglobulin (ab6721, 1:2500, Abcam). The blots were assessed using enhanced chemiluminescence. Relative protein expression levels were normalized to that of GAPDH and quantified with densitometry with Quantity One software (Bio-Rad, Hercules, CA, USA).
Immunohistochemistry
The sections were dewaxed and hydrated using routine methods and blocked with 3% H2O2, followed by blocking with goat serum [Citation22]. Subsequently, rabbit polyclonal ENDOG antibodies (No. 37547, SAB, Nanjing, China) were added, and the sections were incubated overnight at 4 °C. The negative control was incubated in phosphate-buffered saline (PBS) without an antibody. The sections were washed with PBS and incubated with immunoglobulin G secondary antibody conjugated with horseradish peroxidase (1:1000, Zhongshan Jinqiao; Beijing, China) in a wet chamber for 60 min. 3,3′-Diaminobenzidine was used for color development, followed by hematoxylin nucleation, gradient alcohol dehydration, clearing with xylene, and sealing with neutral resin. Micrographs were used to observe the slices at a magnification of ×200.
CCK-8 assay
Log phase cells were seeded into a 96-well plate (1 × 10⁴/well) and incubated at 37 °C with 5% CO2. CCK-8 solution (10 μL) was added to each well and incubated for 1–4 h. The 96-well plate was placed on an enzyme-linked immunoassay instrument, and the absorbance was measured at 450 nm.
EdU assay
Log phase cells were seeded into a 48-well plate (1 × 10⁴/well) and incubated at 37 °C with 5% CO2. After 24 h of culture, 150 μL of EdU medium (50 μmol/L) was added to each well and incubated at 37 °C for 2 h. The cells were washed three times with PBS for 5 min each time. The cells were fixed with paraformaldehyde (4%) for 40 min, followed by incubation with glycine (2 g/L) for 5 min. The cells were washed three times with PBS for 5 min each time. PBS containing Triton X-100 (0.5%) was added once to wash the cells, and the cells were incubated in 200 μL Apollo staining solution in a dark chamber for 30 min. 4′,6-Diamidino-2-phenylindole (1 g/L) was added to the staining solution in the dark for 30 min, and the cells were visualized using an inverted fluorescence microscope and photographed.
Transwell assay
BD Matrigel low-concentration matrix glue was used to assess cell invasion. Diluted matrix glue (30 μL) was applied to each transwell chamber and incubated for 4 h to allow the matrix gel to solidify. Subsequently, 1.3 × 10⁵ cells/mL were inoculated onto a transwell chamber and incubated. After 24 h, the cells were removed from the incubator, stained, and photographed (Carl ZEISS, Jena, Germany).
For the migration assay, logarithmic phase cells were digested and inoculated onto the bottom of the transwell chamber (1 × 10⁵ cells/mL). The cells were cultured for 24–48 h, the transwell chamber was removed, and the cells in the chamber and remaining Matrigel glue were wiped with a cotton swab and washed three times with PBS. After fixation and staining with polyoxymethylene and crystal violet, microscopic observations were performed (Carl ZEISS) for data quantitation.
Wound healing assay
The cells were inoculated onto a 6-well plate (2 × 10⁵/well). After 24 h of incubation, the cell monolayer was scratched with a pipette tip and washed three times with PBS to remove floating cells. The cells were incubated at 37 °C with 5% CO2 in a serum-free medium, the scratch was photographed at 0 and 24 h, and the growth distance was measured.
Tube formation assay
First, melted Matrigel was coated on a pre-cooled 24-well plate on ice (100 μL/well), which was then placed in a 37 °C incubator for 30 min until the Matrigel completely solidified. The cell suspension was added to the Matrigel (1 × 10⁴ cells/well). After fixation with 4% paraformaldehyde for 15 min at 37 °C, the cells were observed using light and fluorescence microscopy, and the images were analyzed to determine the number of tubule branches using ImageJ software (National Institutes of Health, Bethesda, USA).
Measurement of angiopoietin 1
The supernatant of transfected cells was collected, and the concentration of angiopoietin (Ang)-1 was determined using an ELISA kit (USCN Business Co., Ltd., Wuhan, China). The specific concentration of Ang-1 was determined by measuring the optical density value at 450 nm.
Statistical analysis
The results are presented as the mean ± standard deviation. All statistical analyses were performed using the statistical software SPSS 22.0 (SPSS, Inc., Chicago, IL, USA). Comparisons were performed using Student’s t test to analyze differences in normally distributed data between two groups, and Mann–Whitney U-test was performed to analyze the difference between the two groups (n = 3 per group). p < 0.05 was considered to indicate statistically significant results. Each experiment was repeated three times.
Results
ENDOG was highly expressed in PE tissues
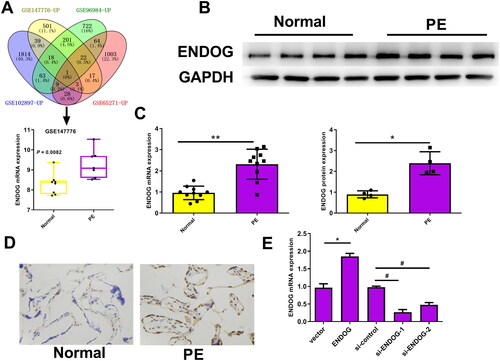
Four datasets were retrieved from Gene Expression Omnibus (GSE147776, GSE96984, GSE102897, and GSE65271). The expression of ENDOG in each chip is shown in Supplementary Figure S1. The Venn diagram results showed that ENDOG was differentially expressed in PE. In GSE147776, ENDOG expression was significantly higher in the PE group than in the normal group (p = 0.0082, ). The western blotting, qRT-PCR, and immunohistochemistry results indicated that the ENDOG protein level in patients with PE was markedly higher than in the normal group (p < 0.01, ). qRT-PCR was used to detect the transfection efficiency. The expression of ENDOG mRNA was significantly higher in the ENDOG group than in the vector group. In addition, compared to that in the si-control group, ENDOG mRNA levels were significantly decreased in the si-ENDOG-1 and si-ENDOG-2 groups. The ENDOG mRNA level was remarkably reduced, particularly in the si-ENDOG-1 group (p < 0.01, ). Therefore, we selected HTR-8/SVneo cells transfected with si-ENDOG-1 for subsequent experiments. Collectively, ENDOG was highly expressed in PE, and transfection was successful.
Figure 1. Endonuclease G (ENDOG) was highly expressed in preeclampsia (PE) tissues and cells. A: ENDOG was differentially expressed according to Venn diagram analysis in PE- and hypoxia-related datasets. In GSE147776, the expression of ENDOG in the PE group (n = 7) was significantly higher than that in the normal group (n = 8). B–D: ENDOG was highly expressed in placental tissues collected from patients with PE, as demonstrated by the results of western blotting, qRT-PCR, and immunohistochemistry. E: Transfection efficiency was determined using qRT-PCR. **p < 0.01 compared to the normal and vector groups; ##p < 0.01 compared to the si-control group.
ENDOG regulated HTR-8/SVneo cell activity and proliferation
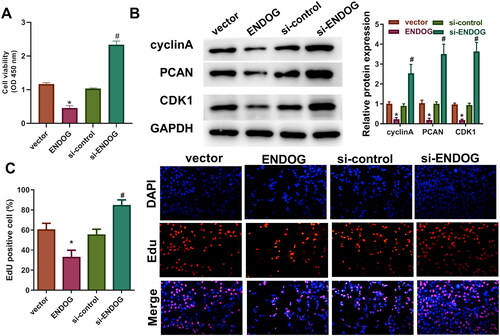
The CCK-8 assay results demonstrated that cell activity in the ENDOG group was markedly reduced compared to that in the vector group; however, cell activity in the si-ENDOG group was significantly increased compared to that in the si-control group (p < 0.01, ). The results of EdU staining showed that the number of EdU-positive cells in the ENDOG group was significantly lower than that in the vector group. The levels of cyclin A, PCNA, and CDK1 were significantly decreased compared to those in the vector group, and the levels of cyclin A, PCNA, and CDK1 were higher in the si-ENDOG group than those in the si-control group (). Furthermore, the number of EdU-positive cells in the si-ENDOG group was markedly larger than that in the si-control group (p < 0.01, ). Taken together, these results indicate that overexpression of ENDOG inhibited cell viability and proliferation, whereas knockdown of ENDOG promoted cell viability and proliferation.
Figure 2. Endonuclease G (ENDOG) regulated HTR-8/SVneo cell activity and proliferation. A: Cell viability was determined using the CCK-8 assay. B: Cyclin A, PCNA, and CDK1 protein levels were determined using western blotting. C: Cell proliferation was determined using the EdU assay. **p < 0.01 indicates a significant difference compared to the vector group; ##p < 0.01 indicates a significant difference compared to the si-control group.
ENDOG regulated HTR-8/SVneo cell invasion and migration
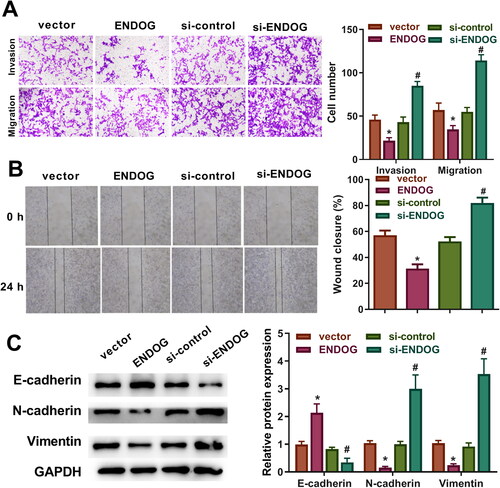
The transwell assay results demonstrated that compared to those in the vector group, the migration and invasion of cells were decreased in the ENDOG group. However, the migration and invasion of cells in the si-ENDOG group were increased compared to those in the si-control group (p < 0.01, ). The wound healing assay results revealed a significantly slower wound closure rate in the ENDOG group than that in the vector group, whereas the wound closure rate in the si-ENDOG group was markedly faster than that in the si-control group (p < 0.01, ). In addition, in the ENDOG group, E-cadherin expression was upregulated, and N-cadherin and vimentin expression was downregulated compared to those in the vector group. However, E-cadherin expression decreased, and the levels of N-cadherin and vimentin increased in the si-ENDOG group compared to those in the si-control group (). These results indicate that overexpression of ENDOG inhibited cell migration and invasion, and silencing of ENDOG promoted cell migration and invasion.
Figure 3. Endonuclease G (ENDOG) regulated HTR-8/SVneo cell invasion and migration. A: Cell invasion and migration were detected using a transwell assay. B: Cell migration was determined using a wound healing assay. C: E-cadherin, N-cadherin, and vimentin levels were determined using western blotting. **p < 0.01 indicates a significant difference compared to the vector group; ##p < 0.01 indicates a significant difference compared to the si-control group.
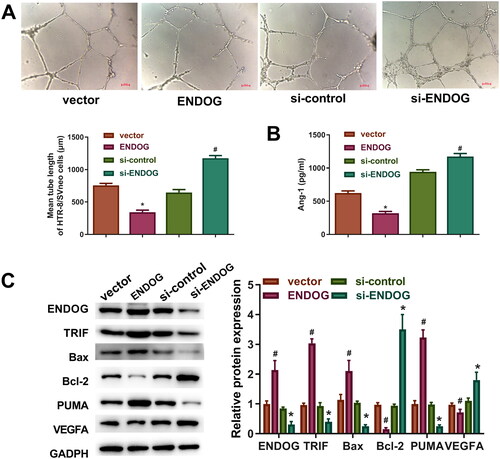
ENDOG regulated angiogenesis and apoptosis in HTR-8/SVneo cells
As indicated in , overexpression of ENDOG inhibited cell tube formation and decreased the level of Ang-1 compared to those in the vector group, whereas knockdown of ENDOG promoted cell tube formation and increased the level of Ang-1 compared to those in the si-control group. Furthermore, compared to those in the vector group, overexpression of ENDOG increased the levels of PUMA, Bax, and TRIF and decreased the levels of VEGFA and Bcl-2. In addition, compared to those in the si-control group, the knockdown of ENDOG decreased the levels of PUMA, Bax, and TRIF and increased the levels of VEGFA and Bcl-2 (). Collectively, these data indicate that ENDOG regulated angiogenesis and apoptosis in trophoblasts.
Figure 4. Endonuclease G (ENDOG) regulated angiogenesis in HTR8/SVneo cells. A: Tube formation was determined using the tube formation assay. B: ELISA was performed to determine the concentration of angiotensin (Ang)-1. C: VEGFA, PUMA, Bcl-2, Bax, TRIF, and ENDOG levels were determined using western blotting. **p < 0.01 compared to the vector group; #p < 0.05 compared to the si-control group.
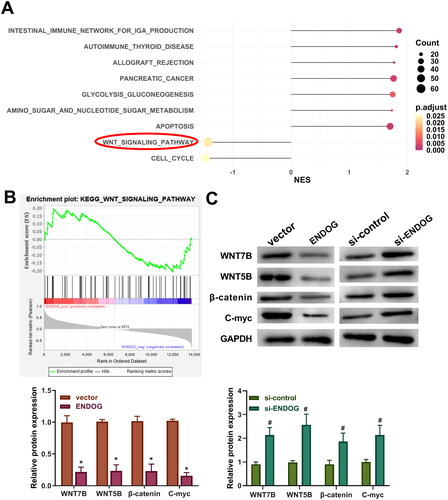
ENDOG regulated the Wnt signaling pathway in HTR-8/SVneo cells
KEGG pathway enrichment analysis showed that the Wnt signaling pathway was markedly enriched in PE (). Western blotting was performed to measure the levels of Wnt signaling pathway-related proteins. The levels of Wnt7B, Wnt5B, β-catenin, and C-myc in the ENDOG group were markedly lower than those in the vector group (p < 0.01, ). However, compared to those in the si-control group, the levels of Wnt3a, β-catenin, C-myc, and cyclin D1 were significantly increased in the si-ENDOG group (p < 0.01, ). These results indicate that ENDOG regulated the Wnt signaling pathway in HTR-8/SVneo cells.
Figure 5. Endonuclease G (ENDOG) regulated the Wnt signaling pathway in HTR-8/SVneo cells. A and B: KEGG pathways enriched with differentially expressed genes (DEGs). C: Western blotting was used to determine the levels of Wnt7B, Wnt5B, β-catenin, and C-myc. **p < 0.01 compared to the vector group; ##p < 0.01 compared to the si-control group.
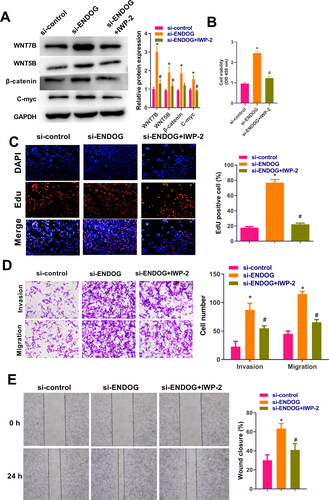
ENDOG regulated HTR-8/SVneo cells by inhibiting the Wnt signaling pathway
The cells were treated with the inhibitor of IWP-2 to verify the mechanism of action of ENDOG in HTR-8/SVneo cells. The western blotting results demonstrated that after the knockdown of ENDOG, the levels of Wnt3a, β-catenin, C-myc, and cyclin D1 were increased significantly. In the si-ENDOG-IWP-2 group, Wnt3a, β-catenin, C-myc, and cyclin D1 levels were significantly lower than those in the si-ENDOG group (p < 0.01, ). The CCK-8 assay results suggested that the viability of cells in the si-ENDOG group was significantly increased compared to those in the si-control group and significantly decreased in cells in the si-ENDOG-IWP-2 group compared to those in the si-ENDOG group (p < 0.01, ). Furthermore, in the si-ENDOG group, cell proliferation, invasion, and migration and the wound closure rate were significantly increased compared to those in the si-control group. In contrast, in the si-ENDOG-IWP-2 group, cell proliferation, invasion, and migration and the wound closure rate were significantly decreased compared to those in the si-ENDOG group (p < 0.01, ). These data suggest that silencing of ENDOG regulated PE by activating the Wnt signaling pathway.
Figure 6. Endonuclease G (ENDOG) regulated HTR-8/SVneo cell activity, proliferation, invasion, and migration via activation of the Wnt signaling pathway. A: Western blotting was used to determine the levels of Wnt7B, Wnt5B, β-catenin, and C-myc. B: Cell viability was measured using the CCK-8 assay. C: Cell proliferation was measured using the EdU assay. D: Cell viability, invasion, and migration were measured using the transwell assay. E: Cell migration was measured using the wound healing assay. **p < 0.01 compared to the si-control group; ##p < 0.01 compared to the si-ENDOG group.
Discussion
PE is the primary and direct cause of maternal and neonatal morbidity and death [Citation23,Citation24]. In this research, we found that ENDOG was highly expressed in placenta tissues collected from patients with PE. The in vitro study further demonstrated that overexpression of ENDOG inhibited the viability, proliferation, invasion, migration, and angiogenesis and induced the apoptosis of HTR-8/SVneo cells. Silencing of ENDOG had the opposite effect. Following experiments testified that ENDOG promoted the progression of PE by inhibiting the Wnt signaling pathway.
Many studies have shown that the mitochondrial function of placenta in patients with PE in early and late pregnancy will be seriously damaged [Citation25]. Soleymanlou et al. found that the increased expression of apoptotic Mtd-L and Mtd-P (members of the Bcl-2 family, located in the outer membrane of mitochondria) would lead to increased trophoblast cell death in the placenta of patients with severe PE [Citation26]. Zhou et al. found that compared with normal placenta, the expression of mitochondrial fusion protein 1 (MFN1), MFN2, and optic atrophy 1 (OPA1) in sPE placenta was downregulated. In addition, the study also found that the expression of SIRT3 (protein involved in mitochondrial biogenesis) decreased in PE, which may lead to decreased mitochondrial biogenesis and impaired lipid metabolism [Citation27]. ENDOG, an endonuclease involved in DNA breakage during apoptosis, is a mitochondrial cell death effector that may act as a cell death nuclease. Alexei et al. [Citation9] demonstrated that ENDOG can promote the death of non-invasive human breast cancer cells, and Lemarié et al. [Citation28] reported that the Hep3B cell line expresses ENDOG that exerts cell death activity. Zhang et al. showed that translocated ENDOG is involved in delayed neuronal death of stroke [Citation29]. However, the role of ENDOG in the occurrence and development of PE remains unclear. Our results indicate that overexpression of ENDOG inhibited cell proliferation, invasion, and migration and increased cell apoptosis, whereas knockdown of ENDOG had the opposite effects. The role of ENGOD in the angiogenesis of trophoblast cells has not been reported. We observed that upregulation of ENDOG expression inhibited cell angiogenesis, whereas downregulation of ENDOG expression increased angiogenesis. Based on these results, ENDOG knockdown may suppress PE progression by modulating specific translation processes.
The Wnt signaling pathway was enriched in PE. Wnt is a critical signaling pathway that regulates apoptosis, invasion, and oxidative stress in cells [Citation30]. Wnt activation can inhibit the degradation of the downstream molecule β-catenin, leading to its accumulation in cells. Continuous accumulation of β-catenin results in increased translocation into the nucleus, where it regulates the expression of a variety of genes [Citation31]. Numerous studies demonstrated that the Wnt/β-catenin signaling pathway is critical in the regulation of PE [Citation32,Citation33]. Our results indicate that upregulation of ENDOG expression inhibited the Wnt pathway, whereas downregulation activated this pathway, suggesting that ENDOG regulates PE via the Wnt signalling pathway. We verified the regulatory effect of ENDOG on the Wnt signaling pathway using Wnt inhibitors. Our results showed that silencing ENDOG promoted the proliferation, migration, and invasion of trophoblast cells by activating the Wnt pathway in PE.
At present, this study has only carried out cell experiments in vitro. In future studies, we will expand the number of clinical samples collected and establish animal models to examine the impact of ENDOG on PE in vivo to overcome for limited sample size in this study. In addition, intrauterine hypoxia is also one of the common complications of PE. The results of bioinformatics analysis also showed that the expression of ENDOG in hypoxic environment was also significantly increased. Therefore, we will establish a hypoxia induction model to study the mechanism of ENDOG in hypoxia environment in order to further explore the pathogenesis of PE.
Conclusion
ENDOG is overexpressed in PE, and knockdown of ENDOG regulated trophoblast cell proliferation, invasion, migration, apoptosis, and angiogenesis. ENDOG may play a vital regulatory role in PE through its effects on the Wnt pathway.
Supplemental Material
Download MS Word (87.3 KB)Acknowledgments
None.
Disclosure statement
Jing Yang declares that he/she has no conflict of interest; Xuejun Kou declares that he/she has no conflict of interest.
Data availability statement
The datasets used and analyzed during the current study are available from the corresponding author on reasonable request.
Additional information
Funding
References
- Heydarlou H, Eghabl-Fard S, Ahmadi M, et al. Investigation of follicular helper T cells, as a novel player, in preeclampsia. J Cell Biochem. 2019;120(3):1–11.
- von Dadelszen P, Magee LA. Pre-eclampsia: an update. Curr Hypertens Rep. 2014;16(8):454.
- Say L, Chou D, Gemmill A, et al. Global causes of maternal death: a WHO systematic analysis. Lancet Global Health. 2014;2(6):e323–e33.
- Backes CH, Markham K, Moorehead P, et al. Maternal preeclampsia and neonatal outcomes. J Pregnancy. 2011;2011:214365.
- Côté J, Ruiz-Carrillo A. Primers for mitochondrial DNA replication generated by endonuclease G. Science. 1993;261(5122):765–769.
- Ohsato T, Ishihara N, Muta T, et al. Mammalian mitochondrial endonuclease G. Digestion of R-loops and localization in intermembrane space. Eur J Biochem. 2002;269(23):5765–5770.
- Li LY, Luo X, Wang X. Endonuclease G is an apoptotic DNase when released from mitochondria. Nature. 2001;412(6842):95–99.
- Wang W, Li J, Tan J, et al. Endonuclease G promotes autophagy by suppressing mTOR signaling and activating the DNA damage response. Nat Commun. 2021;12(1):476.
- Basnakian AG, Apostolov EO, Yin X, et al. Endonuclease G promotes cell death of non-invasive human breast cancer cells. Exp Cell Res. 2006;312(20):4139–4149.
- Wang X, Tryndyak V, Apostolov EO, et al. Sensitivity of human prostate cancer cells to chemotherapeutic drugs depends on EndoG expression regulated by promoter methylation. Cancer Lett. 2008;270(1):132–143.
- Zhdanov DD, Pokrovsky VS, Orlova EV, et al. Intracellular localization of apoptotic endonuclease EndoG and splice-variants of telomerase catalytic subunit hTERT. Biochemistry (Mosc). 2017;82(8):894–905.
- Bemani P, Mohammadi M, Hakakian A. Anti-ROR1 scFv-EndoG as a novel anti-Cancer therapeutic drug. Cell Death Dis. 2018;19(1):97–102.
- Barés G, Beà A, Hernández L. ENDOG impacts on tumor cell proliferation and tumor prognosis in the context of PI3K/PTEN pathway status. Nat Commun. 2021;13(15):3803.
- Torres-Montaner A. The telomere complex and the origin of the cancer stem cell. Biomarker Res. 2021;9(1):81.
- Zhang H, Wang M, He Y, et al. Chemotoxicity-induced exosomal lncFERO regulates ferroptosis and stemness in gastric cancer stem cells. Cell Death Dis. 2021;12(12):1116.
- Zhou Q, Li H, Li H, et al. Mitochondrial endonuclease G mediates breakdown of paternal mitochondria upon fertilization. Science. 2016;353(6297):394–399.
- Shang S, Hua F, Hu ZW. The regulation of beta-catenin activity and function in cancer: therapeutic opportunities. Oncotarget. 2017;8(20):33972–33989.
- Becker J, Wilting J. WNT signaling in neuroblastoma. Cancers. 2019;11(7):1013.
- MacDonald BT, Tamai K, He X. Wnt/beta-catenin signaling: components, mechanisms, and diseases. Dev Cell. 2009;17(1):9–26.
- Wang X, Zhang Z, Zeng X, et al. Wnt/beta-catenin signaling pathway in severe preeclampsia. J Mol Histol. 2018;49(3):317–327.
- Ritchie ME, Phipson B, Wu D, et al. Limma powers differential expression analyses for RNA-sequencing and microarray studies. Nucleic Acids Res. 2015;43(7):e47.
- Zhang Z, Chen X, Gao B, et al. PLD1 knockdown reduces metastasis and inflammation of fibroblast-like synoviocytes in rheumatoid arthritis by modulating NF-κB and wnt/β-catenin pathways. Autoimmunity. 2021;54(7):398–405.
- Gerasimova EM, Fedotov SA, Kachkin DV, et al. Protein misfolding during pregnancy: new approaches to preeclampsia diagnostics. Int J Mol Sci. 2019;20(24):6183.
- Hu X, Xia W. Circ_0005714/miR-223-3p/ADAM9 regulatory axis affects proliferation, migration, invasion, and angiopoiesis in trophoblast cells. Autoimmunity. 2022;55(8):640–649.
- Vaka R, Deer E, Cunningham M, et al. Characterization of mitochondrial bioenergetics in preeclampsia. J Clin Med. 2021;10(21):5063.
- Soleymanlou N, Jurisicova A, Wu Y, et al. Hypoxic switch in mitochondrial myeloid cell leukemia factor-1/mtd apoptotic rheostat contributes to human trophoblast cell death in preeclampsia. Am J Pathol. 2007;171(2):496–506.
- LaMarca B, Zhou X, Han TL, et al. Impaired mitochondrial fusion, autophagy, biogenesis and dysregulated lipid metabolism is associated with preeclampsia. J Clin Med. 2017;359(1):195–204.
- Lemarié A, Lagadic-Gossmann D, Morzadec C, et al. Cadmium induces caspase-independent apoptosis in liver Hep3B cells: role for calcium in signaling oxidative stress-related impairment of mitochondria and relocation of endonuclease G and apoptosis-inducing factor. Free Radic Biol Med. 2004;36(12):1517–1531.
- Zhang Z, Yang X, Zhang S, et al. BNIP3 upregulation and EndoG translocation in delayed neuronal death in stroke and in hypoxia. Stroke. 2007;38(5):1606–1613.
- Vallee A, Lecarpentier Y. Crosstalk between peroxisome Proliferator-Activated receptor gamma and the canonical WNT/beta-Catenin pathway in chronic inflammation and oxidative stress during carcinogenesis. Front Immunol. 2018;9:745.
- Rennoll S, Yochum G. Regulation of MYC gene expression by aberrant wnt/beta-catenin signaling in colorectal cancer. World J Biol Chem. 2015;6(4):290–300.
- Zhang Z, Wang X, Zhang L, et al. Wnt/beta-catenin signaling pathway in trophoblasts and abnormal activation in preeclampsia (review). Mol Med Rep. 2017;16(2):1007–1013.
- Schlosser K, Kaur A, Dayan N, et al. Circulating miR-206 and wnt-signaling are associated with cardiovascular complications and a history of preeclampsia in women. Clin Sci. 2020;134(2):87–101.