
Abstract
The factors regulating the heterogeneity of interleukin-17A (IL-17A)-expressing CD4+ T cells in inflammatory bowel diseases remain unclear. In the current study, we characterised the expression and function of zinc finger protein 189 (ZFP189) in a murine colitis model. Mice were given dextran sulphate sodium to induce acute colitis. Flow cytometry was applied to recognise and enrich Th17 and Th17.1 cells based on the expression of IL-17A, interferon-γ (IFN-γ), C-X-C motif chemokine receptor 3 (CXCR3), and C-C motif chemokine receptor 4 (CCR4). The expression of ZFP189 in Th17 and Th17.1 cells was determined by Immunoblotting. Lentivirus-mediated ZFP189 knockdown was conducted to evaluate the effect of ZFP189 on the differentiation of Th17 and Th17.1 cells. The adoptive transfer was performed to analyse the pathogenicity of Th17.1 cells in vivo. We found that ZFP189 was mildly up-regulated in IL-17A-expressing CD4+ T cells in colonic lamina propria. Lamina propria Th17.1 cells expressed higher ZFP189 than Th17 cells. In vitro ZFP189 knockdown in CD4+ T cells did not impact Th17 cell differentiation but suppressed Th17.1 cell differentiation, as evidenced by lower T-box expressed in T cells (T-bet) and IFN-γ. When adoptively transferred into mice, ZFP189-deficient Th17.1 cells produced fewer IFN-γ, tumour necrosis factor-alpha (TNF-α), and granulocyte-macrophage colony-stimulating factor (GM-CSF) than ZFP189-expressing Th17.1 cells. Moreover, ZFP189-deficient Th17.1 cells induced less severe colitis than ZFP189-expressing Th17.1 cells, as evidenced by less body weight loss, a lower disease activity index, and a lower colon histological score. In summary, ZFP189 acts as a positive regulator of the differentiation and pathogenicity of lamina propria Th17.1 cells in colitis.
Introduction
Inflammatory bowel diseases (IBDs) feature continuous inflammatory reactions in the gastrointestinal tract [Citation1,Citation2]. Multiple inflammatory cells actively participate in the inflammatory network in the bowel [Citation3–5]. T cells, especially CD4+ T helper cells, are significant players in the start, progression, remission, and recurrence of IBDs, because they express various inflammation-related agents and autoimmune mediators [Citation4]. Upon receiving the instructions from antigen-presenting cells and tissue immune factors, distinct intracellular signalling pathways instruct naïve CD4+ T cells to polarise towards different effector cells, such as T helper 1 (Th1), T helper 2 (Th2), T helper 9 (Th9), T helper 17 cells (Th17), and induced regulatory T cells (iTregs). In particular, Th17 cells are crucial for the pathogenesis of IBDs because they produce pro-inflammatory cytokines including IL-17A, IL-21, and IL-22 [Citation6,Citation7]. Traditional Th17 cells are defined as CD4+ IL-17A-producing T cells [Citation8]. However, accumulative evidence indicates that CD4+ IL-17A-producing T cells exhibit remarkable heterogeneity and plasticity, meaning that they comprise subsets with distinct phenotypes and functional properties [Citation9–11]. It has been reported that Th17.1 cells (Also termed Th1-like Th17 or Th17/Th1 cells), which are characteristic of both Th17 cells and Th1 cells, are deeply involved in various inflammatory disorders including IBDs [Citation12–15]. Compared with Th17 cells expressing high IL-17A and C-C motif chemokine receptor 4 (CCR4), Th17.1 cells express IL-17A, IFN-γ, and C-X-C motif chemokine receptor 3 (CXCR3) [Citation12,Citation13]. Th17.1 cells are more pathogenic than Th17 cells in inducing intestinal inflammation [Citation14]. Both Th17 cells and Th17.1 cells express C-C Motif chemokine receptor 6 (CCR6) [Citation16,Citation17]. Therefore, the chemokine receptors CCR6, CCR4, and CXCR3 could be markers of Th17 cells and Th17.1 cells, respectively. The molecular mechanisms governing the inflammatory activity of Th17.1 cells have not been completely revealed.
Kruppel-like zinc finger proteins are a group of zinc finger DNA-binding transcription factors involved in transcriptional regulation [Citation18]. As a member of Kruppel-like zinc finger proteins, zinc finger protein 189 (termed ZFP189 in mice and ZNF189 in humans) possesses a conserved domain of 7 amino acids that links a series of DNA-binding zinc finger repeats of the cys(2)his(2) type [Citation19]. Therefore, ZFP189 is supposed to function as a transcription factor. Its mutations make it a candidate gene for sporadic basal cell cancer and squamous cell cancer [Citation20]. The expression of ZFP189 is correlated to the dynamic positron emission tomography data in gastrointestinal stromal tumours [Citation21]. Single nucleotide polymorphism analysis suggests that ZFP189 influences the risk of facial clefts [Citation22]. ZFP189 overexpression in prefrontal cortical neurons activates the gene network that is unique to resilience in mice [Citation23]. cAMP response element-binding protein (CREB) is predicted to be its upstream regulator that binds to the Zfp189 gene promoter [Citation24]. However, the exact roles of ZFP189 in immune cell function have not been revealed, regardless of its ubiquitous expression in the spleen and thymus [Citation18]. In mice, the Zfp189 gene has two transcript variants with the same coding domains, thus ultimately encoding the same protein, according to the NCBI gene database. Mouse inflammatory colitis models can deepen the understanding of the physiopathology of human IBDs and help develop efficacious therapeutic strategies against IBDs.
Here we report that ZFP189 is up-regulated in Th17.1 cells but not Th17 cells in colonic lamina propria (LP) in a murine acute colitis model. Interestingly, ZFP189 did not influence Th17 cell differentiation but boosted Th17.1 cell generation both in vitro and in vivo, probably by promoting T-bet expression in Th17.1 cells. Therefore, we disclosed a novel mechanism by which Th17.1 cells are modulated in colitis.
Materials and methods
Mice
This study was approved by the Wuhan No.4 Hospital Animal Care and Use Committee and complied with the Wuhan No.4 Hospital Animal Use Guidelines. Eight-week-old male IL-17A-EGFP transgenic mice (C57BL/6-Il17attm1/Bcgen) and wild-type C57BL/6J mice were purchased from Beijing Biocytogen Co., Ltd. This strain co-expresses IL-17A and EGFP. Eight-week-old male Rag1 knockout mice (C57BL/6J-Rag1em1Cya, C57BL/6J background) were obtained from Cyagen Bioscience. All animals were housed under the standard pathogen-free condition. A total of 111 mice were included in this project. The minimum animal number necessary for attaining statistical significance of p < 0.05 with an 80% probability was determined by the Sample Size & Power Calculator, an open sample size tool provided by the U.S. Department of Agriculture (www.aphis.usda.gov/aphis/ourfocus/animalhealth/ceah-toolbox/animal-sample-size-calculator), according to the data of preliminary experiments.
Colitis model
Dextran sulphate sodium (DSS, Sigma-Aldrich) was dissolved in sterile distilled water at a final concentration of 3%. To induce colitis, B-IL17-EGFP transgenic mice were fed with 3% DSS-containing water for 7 days and the DSS-containing water was changed every 2 days.
Cell enrichment from mesenteric lymph nodes (mLNs) and LP
Mice were euthanized by CO2 and mLNs and colons were harvested. mLNs were immersed in 1 ml of ice-cold PBS and passed through a 40-µm cell strainer to prepare single cells. The colon was cut into small pieces and incubated in RPMI1640 containing 10% foetal calf serum (FCS), 2 mg/ml Collagenase type IV, 400 U/ml DNase I, 2 mM ethylenediaminetetraacetic acid (EDTA), and 2.5 mM 4-(2-hydroxyethyl)-1-piperazineethanesulfonic acid (HEPES) in a 37 °C water bath for 30 min with frequent shaking. All reagents were purchased from Sigma-Aldrich. After treatment, the colon tissues were gently pressed through a 40-µm cell strainer to prepare single cells. Erythrocytes were lysed by incubating cells in the RBC lysis buffer (Beyotime Biotech) at 37 °C for 3 min.
Flow cytometry
The antibody information is provided in Supplementary Table S1. To stain cell surface proteins, cells were incubated with indicated antibody (5 µg/ml each) for 30 min on ice in the dark. To stain intracellular proteins such as cytosolic proteins and nuclear factors, cells were incubated in 3% paraformaldehyde on ice for 20 min and then permeabilized in 90% methanol-PBS on ice for 45 min. After washing with PBS, cells were stained with the antibodies against intracellular proteins at room temperature for 1 h. Cells were loaded on an LSRII flow cytometer (BD biosciences) for analysis or a FACSAria cell sorter (BD Biosciences) for cell sorting.
Quantitative polymerase chain reaction (q-PCR)
RNAs were prepared using the RNAprep pure micro kit (Tiangen Biotech) following the vendor’s instructions. cDNAs were prepared using the protoscript II first strand cDNA synthesis kit (NEB). The powertrack SYBR green master mix (Thermo Fisher Scientific) was used for quantitative PCR on the 7500 fast real-time PCR system (Applied Biosystems™). The mRNA levels of target genes were normalised to β-actin using the 2-ΔΔCt calculation. Primers are listed in Supplementary Table S2.
Immunoblotting
Proteins were extracted by lysing cells in RIPA buffer containing protease inhibitors (Thermo Fisher Scientific) on ice for half an hour. The polyclonal rabbit anti-ZFP189 antibody was purchased from Millipore Sigma (1:300, catalog # ABE2917). The monoclonal rabbit anti-GAPDH antibody was purchased from Abcam (1:2000, catalog # ab181602). The secondary antibody was HRP-conjugated goat anti-rabbit IgG H&L (Abcam, 1:2000, catalog # ab6721).
Lentivirus
The mouse Zfp189 siRNA lentivector (Catalog # 508690940495) and the control vector encoding a scrambled siRNA were purchased from Abm Inc. Lentivirus packaging, concentration, and quantification were accomplished by Cloud-Clone Co., Ltd (Wuhan, China).
T cell differentiation and Lentivirus transduction
CD4+ T cells were enriched from the spleens of healthy wild-type C57BL/6J mice using the ImmunoSep mouse CD4 T cell enrichment kit (Precision Biomedical) based on the supplier’s instructions. To induce Th17 differentiation, 1 × 10⁵ CD4+ T cells were placed in each well of a 96-well microplate and stimulated with 5 µg/ml coated CD3ε antibody (145-2C11), 2 µg/ml soluble CD28 antibody (37.51), 20 ng/ml recombinant IL-6 (575704), 1 ng/ml recombinant TGF-β (781802), 20 ng/ml recombinant IL-23 (589002), 10 µg/ml IL-4 antibody (504122), and 10 µg/ml IFN-γ antibody (505834). The above reagents were obtained from BioLegend. Two days after stimulation, polybrene (Sigma-Aldrich) was added into the culture at a final concentration of 5 µg/ml and the lentivirus was added at a multiplicity of infection (MOI) of 10 to incubated cells overnight. The next morning the supernatant was replaced with the fresh culture medium containing the same stimuli and antibodies. On day 6 after stimulation, GFP expression in cells was evaluated by flow cytometer to determine transduction efficiency. In vitro Th17.1 induction was performed according to previous reports [Citation14,Citation25]. Briefly, CD4+ T cells were stimulated in almost the same manner as stated above. However, the IFN-γ antibody was absent while recombinant IL-12 (419-ML-010/CF, R&D Systems) was added at 10 ng/ml and recombinant IFN-γ (Catalog # 485-MI-100/CF, R&D Systems) was added at 10 ng/ml. Lentivirus transduction was performed the same way as for Th17 cells.
To detect intracellular cytokines in differentiated T cells, stimulated T cells were incubated with 20 ng/ml phorbol 12-myristate 13-acetate (PMA, Sigma-Aldrich), 1 μg/ml ionomycin (Sigma-Aldrich), and 10 μg/ml brefeldin A (Sigma-Aldrich) in the last four hours of culture. After that, intracellular cytokine staining was conducted for flow cytometry.
Adoptive transfer
Splenic CD4+ T cells were cultured under the Th17.1 induction condition and infected with lentiviruses as described above. Rag1 knockout (Rag1-/-) mice were fed with 2% DSS for three consecutive days. After that, 200 μl of PBS containing 2 × 10⁶ in vitro-generated Th17.1 cells were intra-peritoneally injected into each Rag1-/- mouse each day for three consecutive days, and the mice were fed with regular water. A disease activity index (DAI) score which was composed of body weight change, stool consistency, and presence of faecal occult blood (Supplementary Table S3) was measured every two days. An occult blood single slide kit (ThermoFisher) was used to determine the presence of occult blood. On day 14 after initial DSS treatment, the recipients were euthanized. The colon length and weight were recorded, followed by histological evaluation and LP cell enrichment.
Haematoxylin and eosin staining
Five-micron thick colon paraffin sections were prepared, followed by the standard haematoxylin and eosin staining procedures. Colitis was graded on a four-point scale: 0: no inflammation; 1: slight inflammation; 2: mild or moderate immune cell infiltration; 3: profound immune cell aggregation, increased vascularity, and colon wall thickening; 4: severe goblet cell reduction, colon wall thickening, and transmural infiltration.
Statistical analysis
Data are presented as mean values ± standard deviations. Each experiment was independently repeated 2 or 3 times. The unpaired two-tailed Student’s t-test or one-way ANOVA with Tukey’s test was applied for statistical analysis. A P value < 0.05 is regarded statistically significant.
Results
ZFP189 expression in LP IL-17A-Expressing CD4+ T cells in DSS-Induced colitis
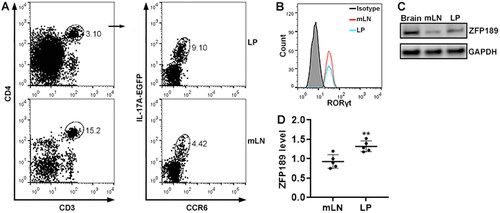
IL-17A-EGFP transgenic mice were fed with DSS-containing water to induce acute colitis (). To determine ZFP189 expression in IL-17A-expressing CD4+ T cells, we isolated immune cells from mouse mLNs and LP after colitis induction and conducted flow cytometry to find IL-17A-expressing CD4+ T cells. As shown in , single cells were gated according to the forward scatter A and forward scatter H. CD3+CD4+ T cells were then recognised among single cells. IL-17A+CCR6+ T cells were found in CD3+CD4+ T cells isolated from the LP and mLNs, respectively. These IL-17A+CCR6+ T cells expressed RAR-related orphan receptor gamma t (RORγt) (). ZFP189 protein was expressed at a low level in mLN IL-17A+CCR6+ T cells and was moderately up-regulated in LP IL-17A+CCR6+ T cells ().
Figure 1. ZFP189 expression in IL-17A-expressing T cells after colitis induction. (A) Flow cytometry gating strategy for IL-17A-expressing T cells in the colitis model. mLN: mesenteric lymph nodes. LP: lamina propria. (B) Flow cytometry histograms showing RORγt protein in IL-17A-expressing T cells sorted from mLNs and LP. Isotype: isotype control. The data represent two independent experiments. (C) ZFP189 protein in sorted IL-17A-expressing CD4+ T cells. Brain: mouse brain tissue lysate as a positive control. (D) Relative ZFP189 protein levels. N = 5 data points per group in (D). Each data point represents cells pooled from 5 mice. **: p < 0.01.
Identification of Th17 cells and Th17.1 cells in mLNs and LP
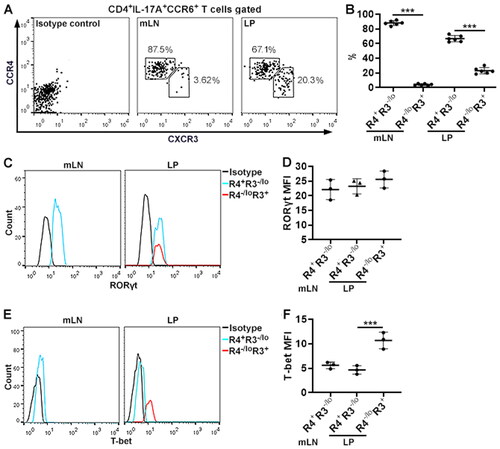
We aimed to characterise ZFP189 expression in pathogenic Th17 and Th17.1 cells. To this end, we first identified Th17 and Th17.1 cells in CD4+IL-17A+CCR6+ T cells based on the expression of CXCR3 and CCR4. As shown in , in the mLNs, about 90% of CD4+IL-17A+CCR6+ T cells were CCR4+CXCR3-/lo and less than 5% were CCR4-/loCXCR3+. In the LP, 70% of CD3+IL-17A+CCR6+ T cells were CCR4+CXCR3-/lo while 25% were CCR4-/loCXCR3+. RORγt protein expression was equivalent in the mLN CCR4+CXCR3-/lo subset, the LP CCR4+CXCR3-/lo subset, and the LP CCR4-/loCXCR3+ subset (). RORc mRNA expression was equivalent in the mLN CCR4+CXCR3-/lo subset and CCR4-/loCXCR3+ subset (). Interestingly, the mLN CCR4+CXCR3-/lo subset and the LP CCR4+CXCR3-/lo subset expressed very low T-bet, whereas the LP CCR4-/loCXCR3+ subset expressed higher T-bet (). We found a higher Tbx21 mRNA level in the mLN CCR4-/loCXCR3+ subset relative to the mLN CCR4+CXCR3-/lo subset (). Therefore, the CCR4+CXCR3-/lo subset contained Th17 cells while the CCR4-/loCXCR3+ subset included Th17.1 cells.
Figure 2. Subsets of IL-17A-expressing CD4+ T cells. (A) Flow cytometry dot plots showing the expression of CXCR3 and CCR4 on the surface of CD3+IL-17A+CCR6+ T cells in mLNs and LP. (B) Frequencies of indicated subsets in CD3+IL-17A+CCR6+ T cells in mLNs and LP. R4+R3-/lo: CCR4+CXCR3-/lo subset. R4-/loR3+: CCR4-/loCXCR3+ subset. (C) Flow cytometry histograms showing RORγt expression in the subsets. Note that only the CCR4+CXCR3-/lo subset is shown in the mLNs because the CCR4-/loCXCR3+ subset in the mLNs is too few to be analysed. (D) Mean fluorescence intensities (MFI) of RORγt. (E) Flow cytometry histograms showing T-bet expression in the subsets. Only the CCR4+CXCR3-/lo subset is shown in the mLNs. (F) T-bet MFI. N = 5 mice per group in (B). N = 5 data points per group in (D & F). Each data point represents cells pooled from 3 mice. ***: p < 0.001.
ZFP189 up-regulation in LP Th17.1 cells
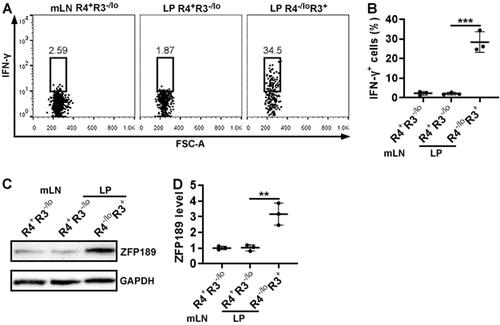
To further confirm the identities of the above-mentioned subsets, these cells were sorted from pooled mLNs and LP by flow cytometry and stimulated with PMA and ionomycin. After that, intracellular staining demonstrated that only the LP CCR4-/loCXCR3+ subset remarkably expressed IFN-γ while the CCR4+CXCR3-/lo subset, either in the mLNs or LP, did not (). Therefore, Th17.1 cells were enriched in the CCR4-/loCXCR3+ subset while Th17 cells were included in the CCR4+CXCR3-/lo subset. Next, we measured ZFP189 expression in Th17 and Th17.1 cells. It turned out that ZFP189 expression in mLN Th17 (i.e. the mLN CCR4+CXCR3-/lo subset) and LP Th17 (i.e. the LP CCR4+CXCR3-/lo subset) was low (). In contrast, ZFP189 was markedly up-regulated in LP Th17.1 cells (i.e. the LP CCR4-/loCXCR3+ subset) ().
Figure 3. ZFP189 expression in IL-17A-expressing CD4+ T cell subsets. (A) Flow cytometry dot plots showing IFN-γ expression in each subset after sorting and 4-hour stimulation with PMA/ionomycin. (B) Frequencies of IFN-γ-expressing cells in the subsets. (C) Immunoblotting image showing ZFP189 protein in the subsets. (D) Statistics of ZFP189 protein levels in the subsets. N = 3 data points per group. Each data point represents cells pooled from 3 mice in (B) or 10 mice in (D). **: p < 0.01; ***: p < 0.001.
The effect of ZFP189 knockdown on Th17 cell generation in vitro
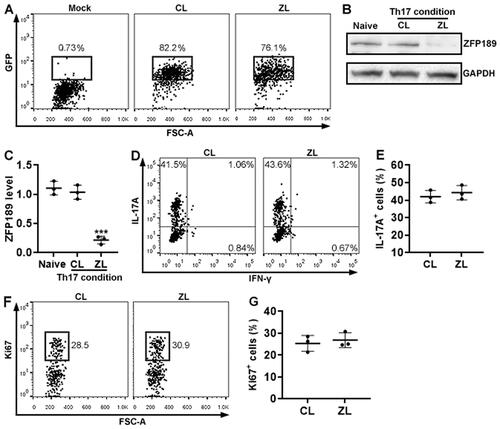
To determine the effect of ZFP189 on Th17 cells, we cultured wild-type mouse splenic CD4+ T cells under a Th17 polarisation condition and infected them with a lentivirus co-expressing ZfP189 siRNA and GFP. According to GFP expression, the viral infection efficiency reached approximately 80% (). ZFP189 knockdown was corroborated by Immunoblotting (). ZFP189 knockdown did not significantly impact the expression of IL-17A (). IFN-γ expression was barely found in either ZFP189-expressing or ZFP189-deficient T cells (). Additionally, ZFP189 knockdown did not alter Ki67 expression ().
Figure 4. The effect of ZFP189 knockdown on Th17 cell differentiation in vitro. (A) GFP expression in wild-type splenic CD4+ T cells after in vitro Th17 induction and lentiviral infection. Mock: infection medium only. CL: infection with control lentivirus with a scrambled siRNA sequence. ZL: infection with Zfp189 siRNA lentivirus. (B & C) ZFP189 protein in splenic CD4+ T cells after Th17 induction and lentiviral infection. Representative Immunoblotting images are shown in (B) and statistics are shown in (C). Naïve: naïve and non-infected CD4+ T cells. (D) Flow cytometry dot plots showing the expression of IL-17A and IFN-γ in after Th17 induction and lentiviral infection. (E) Frequencies of IL-17A-expressing cells. IFN-γ+ cells are too few to be analysed. (F) Flow cytometry dot plots showing Ki67 staining in Th17 cells. (G) Frequencies of Ki67+ cells. N = 3 or 4 independent samples per group. ***: p < 0.001.
The effect of ZFP189 knockdown on Th17.1 cell differentiation in vitro
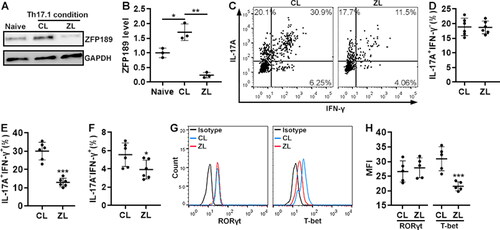
To study the effect of ZFP189 on Th17.1 differentiation, we cultured wild-type mouse splenic CD4+ T cells under a Th17.1 polarisation condition while infecting them with the same lentivirus. Interestingly, Th17.1 polarisation itself up-regulated ZFP189 in CD4+ T cells that were infected with the control virus (), suggesting that the cytokines in the Th17.1 polarisation medium might drive ZFP189 expression. ZFP189 knockdown was evident in T cells that were infected with the Zfp189 siRNA-encoding virus (). ZFP189 knockdown did not remarkably influence the generation of IL-17A+IFN-γ- T cells but suppressed the generation of IL-17A+IFN-γ+ cells (). Therefore, ZFP189 knockdown had an adverse effect on Th17.1 cell differentiation. Notably, a small number of IL-17A-IFN-γ+ cells were found under the Th17.1 polarisation condition, probably implying limited differentiation towards Th1 cells (). ZFP189 knockdown also suppressed the generation of the minority IL-17A-IFN-γ+ T cells (). In addition, compared with CD4+ T cells infected with the control virus, ZFP189-deficient CD4+ T cells expressed equivalent RORγt but lower T-bet ().
Figure 5. The effect of ZFP189 knockdown on Th17.1 cell generation in vitro. (A & B) ZFP189 protein in splenic CD4+ T cells after Th17.1 induction and lentiviral infection. Representative Immunoblotting images are shown in (A) and statistics are shown in (B). Naïve: naïve and non-infected CD4+ T cells. CL: infection with control lentivirus. ZL: infection with Zfp189 siRNA lentivirus. (C) Dot plots showing the expression of IL-17A and IFN-γ in splenic CD4+ T cells after Th17.1 induction and lentiviral infection. (D to E) Frequencies of IL-17A+IFN-γ- (D), IL-17A+IFN-γ+ (E), and IL-17A-IFN-γ+ cells (F) as shown in (C). (G) Histograms showing the expression of RORγt and T-bet in induced Th17.1 cells. Isotype: isotype control. (H) Mean fluorescence intensities of RORγt and T-bet in induced Th17.1 cells. N = 3 to 6 independent samples per group. *: p < 0.05; **: p < 0.01; ***: p < 0.001.
The effect of ZFP189 knockdown on colitis severity
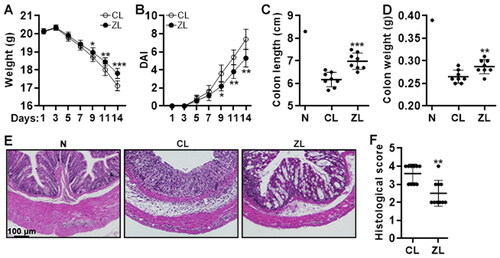
To study the role of ZFP189 in vivo, in vitro induced Th17.1 cells, either ZFP189-deficient or ZFP189-expressing, were adoptively transferred into Rag1-/- mice via intra-peritoneal injection after 3-day treatment with 2% DSS (The experimental design is shown in ). The body weight, faecal blood, and stool consistency were continuously monitored. On day 14, the recipients were sacrificed and the colon weight and length were recorded. As shown in , the body weight decreased from day 5 to day 14. Compared with mice receiving control Th17 cells, mice receiving ZFP189-deficient Th17.1 cells lost less body weight on day 9, 11, and 14. Besides, compared with mice receiving control Th17 cells, mice receiving ZFP189-deficient Th17.1 cells showed a lower DAI on day 9, 11, and 14, suggesting less colitis severity (). Furthermore, mice receiving ZFP189-deficient Th17.1 cells had longer and heavier colons than mice receiving control Th17 cells ( and SCitation4). The colon histological score was significantly lower in mice receiving ZFP189-deficient Th17.1 cells, compared with mice receiving control Th17 cells ().
Figure 6. The effect of ZFP189 knockdown on colitis severity. (A) Mouse body weight. (B) Disease activity index. (C & D) Colon length (C) and weight (D) on day 14. (E) H&E staining of colons on day 14. (F) Colon histological scores on day 7. CL: transfer of control Th17.1 cells. ZL: transfer of ZFP189-deficient Th17.1 cells. N: normal recipient without any treatment. N = 8 to 10 mice per group. *: p < 0.05; **: p < 0.01; ***: p < 0.001.
The effect of ZFP189 knockdown on Th17.1 cell generation in vivo
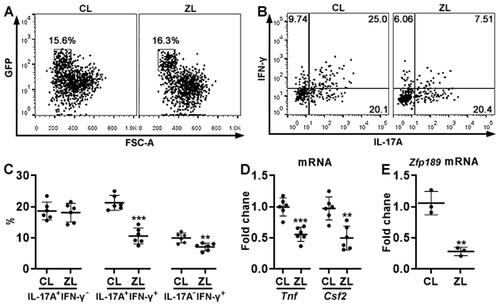
GFP+ cells, i.e. transferred Th17.1 cells, were sorted from the recipients’ LP (). After in vitro stimulation with PMA plus ionomycin, comparable frequencies of IL-17A+IFN-γ- cells were observed in ZFP189-deficient Th17.1 cells and control Th17.1 cells (). However, ZFP189-deficient Th17.1 cells generated fewer IL-17A+IFN-γ+ cells and IL-17A-IFN-γ+ cells than control Th17.1 cells (). Besides, ZFP189-deficient Th17.1 cells expressed less TNF-α (encoded by Tnf) and GM-CSF (encoded by Csf2) than control Th17.1 cells (). Zfp189 mRNA was still lower in ZFP189-deficient Th17.1 cells relative to control Th17.1 cells ().
Figure 7. The effect of ZFP189 knockdown on Th17.1 cell generation in vivo. (A) Dot plots showing exogenous GFP+ T cells in recipients’ LP on day 7 after transfer and DSS treatment. CL: Th17.1 cells infected with control lentivirus. ZL: Th17.1 cells infected with Zfp189 siRNA lentivirus. (B) Dot plots showing the expression of IL-17A and IFN-γ in sorted exogenous Th17.1 cells after 4-hour stimulation with PMA/ionomycin. (C) Frequencies of IL-17A+IFN-γ-, IL-17A+IFN-γ+, and IL-17A-IFN-γ+ cells in exogenous Th17.1 cells. (D) mRNA levels of indicated genes in exogenous Th17.1 cells. (E) Zfp189 mRNA levels in exogenous Th17.1 cells in recipients’ LP. N = 3 or 6 mice per group. **: p < 0.01; ***: p < 0.001.
Discussion
Th17 cells are deeply involved in the physiopathology of autoimmune diseases and inflammatory disorders [Citation26–28]. Cumulative studies indicate that Th17.1 cells (Also termed Th1-like Th17 or Th17/Th1 cells) featuring both Th17 cells and Th1 cell properties, are deeply involved in various inflammatory disorders including IBDs [Citation12–15]. Th17 cells expressing high IL-17A and C-C motif chemokine receptor 4 (CCR4), whereas Th17.1 cells express IL-17A, IFN-γ, and C-X-C motif chemokine receptor 3 (CXCR3) [Citation12,Citation13]. Th17.1 cells are more pathogenic than Th17 cells in inducing intestinal inflammation [Citation14]. We identified Th17 and Th17.1 cells according to the surface expression of CCR6, CXCR3, and CCR4, which have been successfully used for discriminating heterogeneous Th17 subsets in various diseases [Citation29,Citation30]. Consistent with previous reports [Citation13,Citation29], we found that putative Th17.1 cells, either in mLNs or LP, co-expressed IL-17A, RORγt, T-bet, and IFN-γ, whereas Th17 cells expressed IL-17 and RORγt but very low T-bet and IFN-γ. This suggests that these chemokine receptors are also reliable surface markers for recognising Th17 and Th17.1 cells in the colitis model. However, it is still unclear whether Th17.1 cells originated from Th17 cells or other CD4+ T helper cells. To answer this question, a lineage tracing study is needed to seek the origin of Th17.1 cells, especially in LP. We assume that Th17 cells could be the primary source of Th17.1 cells because the two cell types are phenotypically and functionally related.
Our study revealed that ZFP189 was up-regulated in LP Th17.1 cells compared with Th17 cells. However, the exact factor(s) responsible for this up-regulation is not clear. CREB could positively regulate the expression of ZFP189 (24). Considering colitic LP is an inflamed site where inflammatory cells and mediators are accumulated [Citation31], the local colitic microenvironment might activate the CREB signal pathway and increase ZFP189 expression. Interestingly, our data imply that the Th17.1 polarisation condition, rather than the Th17 polarisation condition, perhaps induces ZFP189 expression. The major difference between the two polarisation approaches is the presence of IL-12-related and IFN-γ-related signalling in the Th17.1 polarisation medium. IFN-γ has been reported to activate the cAMP/PKA/CREB signalling pathway in macrophages [Citation32]. Therefore, IFN-γ perhaps up-regulates ZFP189 via the CREB signalling. We will test this hypothesis in future studies. In the future, a thorough transcriptomic analysis of colitic Th17 and Th17.1 cells would help identify the key regulators of ZFP189 expression.
Using the lentivirus-mediated Zfp189 knockdown, we found that ZFP189 deficiency did not affect Th17 cell differentiation in vitro. In contrast, ZFP189 knockdown decreased Th17.1 cell generation, as evidenced by lower IFN-γ expression in ZFP189-deficient Th17.1 cells. Considering that Th17.1 cells expressed higher ZFP189 than Th17 cells in the LP, ZFP189 seems to propel Th17.1 differentiation and possibly the conversion of Th17 to Th17.1 cells. As a member of Kruppel-like zinc finger proteins, ZFP189 could bind to the promoter regions of the target genes by its C2H2 zinc finger repeats [Citation33]. Previous research found that ZFP189 regulates a resilient-specific transcriptional network in prefrontal cortical neurons [Citation23]. However, the direct target genes of ZFP189 in immune cells are completely unknown. In this study, quantification of RORγt and T-bet in Th17.1 cells indicated lower T-bet expression in ZFP189-deficient Th17.1 cells, implying that ZFP189 supports T-bet expression while not altering RORγt expression. It is therefore possible that ZFP189 directly binds to the Tbx21 gene or indirectly promotes the expression of signalling proteins crucial for the Tbx21 gene transcription. Our ongoing study is undertaking chromatin immunoprecipitation (ChIP) or electrophoresis mobility shift assay (EMSA) to analyse the potential interaction between ZFP189 and T-bet.
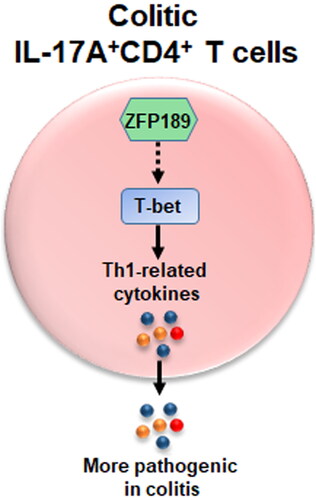
In summary, the present research sheds light on a novel mechanism by which Th17.1 cells are modulated in colitis. Through an unidentified signalling pathway, ZFP189 up-regulates T-bet expression in colitic IL-17A+CD4+ T cells to reinforce the expression of Th1-related cytokines, thus promoting the generation of pathogenic Th17.1 cells in colitis (, graphic abstract). If ZFP189 expression can be manipulated in Th17.1 cells, the pathogenicity of Th17.1 cells might be repressed. In this regard, our study suggests that ZFP189 could be a new therapeutic target for Th17.1-mediated colitis.
Figure 8. Summary of the effect of ZFP189 on LP Th17.1 cells.
Supplemental Material
Download MS Word (395.7 KB)Disclosure statement
No potential conflict of interest was reported by the authors.
Data availability statement
The data that support the findings of this study are available from the corresponding author upon reasonable request.
Additional information
Funding
References
- Bouma G, Strober W. The immunological and genetic basis of inflammatory bowel disease. Nat Rev Immunol. 2003;3(7):1–9.
- Melgar S, Shanahan F. Inflammatory bowel disease-from mechanisms to treatment strategies. Autoimmunity. 2010;43(7):463–477.
- Steinbach EC, Plevy SE. The role of macrophages and dendritic cells in the initiation of inflammation in IBD. Inflamm Bowel Dis. 2014;20:166–175.
- Imam T, Park S, Kaplan MH, et al. Effector T helper cell subsets in inflammatory bowel diseases. Front Immunol. 2018;9:1212.
- Peng SW, Sheng JM, Feng BS, et al. Identification of mite-specific eosinophils in the Colon of patients with ulcerative colitis. Autoimmunity. 2022;55(8):549–558.
- Hou G, Bishu S. Th17 cells in inflammatory bowel disease: an update for the clinician. Inflamm Bowel Dis. 2020;26(5):653–661.
- Karczewski J, Swora-Cwynar E, Rzymski P, et al. Selected biologic markers of inflammation and activity of Crohn’s disease. Autoimmunity. 2015;48(5):318–327.
- Muhammad Yusoff F, Wong KK, Mohd Redzwan N. Th1, Th2, and Th17 cytokines in systemic lupus erythematosus. Autoimmunity. 2020;53(1):8–20.
- Guery L, Hugues S. Th17 cell plasticity and functions in cancer immunity. Biomed Res Int. 2015;2015:314620.
- Omenetti S, Pizarro TT. The treg/Th17 axis: a dynamic balance regulated by the gut microbiome. Front Immunol. 2015;6:639.
- Bystrom J, Clanchy FIL, Taher TE, et al. Functional and phenotypic heterogeneity of Th17 cells in health and disease. Eur J Clin Invest. 2019;49(1):e13032.
- Annunziato F, Cosmi L, Liotta F, et al. Human Th17 cells: are they different from murine Th17 cells? Eur J Immunol. 2009;39(3):637–640.
- van Hamburg JP, Tas SW. Molecular mechanisms underpinning T helper 17 cell heterogeneity and functions in rheumatoid arthritis. J Autoimmun. 2018;87:69–81.
- Harbour SN, Maynard CL, Zindl CL, et al. Th17 cells give rise to Th1 cells that are required for the pathogenesis of colitis. Proc Natl Acad Sci USA. 2015;112(22):7061–7066.
- Maeda S, Osaga S, Maeda T, et al. Circulating Th17.1 cells as candidate for the prediction of therapeutic response to abatacept in patients with rheumatoid arthritis: an exploratory research. PLoS One. 2019;14(11):e0215192.
- van Langelaar J, van der Vuurst de Vries RM, Janssen M, et al. T helper 17.1 cells associate with multiple sclerosis disease activity: perspectives for early intervention. Brain. 2018;141(5):1334–1349.
- Hou L, Yuki K. CCR6 and CXCR6 identify the Th17 cells with cytotoxicity in experimental autoimmune encephalomyelitis. Front Immunol. 2022;13:819224.
- Hsieh PN, Fan L, Sweet DR, et al. The Kruppel-Like factors and control of energy homeostasis. Endocr Rev. 2019;40(1):137–152.
- Odeberg J, Rosok O, Gudmundsson GH, et al. Cloning and characterization of ZNF189, a novel human kruppel-like zinc finger gene localized to chromosome 9q22-q31. Genomics. 1998;50(2):213–221.
- Odeberg J, Ahmadian A, Williams C, et al. Context-dependent taq-polymerase-mediated nucleotide alterations, as revealed by direct sequencing of the ZNF189 gene: implications for mutation detection. Gene. 1999;235(1–2):103–109.
- Strauss LG, Dimitrakopoulou-Strauss A, Koczan D, et al. Correlation of dynamic PET and gene array data in patients with gastrointestinal stromal tumors. Sci World J. 2012;2012:721313.
- Jugessur A, Shi M, Gjessing HK, et al. Maternal genes and facial clefts in offspring: a comprehensive search for genetic associations in two population-based cleft studies from scandinavia. PLoS One. 2010;5(7):e11493.
- Lorsch ZS, Hamilton PJ, Ramakrishnan A, et al. Stress resilience is promoted by a Zfp189-driven transcriptional network in prefrontal cortex. Nat Neurosci. 2019;22(9):1413–1423.
- Wang IF, Wang Y, Yang YH, et al. Activation of a hippocampal CREB-pCREB-miRNA-MEF2 axis modulates individual variation of spatial learning and memory capability. Cell Rep. 2021;36(5):109477.
- Lexberg MH, Taubner A, Albrecht I, et al. IFN-gamma and IL-12 synergize to convert in vivo generated Th17 into Th1/Th17 cells. Eur J Immunol. 2010;40(11):3017–3027.
- Jin D, Zhang L, Zheng J, et al. The inflammatory Th 17 subset in immunity against self and non-self antigens. Autoimmunity. 2008;41(2):154–162.
- Goncalves RSG, Pereira MC, Dantas AT, et al. IL-17 and related cytokines involved in systemic sclerosis: perspectives. Autoimmunity. 2018;51(1):1–9.
- Yasuda K, Takeuchi Y, Hirota K. The pathogenicity of Th17 cells in autoimmune diseases. Semin Immunopathol. 2019;41(3):283–297.
- Bailey SR, Nelson MH, Himes RA, et al. Th17 cells in cancer: the ultimate identity crisis. Front Immunol. 2014;5:276.
- Wacleche VS, Landay A, Routy JP, et al. The Th17 lineage: from barrier surfaces homeostasis to autoimmunity, cancer, and HIV-1 pathogenesis. Viruses. 2017;9(10):303.
- Jacobsen GE, Fernandez I, Quintero MA, et al. Lamina propria phagocyte profiling reveals targetable signaling pathways in refractory inflammatory bowel disease. Gastro Hep Adv. 2022;1(3):380–392.
- Liu L, Wang Y, Fan Y, et al. IFN-gamma activates cAMP/PKA/CREB signaling pathway in murine peritoneal macrophages. J Interferon Cytokine Res. 2004;24(6):334–342.
- Li X, Han M, Zhang H, et al. Structures and biological functions of zinc finger proteins and their roles in hepatocellular carcinoma. Biomark Res. 2022;10(2022):1–13.