
Abstract
Systemic lupus erythematosus (SLE) is a chronic autoimmune disease. At present, the mechanism of non-coding RNA in renal injury in SLE patients is still unclear. A total of 64 DEcircRNAs, 75 DEmiRNAs, and 249 DEmRNAs were identified. We integrated 10 circRNAs, 10 miRNAs, and 88 target mRNAs into a circRNA-miRNA-mRNA network and obtained 9 hub genes (circ-0000006, miR-766-3p, miR-409-3p, miR-339-3p, miR-331-3p, miR-140-3p, miR-186-5p, miR-149-5p, PSME3). The ROC curve results showed that the diagnostic efficiency of 6 hub miRNA was higher than that of has_circ_0000006 and PSEME3. SsGSEA analysis revealed immune cell composition in SLE and control renal tissues, including 3 types of immune cells up-regulated (gamma delta T cell, effector memory CD4 T cell, central memory CD8 T cell) and 4 types down-regulated (memory B cell, mast cell, macrophage, immature dendritic cell, eosinophil) in SLE patients. In addition, PSME3 was negatively correlated with 3 up-regulated immune cells and positively correlated with 4 down-regulated immune cells in SLE patients. Our study provides a deeper understanding of the circRNA-related competing endogenous RNA regulatory mechanism in the renal injury of systemic lupus erythematosus.
1. Introduction
Systemic lupus erythematosus (SLE) is an autoimmune disease that leads to systemic multi-tissue and organ damage due to loss of immune tolerance, which is caused by the interaction of a variety of genetic and environmental factors, including drugs, smoking, and UV exposure [Citation1]. Kidney injury is the most serious type of multi-system and multi-organ injury caused by SLE, also known as lupus nephritis (LN), which results in high morbidity and mortality [Citation2,Citation3]. Specifically, the kidney damage rate of SLE patients is as high as 50%, and the mortality rate of SLE patients with LN is much higher than that without kidney damage. In addition, the incidence of nephritis varies by ethnicity [Citation3]. Therefore, the detection and evaluation of renal injury in SLE patients can help to consider how to treat them timely and effectively, so as to improve the prognosis of patients. It is well known that the early diagnosis and treatment of SLE are beneficial to the timely prevention and alleviation of renal injury. At present, there is still a great challenge to hunt for the predictors of favorable renal prognosis of SLE patients in the early. Short and long-term targets of diagnosis are focused on clinical, histological, and molecular biomarkers to renal prognosis in LN. The single-molecule and large proteomic of serum makers, and urinary biomarkers were all important factors. Studies have manifested that Urinary neutrophil gelatinase-associated lipocalin (uNGAL) levels were a good biomarker to predict the development of chronic kidney disease (CKD) with SLE [Citation4]. The mean urinary BKV miR-B1-5p level was significantly lower in the LN group than in the non-LN group [Citation4]. In a conclusion, the urinary biomarkers may prove useful as a surrogate for kidney biopsies in the near future [Citation5]. Although urine biomarkers can reflect changes in renal function, more sensitive and early biomarkers are still needed to detect early tissue damage in the kidney.
In recent years, noncoding RNAs have been reported to be involved in the occurrence and development of SLE. For example, Guo et al. confirmed that hsa_circ_0000479 is a new diagnostic marker of SLE [Citation6]. Zhang et al. proposed that hsa_circRNA_407176 and hsa_circRNA_001308 in plasma and PBMCs could be potential biomarkers for SLE [Citation7]. miRNAs have also been reported to be useful in the diagnosis of LN, for example, miR-125a, miR-142-3p, miR-146 and miR-155 in combination have been reported as diagnostic markers for LN patients 30211077. miR-210, miR-133, miR-181a and miR-223, MiR-145, have been reported to participate in and promote lupus erythematosus nephritis [Citation1,Citation8–10]. More importantly, interactions between noncoding RNAs are involved in the occurrence and progression of immune disorders and multiple tissue damage in SLE. Xu et al. constructed a lncRNA-miRNA-mRNA network of aberrantly expressed non-coding RNA in SLE patients [Citation11]. Zhang et al. constructed a circRNA-miRNA-mRNA network of abnormally expressed non-coding RNA in plasma of SLE patients [Citation12]. However, the interaction of non-coding RNAs in renal tissue of LN patients has not been reported.
In this study, SLE related renal transcriptome data were obtained from GEO database, and the regulatory network of circRNA-miRNA-mRNA in SLE renal tissue was obtained, which is helpful to reveal the molecular mechanism of SLE renal injury at the post-transcriptional level, and provide a new target for early diagnosis and treatment of LN.
2. Dates and data sources
2.1. Data source
The sample types of circRNA transcriptome data from SLE patients in the GEO database include blood-derived lymphocytes, monocytes, and kidney tissues. The differential circRNAs of the two available blood-derived circRNA datasets (GSE84656 and GSE107344) do not intersect. Besides, there is only one miRNA for the results of Circular RNA Interactome on the differential circRNA of the two circRNA datasets and the differential miRNAs of the miRNA datasets (GSE79240, GSE175840) from blood samples. The available circRNA datasets and miRNA datasets from kidney tissue sources are GSE108340 and GSE37426, respectively. Compared with the blood-derived miRNA dataset, the differential miRNAs in the kidney tissue-derived miRNA dataset (GSE37426) have more interactions with the differential circRNAs in the kidney tissue-derived circRNA dataset (GSE108340) (Circular RNA Interactome prediction). Therefore, the circRNA dataset (GSE108340) and the miRNA dataset (GSE37426) were selected to analyze the differential circRNAs and miRNAs associated with SLE kidney tissue injury, respectively. In addition, the SLE-related mRNA dataset GSE153781 was used to analyze differential mRNA and immune-related gene expression. The control set of immune-related genes in immune cells was downloaded from http://cis.hku.hk/TISIDB/data/download/CellReports.txt.
2.2. Differentially expression analysis
The differentially expressed genes (DEGs) in the cirRNA dataset GSE108340, the miRNA dataset GSE37426 and the mRNA dataset GSE153781 were analyzed by LIMMA package of Bioconductor. Take p-value < 0.05 and | log2 fold change (log2FC) | > 1, DEcirRNA, DEmiRNA and DEmRNA were obtained.
2.3. Prediction of circRNAs target miRNAs
The Circular RNA Interactome database (https://circinteractome.nia.nih.gov/) was used to predict the targeted miRNAs interacting with DE-circRNA, and the candidate cirRNA-miRNA pairs were obtained after intersecting with the DE-miRNAs of GSE37426. Then, RNA-hybrid validation was performed. DE-circRNAs, perfectly paired with 2-7 nucleotides at the 5′ end of the DE-miRNA sequence were selected to obtain cirRNA-miRNA pairs. miRDB, miR-TarBase and TargetScan databases were used to predict the targeted mRNA corresponding to DE-miRNA. The mRNA in the regulatory relationship of miRNA-mRNA predicted in any two or more databases were selected and intersected with the DEmRNA set to determine DEmiRNA-DEmRNA pairs.
2.4. Construction of the circRNA-miRNA-mRNA regulatory network
Cytoscape (version 3.8.1) was used to integrate DE cirRNA-DEmiRNA pairs and DEmiRNA-DEmRNA pairs to construct and visualize cirRNA-miRNA-mRNA ceRNA networks. The cytohubba plugin was used to analyze the topological properties of the ceRNA network. According to the three indicators of degree of merger, betweenness centrality, and radiality, the top 10% nodes in the ceRNA network were considered as hub genes. In addition, the CluGO plugin was used for GO and KEGG enrichment of mRNAs in ceRNAs.
2.5. Clinical significance of Hub gene in SLE patients
The correlation between Hub gene and SLE clinical parameters (anti-DSDNA, anti-Ribosomal P, anti-RNP, anti-SS-A, anti-SM, anti-SS-B, ESR1, SLE1, etc.) was analyzed based on clinical information from the data set. ROC curve was used to analyze the diagnostic efficiency of Hub gene expression in SLE.
2.6. Immune infiltration analysis
The composition of immune cells in SLE patient and control samples was predicted by ssGSEA, which was performed by GSVA package to analyze the mRNA expression of immune genein in the GSE153781 dataset. The immune genetic control set was download from http://cis.hku.hk/TISIDB/data/download/CellReports.txt. The statistics of differential immune cells were based on signed-rank test (p < 0.05). The composition of immune cells is mainly determined by gene expression, and correlation analysis is also carried out based on mRNA expression. Therefore, the correlation analysis was conducted based on the linear fitting between Hub gene expression level and the proportion of immune cells (p < 0.05).
2.7. Patients and specimen collection
The human samples in this study were approved by the Ethics Committee of the First People’s Hospital of Yunnan Province, all participants signed written informed consent. Peripheral blood samples were collected from patients diagnosed with SLE (n = 31) and control samples were collected from healthy volunteers recruited from the dermatology department of Yunnan First People’s Hospital (n = 30). Disease activity was evaluated according to the SLE disease activity index-2000 (SLEDAI-2000) [Citation13]. Peripheral blood mononuclear cells (PBMCs) obtained by Ficoll-Paque density gradient separation were used for subsequent qRT-pCR validation experiments. patients and control participants are shown in .
Table 1. Subject characteristics-discovery cohort.
2.8 qRT-PCR validation
Total RNA of PBMCs were collected by TRIzol® and rationed by NanoDrop 2000 (Thermo Fisher Inc., Waltham, MA, USA). The mRNA first-strand cDNA was obtained with PrimeScript™ 1st Strand cDNA Synthesis Kit (Takara). miRNA first-strand cDNA was synthesized with a miR-X miRNA First-Strand Synthesis Kit (Takara). qPCR was performed using TB Green® Premix Ex Taq™ II kit (Takara Biotech) on an ABI 7500 real-time PCR system (ABI, USA). GAPDH and U6 were used to normalize the expression data. The data were analyzed by 2−ΔΔCT. All primers are from Tsingke Biotechnology (Beijing, China) ().
Table 2. Primer sequence for qRTPCR experiment.
2.9. Statistical analyses
SPSS 23.0 (SPSS, USA) and GraphPad Prism 7.0 (GraphPad Software Inc., USA) were applied to data analysis. The measurement data of normal distribution was expressed as (X ± S), and data of partial normal distribution are expressed as median inter quartile range[M(QR)]. The difference analysis of the measurement data of normal distribution between the two groups was analyzed by Two-tailed Student’s t-test. Receiver operating characteristic (ROC) curve analysis was carried out to evaluate the performances of candidate miRNAs and to distinguish SLE cases from controls. p < 0.05 indicated statistical significance.
3 Results
3.1. Identification of DEcircRNAs, DEmiRNAs and DEmRNAs
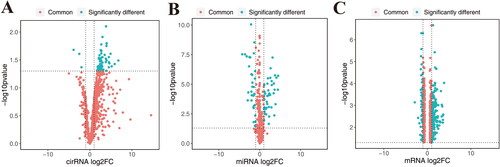
In this study, 64 differentially expressed circRNAs associated with SLE were obtained in GSE108340, of which 61 were highly expressed in SLE and 3 were highly expressed in normal ().75 miRNAs were obtained in GSE37426, of which 43 were highly expressed in SLE and 32 were highly expressed in normal (). 249 differentially expressed mRNAs were found in GSE153781, of which 188 were highly expressed in SLE and 61 were highly expressed in normal ().
Figure 1. Differentially expressed circRNA, miRNA and mRNA in normal and SLE samples. A, differentially expressed cirRNA in GSE108340. B, differentially expressed miRNA in GSE37426. C, differentially expressed mRNA in GSE153781.
3.2. Prediction of cirRNA-miRNA pairs and target mRNAs
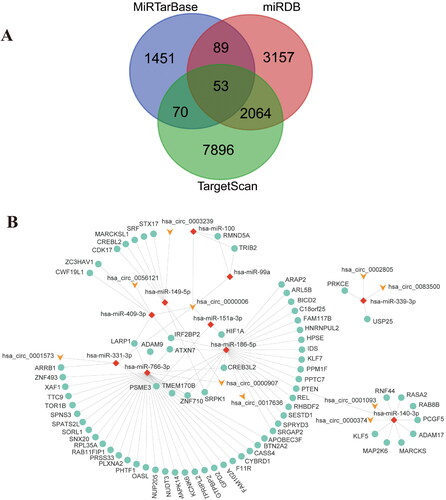
The prediction of 64 differential cirRNAs in the Circular RNA Interactome database yielded 1948 interacting miRNAs; this included 75 differential miRNAs in GSE37426. Therefore, there are a total of 75 candidate cirRNA-miRNA pairs. RNA-hybrid validation finally obtained 10 cirRNA-miRNA pairs. The target genes of these 10 miRNAs were predicted by miRDB, miR-TarBase and TargetScan databases. A total of 2277 target gene mRNAs were predicted in the three databases, of which 53 target genes appeared in all three databases, and 2276 target genes appeared in at least two databases. These target genes were intersected with 249 differential mRNAs from GSE153781, resulting in 88 mRNAs ().
Figure 2. Prediction, construction and analyzation of miRNA-mRNA network. (A) Intersection of target mRNA predicted by miRDB, miR-TarBase and TargetScan databases (B) The cirRNA-miRNA-mRNA ceRNA network; (C) The top 10 hub genes of the ceRNA network.
3.3. Construction of the ceRNA network
10 cirRNA-miRNA pairs and 88 target gene mRNAs were integrated to create a cirRNA-miRNA-mRNA network. Cytoscape (version 3.8.1) was used to visualize the cirRNA-miRNA-mRNA ceRNA network ().
3.4. Identification of Hub genes and annotation of miRNA target gene
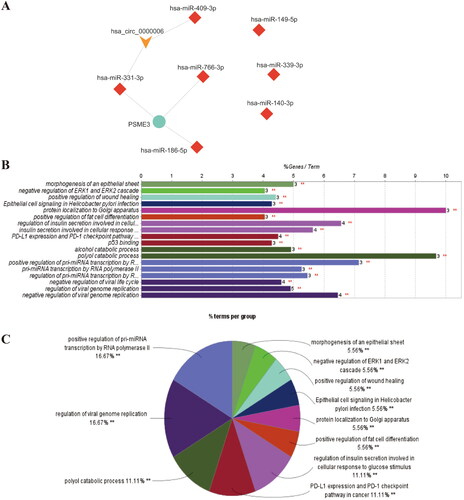
Cytohubba plugin is used to analyze the topological properties of ceRNA network. According to degree, Betweenness centrality, radiality, the top 10% nodes in the network are selected as Hub gene (). The results of GO and KEGG analysis of the target genes of 10 miRNAs in the ceRNA network by the CluGO plugin revealed the possible mechanism of non-coding RNAs on SLE kidney injury ().
Figure 3. GO and KEGG analysis of 10 miRNA target genes in ceRNA network.
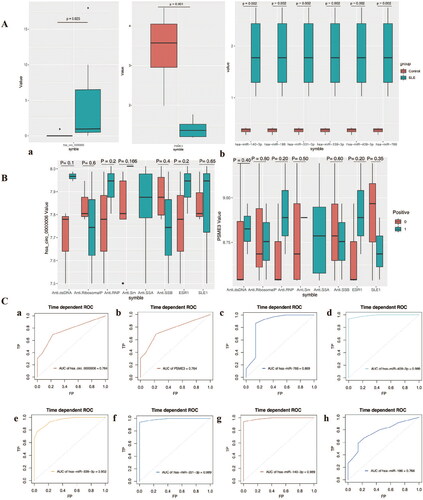
3.5. Clinical significance and diagnostic efficiency of hub gene expression
The expression of hub gene in SLE patient and healthy control samples was further analyzed. Specifically, circ-0000006, hsa-miR-140-3p, hsa-miR-186, hsa-miR-331-3p, hsa-miR-339-3p, hsa-miR-409-3p, hsa-miR-776 is highly expressed in SLE renal tissue samples, while the target gene PSME3 was significantly reduced in SLE patients (). Next, the association of Hub genes with SLE clinicopathological parameters was analyzed. Due to the lack of clinical information in the public data, only the clinical data of the samples are disclosed in the GSE84655 dataset, which only contains expression data of cirRNA and miRNA (). Therefore, the correlation between Hub gene and clinicopathological parameters only involves has_circ_0000006 (hsa_circRNA_001621) and PSEME3. Receiver operating characteristic curve was used to evaluate the diagnostic efficiency of Hub genes, and the results showed that the AUC values of 8 Hub genes were all higher than 0.76, which were hsa-circ-0000006 = 0.764, PSME3 = 0.764, hsa-miR-766 = 0.869, hsa-miR-409-3p = 0.989, hsa-miR-339-3p = 0.952, hsa-miR-331-3p = 0.989, hsa-miR-140-3p = 0.989, hsa-miR-186-5p = 0.766. In addition, the six miRNAs were more effective in distinguishing SLE patients from normal individuals than has_circ_0000006 and PSEME3().
Figure 4. Clinical significance and diagnostic efficiency of hub gene expression. A, Comparison of hub genes expression between SLE patients and control. B, Correlation between the expression of Hub gene and clinicopathological parameters of SLE. a, Correlation between hsa-circ-0000006 (hsa-circRNA-001621) and clinicopathological parameters of SLE; b, Correlation between PSME3 and clinicopathological parameters of SLE. C, Diagnostic efficiency of Hub gene for SLE. a, has_circ_0000006. b, PSEME3. c, hsa-miR-766 = 0.869. d, hsa-miR-409-3p. e, hsa-miR-339-3p. f, hsa-miR-331-3p. g, hsa-miR-140-3p. h, hsa-miR-186-5p.
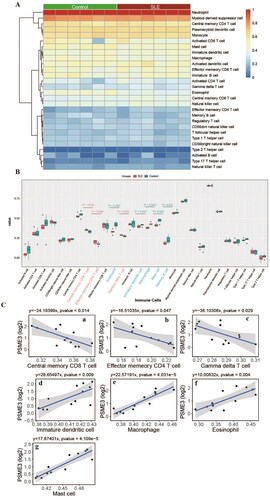
3.6. Correlation between hub gene and immune cells
The ssGSEA method in the GSVA package was used to perform predictions of immune cell composition in patient and control samples, based on the gene expression levels of the GSE153781 dataset. Difference analysis results showed that Gamma delta T cell, Effector memory CD4 T cell, Central memory CD8 T cell was significantly increased in the patient group, while Memory B cell, Mast cell, Macrophage, Immature dendritic cell, and Eosinophil were significantly decreased (). Finally, the correlation between the expression of Hub gene (PSME3) and the content of 28 kinds of immune cells was analyzed. The results showed that PSME3 was negatively correlated with 3 up-regulated immune cells and positively correlated with 4 down-regulated immune cells in SLE patients ().
Figure 5. Characteristics of immune cell infiltration in renal tissue of SLE patients. (A) Immune cell composition of SLE and control samples. (B) Differences in immune cells between SLE and control samples; (C) correlation between PSME3 and differential immune cells in SLE.
3.7. Validation of hub gene expression in SLE patients
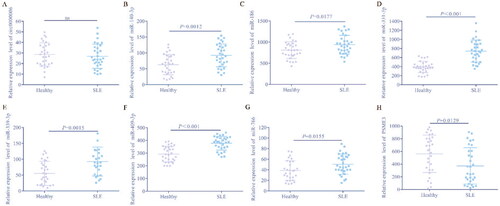
To further determine the expression of eight hub genes in SLE patients in this study, qRT-PCR was used to quantify the levels of these genes in blood samples from 31 SLE patients and 30 healthy controls. The results showed that except circ-0000006, the expression of the other 7 genes was consistent with our expectations. Specifically, hsa-miR-140-3p, hsa-miR-186, hsa-miR-331-3p, hsa-miR-339-3p, hsa-miR-409-3p and hsa-miR-766 are significantly increased, PSME3 is significantly reduced in SLE patients, compared to the control group (). To our surprise, there was no significant difference in circ-0000006 between SLE and normal controls, which may be related to elevated levels of other non-coding RNAs, such as miRNAs, or may be due to regional or ethnic differences in other studies and our sample. The elevated expression of circ-0000006 in SLE patients in our study was the result of sequencing data analysis from the GEO database, which was inconsistent with the actual qRT-PCR data. Finally, we believe that hsa-miR-140-3p, hsa-miR-186, hsa-miR-331-3p, hsa-miR-339-3p, hsa-miR-409-3p, hsa-miR-776 and PSME3 may be potential biomarkers of SLE.
Figure 6. Identification of differential expression of hub genes in patients/healthy by qRT-PCR.
4. Discussion
Lupus nephritis (LN) is the most serious complication of systemic lupus erythematosus. Current diagnostic and therapeutic criteria for LN cannot accurately predict early renal damage and severity in SLE patients [Citation14]. Currently, routine clinical parameters such as proteinuria, GFR, urinary sediment, anti-dsDNA and complement levels have poor sensitivity and specificity in patients with lupus nephritis [Citation15]. Kidney biopsy is an invasive procedure with a high risk of infection. Therefore, it is necessary to develop new non-invasive diagnostic methods and detection markers for the clinical diagnosis of LN. Research suggests that urine and blood samples may be a source of biomarkers for lupus nephritis. For example, complement, autoantibodies, chemokines, cytokines, and leukocytes have been reported as potential non-invasive biomarkers for LN [Citation16,Citation17]. However, the detection effect of these markers for LN is still not ideal. In addition to some classical clinical indicators (C3, C4, CH50, etc.), there are no ideal and effective indicators for clinical diagnosis of LN [Citation18].
An ideal biomarker should be able to detect renal tissue damage and assess disease progression at an early stage. Recent studies have confirmed that non-coding RNAs, especially miRNAs, are considered as potential new targets for disease diagnosis and treatment, which have also received extensive attention in SLE. In this study, transcriptome data of renal tissue samples from SLE patients were obtained from GEO database to systematically analyze the differential expressions of circRNA, miRNA and mRNA in SLE renal tissue. CeRNA networks were further constructed to identify potential predictors and therapeutic targets of renal injury in SLE patients. In this study, eight hub genes (hsa-circ-0000006, hsa-miR-766-3p, hsa-miR-409-3p, hsa-miR-339-3p, hsa-miR-331-3p, hsa-miR-140-3p, hsa-miR-186-5p, PSME3) were identified as candidate markers of SLE kidney injury.
Currently, circ-0000006 has not been reported in autoimmune diseases, which may be a new target of SLE kidney injury. miR-766-3p was reported to be significantly down-regulated in vitiligo patients [Citation19]. miR-766-3p indirectly inhibits NF-κB signaling to promote anti-inflammatory responses in human rheumatoid arthritis (RA) [Citation20]. Furthermore, miR-766-3p was significantly downregulated in RA patients who responded to TNF inhibitor (etanercept) treatment [Citation21]. These studies suggest that miR-766-3p may contribute to reducing inflammatory levels in autoimmune diseases. Our results indicated that miR-766-3p expression was elevated in SLE kidney tissue, which may be due to the up regulation of miR-766-3p in kidney to resist early inflammatory injury. miR-409-3p has been reported to be upregulated in autoimmune encephalomyelitis (EAE) and target the SOCS3/STAT3 signaling pathway to participate in IL-17-induced tissue damage [Citation22]. Moreover, previous studies have shown that hsa-miR-409 may be a potential biomarker of lupus [Citation23]. This is consistent with our results that hsa-miR-409(3p) is a key marker of SLE. miR-766-3p has been reported as a biomarker of lupus nephritis [Citation24]. miR-331-3p has not been reported in LN and SLE, but has been reported to be involved in the progression of rheumatoid arthritis [Citation25]. In addition, miR-331-3p was reported to be a repressor of the MAPK pathway [Citation26], which requires further study and validation in SLE kidney injury. miR-140-3p has been identified as a plasma biomarker for rheumatoid arthritis and systemic lupus erythematosus [Citation27,Citation28]. Furthermore, miR-140-3p may be involved in the progression of chronic kidney disease (CKD) [Citation29]. miR-186-5p is considered to be an inflammation-related gene involved in the progression of systemic autoinflammatory disease (SAID) [Citation30]. Proteasome activator subunit 3 (PSME3), also known as REGγ, PA28γ or Ki antigen, is a member of the 11s proteasome activator family. PSME3 has been reported to participate in the regulation of cell cycle by degrading various proteins include SRC-3, p16, p19, and p21 through ubiquitin-independent and ATP-independent pathways [Citation31]. In fact, PSME3 is a Ki antigen and a highly conserved nuclear protein that can be detected by autoantibodies in the serum of patients with systemic lupus erythematosus [Citation32]. Other studies have shown that PSME3 is a key regulator of pathogen infection, host defense, inflammation and immunity [Citation33–36]. This study demonstrates that PSME3 is a biomarker of renal injury in SLE patients. The eight Hub genes in this study are associated with inflammation and immunity, which are potential targets of SLE kidney injury. Furthermore, among the 8 Hub genes, miRNAs were more efficient in distinguishing SLE from normal individuals, compared to circRNAs and mRNAs, while the diagnostic efficiency of the three RNAs was not compared in other studies.
Abnormal infiltrating immune cells have been reported to promote the pathogenesis of LN. It was demonstrated that the T cells and macrophages were the majority of the infiltrating immune cell population [Citation37]. We found that Gamma delta T cells, Effector memory CD4 T cells and Central memory CD8 T cells were significantly increased in SLE kidney tissue, while memory B cells, mast cells, macrophages, immature dendritic cells and eosinophils were obviously decreased. Recent study indicated that the CD11c macrophages may be attend the pathogenesis of tubulointerstitial injury in LN [Citation38]. Our study also demonstrated abnormal infiltration of macrophages in SLE renal tissue. Moreover, PSME3 was negatively correlated with 3 up-regulated immune cells and positively correlated with 4 down-regulated immune cells. These results suggest that PSME3 is a biomarker of renal immune status in SLE.
5. Conclusions
Our study obtained differentially expressed circRNAs, miRNAs and mRNAs in kidney samples from SLE patients, and constructed a circRNA-miRNA-mRNA network, which revealed that 1 circRNA, 6 miRNAs and 1 mRNA may be associated with renal injury in SLE. This study provides new insights and potential therapeutic targets into SLE kidney injury. However, all these results were speculated by various bioinformatics analyses, and it still needs to be further confirmed.
Author contributions
L Y and C J were responsible for the analysis of the experimental data, and the writing and revision of the manuscript. M X and YH C participated in the collection and analysis of experimental data, Y Z and RX Z designed and managed the study, and all authors revised and agreed to this manuscript.
Informed consent and patient details
Not applicable.
Submission declaration and verification
This manuscript has not been published previously.
| Abbreviations | ||
| SLE | = | systemic lupus erythematosus |
| LN | = | lupus nephritis |
| uNGAL | = | urinary neutrophil gelatinase-associated lipocalin |
| CKD | = | chronic kidney disease |
| GEO | = | gene expression omnibus |
| GO | = | gene ontology |
| KEGG | = | kyoto Encyclopedia of genes and genomes |
| RA | = | rheumatoid arthritis |
| EAE | = | encephalomyelitis |
| SAID | = | systemic autoinflammatory disease |
Acknowledgment
Thanks to all the members who participated in this study.
Disclosure statement
No potential conflict of interest was reported by the authors.
Additional information
Funding
References
- Garchow B, Maque Acosta Y, Kiriakidou M. HIF-1α and miR-210 differential and lineage-specific expression in systemic lupus erythematosus. Mol Immunol. 2021;133:1–10.
- Sawada T, Fujimori D, Yamamoto Y. Systemic lupus erythematosus and immunodeficiency. Immunol Med. 2019;42(1):1–9.
- Parikh SV, Almaani S, Brodsky S, et al. Update on lupus nephritis: core curriculum 2020. Am J Kidney Dis. 2020;76(2):265–281.
- Li YJ, Wu HH, Liu SH, et al. Polyomavirus BK, BKV microRNA, and urinary neutrophil gelatinase-associated lipocalin can be used as potential biomarkers of lupus nephritis. PLoS One. 2019;14(1):e0210633.
- Arazi A, Rao DA, Berthier CC, et al. The immune cell landscape in kidneys of patients with lupus nephritis. Nat Immunol. 2019;20(7):902–914.
- Guo G, Wang H, Ye L, et al. Hsa_circ_0000479 as a novel diagnostic biomarker of systemic lupus erythematosus. Front Immunol. 2019;10:2281.
- Zhang MY, Wang JB, Zhu ZW, et al. Differentially expressed circular RNAs in systemic lupus erythematosus and their clinical significance. Biomed Pharmacother. 2018;107:1720–1727.
- Huang Z, Pang G, Huang YG, et al. miR-133 inhibits proliferation and promotes apoptosis by targeting LASP1 in lupus nephritis. Exp Mol Pathol. 2020;114:104384.
- Abdul-Maksoud RS, Rashad NM, Elsayed WSH, et al. Circulating miR-181a and miR-223 expression with the potential value of biomarkers for the diagnosis of systemic lupus erythematosus and predicting lupus nephritis. J Gene Med. 2021;23(5):e3326.
- Liao W, He XJ, Zhang W, et al. MiR-145 participates in the development of lupus nephritis by targeting CSF1 to regulate the JAK/STAT signaling pathway. Cytokine. 2022;154:155877.
- Xu H, Chen W, Zheng F, et al. Reconstruction and analysis of the aberrant lncRNA-miRNA-mRNA network in systemic lupus erythematosus. Lupus. 2020;29(4):398–406.
- Zhang J, Liu Y, Shi G. The circRNA-miRNA-mRNA regulatory network in systemic lupus erythematosus. Clin Rheumatol. 2021;40(1):331–339.
- Gladman DD, Ibañez D, Urowitz MB. Systemic lupus erythematosus disease activity index 2000. J Rheumatol. 2002;29(2):288–291.
- Davidson A, Aranow C, Mackay M. Lupus nephritis: challenges and progress. Curr Opin Rheumatol. 2019;31(6):682–688.
- Soliman S, Mohan C. Lupus nephritis biomarkers. Clin Immunol. 2017;185:10–20.
- Adhya Z, El Anbari M, Anwar S, et al. Soluble TNF-R1, VEGF and other cytokines as markers of disease activity in systemic lupus erythematosus and lupus nephritis. Lupus. 2019;28(6):713–721.
- Manoharan A, Madaio MP. Biomarkers in lupus nephritis. Rheum Dis Clin North Am. 2010;36(1):131–143, ix.
- Miguel DF, Terreri MT, Pereira RMR, et al. Comparison of urinary parameters, biomarkers, and outcome of childhood systemic lupus erythematosus early onset-lupus nephritis. Adv Rheumatol. 2020;60(1):10.
- Shang Z, Li H. Altered expression of four miRNA (miR-1238-3p, miR-202-3p, miR-630 and miR-766-3p) and their potential targets in peripheral blood from vitiligo patients. The Journal of Dermatology. 2017;44(10):1138–1144.
- Hayakawa K, Kawasaki M, Hirai T, et al. MicroRNA-766-3p contributes to anti-Inflammatory responses through the indirect inhibition of NF-κB signaling. Int J Mol Sci. 2019;20(4):809.
- Liu Y, Han Y, Qu H, et al. Correlation of microRNA expression profile with clinical response to tumor necrosis factor inhibitor in treating rheumatoid arthritis patients: a prospective cohort study. J Clin Lab Anal. 2019;33(7):e22953.
- Liu X, Zhou F, Yang Y, et al. MiR-409-3p and MiR-1896 co-operatively participate in IL-17-induced inflammatory cytokine production in astrocytes and pathogenesis of EAE mice via targeting SOCS3/STAT3 signaling. Glia. 2019;67(1):101–112.
- Omidi F, Hosseini SA, Ahmadi A, et al. Discovering the signature of a lupus-related microRNA profile in the gene expression omnibus repository. Lupus. 2020;29(11):1321–1335.
- Guan J, Wang G, Tam LS, et al. Urinary sediment ICAM-1 level in lupus nephritis. Lupus. 2012;21(11):1190–1195.
- Zhao Q, Zhao F, Liu C, et al. LncRNA FOXD2-AS1 promotes cell proliferation and invasion of fibroblast-like synoviocytes by regulation of miR-331-3p/PIAS3 pathway in rheumatoid arthritis. Autoimmun Rev. 2021;54(5):254–263.
- Lucafò M, Sicari D, Chicco A, et al. miR-331-3p is involved in glucocorticoid resistance reversion by rapamycin through suppression of the MAPK signaling pathway. Cancer Chemother Pharmacol. 2020;86(3):361–374.
- Ormseth MJ, Solus JF, Sheng Q, et al. Development and validation of a MicroRNA panel to differentiate between patients with rheumatoid arthritis or systemic lupus erythematosus and controls. J Rheumatol. 2020;47(2):188–196.
- Zu B, Liu L, Wang J, et al. MiR-140-3p inhibits the cell viability and promotes apoptosis of synovial fibroblasts in rheumatoid arthritis through targeting sirtuin 3. J Orthop Surg Res. 2021;16(1):105.
- Rudnicki M, Perco P, D Haene B, et al. Renal microRNA- and RNA-profiles in progressive chronic kidney disease. Eur J Clin Invest. 2016;46(3):213–226.
- Akbaba TH, Akkaya-Ulum YZ, Tavukcuoglu Z, et al. Inflammation-related differentially expressed common miRNAs in systemic autoinflammatory disorders patients can regulate the clinical course. Clin Exp Rheumatol. 2021;39(Suppl 132, 5):109–117.
- Guo J, Hao J, Jiang H, et al. Proteasome activator subunit 3 promotes pancreatic cancer growth via c-Myc-glycolysis signaling axis. Cancer Lett. 2017;386:161–167.
- Nikaido T, Shimada K, Shibata M, et al. Cloning and nucleotide sequence of cDNA for Ki antigen, a highly conserved nuclear protein detected with sera from patients with systemic lupus erythematosus. Clin Experim Immunol. 1990;79(2):209–214.
- Sun J, Luan Y, Xiang D, et al. The 11S proteasome subunit PSME3 is a positive feedforward regulator of NF-κB and important for host defense against bacterial pathogens. Cell Rep. 2016;14(4):737–749.
- Yan Q, Sharma-Kuinkel BK, Deshmukh H, et al. Dusp3 and Psme3 are associated with murine susceptibility to Staphylococcus aureus infection and human sepsis. PLoS Pathog. 2014;10(6):e1004149.
- Boulpicante M, Darrigrand R, Pierson A, et al. Tumors escape immunosurveillance by overexpressing the proteasome activator PSME3. Oncoimmunology. 2020;9(1):1761205.
- Cascio P. PA28γ: new insights on an ancient proteasome activator. Biomolecules. 2021;11(2):228.
- Alexopoulos E, Seron D, Hartley RB, et al. Lupus nephritis: correlation of interstitial cells with glomerular function. Kidney Int. 1990;37(1):100–109.
- Kim J, Jeong JH, Jung J, et al. Immunological characteristics and possible pathogenic role of urinary CD11c + macrophages in lupus nephritis. Rheumatol. 2020;59(8):2135–2145.