
Abstract
We elucidated the effect of four known T1D-susceptibility associated single nucleotide polymorphism (SNP) markers in three genes (rs12722495 and rs2104286 in IL2RA, rs689 in INS and rs2476601 in PTPN22) on CpG site methylation of their proximal promoters in different lymphocyte subsets using pyrosequencing. The study cohort comprised 25 children with newly diagnosed T1D and 25 matched healthy controls. The rs689 SNP was associated with methylation at four CpG sites in INS promoter: −234, −206, −102 and −69. At all four CpG sites, the susceptibility genotype AA was associated with a higher methylation level compared to the other genotypes. We also found an association between rs12722495 and methylation at CpG sites −373 and −356 in IL2RA promoter in B cells, where the risk genotype AA was associated with lower methylation level compared to the AG genotype. The other SNPs analyzed did not demonstrate significant associations with CpG site methylation in the examined genes. Additionally, we compared the methylation between children with T1D and controls, and found statistically significant methylation differences at CpG −135 in INS in CD8+ T cells (p = 0.034), where T1D patients had a slightly higher methylation compared to controls (87.3 ± 7.2 vs. 78.8 ± 8.9). At the other CpG sites analyzed, the methylation was similar. Our results not only confirm the association between INS methylation and rs689 discovered in earlier studies but also report this association in sorted immune cells. We also report an association between rs12722495 and IL2RA promoter methylation in B cells. These results suggest that at least part of the genetic effect of rs689 and rs12722495 on T1D pathogenesis may be conveyed by DNA methylation.
Introduction
Type 1 diabetes (T1D) results from immune-mediated damage of insulin-producing beta cells in the pancreas. CD4+ and CD8+ T cells and B cells are believed to have a pivotal role in this autoimmune response and many T1D susceptibility-associated single nucleotide polymorphisms (SNP) are located in genes expressed by these immune cells [Citation1]. Over 70 genetic loci have been associated with T1D susceptibility: the HLA region with the strongest impact and many non-HLA SNP markers with smaller effects [Citation2–4]. Unlike the HLA variants, relatively few non-HLA SNP markers reside within coding regions, and have a direct effect on protein structure, but rather appear to be enriched in enhancer regions [Citation3] and may thus affect gene expression levels [Citation5]. This is suggested by the associations of SNPs with CpG methylation [Citation6], which has an important role in gene expression regulation [Citation7].
Research indicates that epigenetic mechanisms, such as DNA methylation, have a role in the pathogenesis of many autoimmune diseases [Citation8,Citation9] and there are also indications that disease-associated SNPs can have an effect on methylation in nearby regions [Citation10]. In T1D, earlier studies have found associations between T1D-linked SNPs and CpG methylation both in wider analyses [Citation11,Citation12] and in targeted studies [Citation13,Citation14], where the affected CpG regions have often been situated close to the SNPs [Citation12,Citation15]. For example, associations have been reported between INS methylation and the rs689 SNP [Citation11,Citation12,Citation14] and IL2RA methylation and 28 SNPs situated close by [Citation13]. T1D-associated methylation differences have also been observed in studies comparing T1D cases and controls [Citation16,Citation17]. These comparisons and SNP analyses have mostly been performed with samples such as whole blood, cord blood and PBMC that contain a heterogeneous mixture of immune cells. Since methylation patterns may be cell population-specific, these differences could also result from differences in immune cell frequencies within the samples [Citation18].
In this study, we analyzed the association between four known T1D-susceptibility-associated SNP markers in three genes (rs12722495 and rs2104286 in IL2RA, rs689 in INS and rs2476601 in PTPN22) and CpG site methylation in their proximal gene promoters in three immune cell populations implicated in T1D pathogenesis: B cells and CD8+ and CD4+ T cells. Outside the HLA region, INS, PTPN22, and IL2RA are among the most important T1D susceptibility genes [Citation1]. Both IL2RA and PTPN22 have an important role in regulating immune cell activation and TCR-signaling, whereas INS expression by the thymic epithelial cells during T cell selection shapes the T cell compartment by pruning autoreactive T cells. Outside the thymus, INS is only expressed in beta cells, where it is likely an important target for CD8+ T cells during autoimmunity. We also compared the methylation status of these three genes between immune cells from children with T1D and age- and sex-matched healthy controls.
Materials and methods
Study subjects
The study cohort comprised 25 case subjects with newly diagnosed T1D (mean age 7.5 ± 3.7; 1.6–14.5 years; sampled within 6 days after clinical diagnosis) and 25 healthy autoantibody-negative control subjects (mean age 7.3 ± 3.9; 1.1–14.4 years) matched based on HLA class II genotype, gender, age, and date of sampling. The T1D diagnosis was performed according to the criteria of the American Diabetes Association (ADA) [Citation19]. Blood samples were collected as a part of the Finnish Type 1 Diabetes Prediction and Prevention (DIPP) study at the Turku University Hospital. For this project, T1D subjects were chosen based on the availability of a blood sample taken at the time of the T1D diagnosis and availability of a sample from a suitable control subject. All study subjects were male and all had HLA genotypes associated with increased risk of developing T1D: 28 subjects carried the HLA-DR3-DQ2/HLA-DR4-DQ8 genotype and 22 subjects HLA-DR4-DQ8/x genotype, where x was any haplotype other than HLA-DR3-DQ2 or HLA-DR4-DQ8. The T1D-associated autoantibodies to insulin (IAA), glutamic acid decarboxylase 65 (GADA), and islet antigen-2 (IA–2A) were analyzed with specific radio-binding assays as previously described [Citation20]. The samples were collected between 1999 and 2016 and the PBMCs isolated from blood by gradient centrifugation were stored in a viable state at −135 °C until analyses. The study was originally approved by the Ethics Committee of the Hospital District of Southwest Finland, followed by the Ethics Committee of the Hospital District of Northern Ostrobothnia, and written informed consent was provided by the families participating in the study.
Genotyping
HLA class II genotype for the major T1D risk alleles was determined, as previously described [Citation21]. The subjects were also genotyped for four T1D-susceptibility-associated SNP markers in three genes: IL2RA (rs12722495, rs2104286), INS (rs689), and PTPN22 (rs2476601). The SNP markers were genotyped using TaqMan SNP Genotyping Assays according to the manufacturer’s instructions (Thermo Fisher Scientific, Waltham, Massachusetts, USA).
Isolation of B cells and CD4+ and CD8+ T cells
Frozen PBMC samples were thawed and the cells were rested overnight in a culture medium at +37 °C. Surface staining of the cells was performed the next day with antibodies to CD3 (APC-F750, Biolegend), CD4 (PE-Cy7, Biolegend), CD8 (FITC, Biolegend), CD20 (PE-CF594, BD), CD127 (APC, Biolegend), CD25 (PE, Miltenyi) and CD45RO (AF700, Biolegend). Dead cells were excluded by 7-AAD (Biolegend) staining. B cells (CD20+), CD8+ T cells (CD3 + CD8+) and CD4+ T cells (CD3 + CD4 + CD25lowCD127+) were isolated using flow cytometric sorting (FACSAria III, BD Biosciences, USA). After sorting the cell pellets were frozen and stored at −80 °C.
Isolation of genomic DNA and bisulfite conversion
DNA was extracted from the cell pellets with a NucleoSpin Tissue Kit (Macherey-Nagel, Germany) and genomic DNA was then treated with EZ DNA Methylation-Gold Kit (Zymo Research Corporation, California, USA), according to the manufacturer’s protocol.
Pyrosequencing
DNA methylation was examined with pyrosequencing at seven CpG sites within the IL2RA promoter (−459, −456, −373, −356, −272, −241 and −134), six CpG sites within the INS promoter (-234, −206, −180, −135, −102 and −69) and six CpG sites within the PTPN22 promoter (-558, −546, −288, −164, −96 and −68). PCR- and pyrosequencing primers and assays were designed with the PyroMark Assay Design Software 2.0 (Qiagen, Hilden, Germany). Pyrosequencing was performed using a PyroMark Q24 pyrosequencing instrument (Qiagen) and results were analyzed with PyroMark Q24 Advanced software (Qiagen).
Briefly, after bisulfite conversion, DNA was PCR-amplified (primer sequences in Supplementary Table 1). Biotin-labeled single-stranded amplicons were subsequently purified with the PyroMark Q24 Vacuum Workstation (Qiagen) according to the manufacturer’s protocol. After this, quantitative pyrosequencing was performed using the PyroMark Q24 pyrosequencing instrument (Qiagen). The methylation percentage for each of the CpG sites was calculated using PyroMark Q24 Advanced software (Qiagen).
Statistical analysis
Statistical analyses were performed using IBM SPSS Statistics 27.0 software (Armonk, New York, USA). Methylation levels were compared between SNP genotypes, and cases and controls at variably methylated CpG sites. These were defined as CpG sites with more than a 5 percentage point difference between the second highest and second lowest value. This cut-off value was chosen based on earlier studies observing that quantitative differences as low as 5% can be reliably detected with pyrosequencing [Citation22]. Methylation was compared between the different cell subsets using a non-parametric Kruskal-Wallis H test. Posthoc analyses were performed to examine differences between the groups. Methylation between the SNP genotypes, and cases and controls, was compared using the non-parametric Mann-Whitney U-test. The p values from the analyses were corrected for multiple comparisons using the Benjamini-Hochberg method. After correction, results with p values <0.05 were considered statistically significant. For the SNP analyses, the AT and TT genotypes in rs689 and the AG and AA genotypes in rs2476601 were grouped together. The genotype counts for the analyzed SNPs are shown in Supplementary Table 2.
Results
We used pyrosequencing to analyze DNA methylation in IL2RA, INS and PTPN22 promoters (analyzed CpG sites are shown in Supplementary Figure 1) in three sorted immune cell populations, CD4+ and CD8+ T cells and B cells, in 25 case subjects with newly diagnosed T1D and in 25 healthy autoantibody-negative control subjects matched based on HLA class II genotype, age and date of sampling.
Cell population-specific DNA methylation patterns
DNA methylation patterns within the analyzed gene promoters in sorted immune cell subsets are shown in . Within the IL2RA promoter () methylation differed between the cell subsets at six out of the seven analyzed CpG sites: −459 (p = 2.11E-15), −456 (p = 2.11E-15), −373 (p = 0.00E + 00), −356 (p = 0.00E + 00), −272 (p = 4.05E-4) and −241 (p = 0.00E + 00), but the methylation differences were rather small, with only B cells clearly differentiated from the other subsets at three CpG sites: −373 (B cells 49% methylated, CD8+ T cells 30% and CD4+ T cells 31%), −356 (18%, 4% and 5%) and −241 (8%, 2% and 2%).
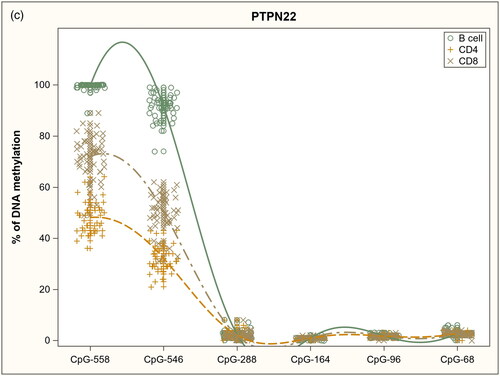
Figure 1. DNA methylation profiles in sorted immune cell subsets in analyzed gene promoters: a) IL2RA, b) INS and c) PTPN22.

Similarly, within the INS promoter (), methylation differences between the cell subsets were small. Methylation differed between the subsets at three CpG sites: −135 (p = 1.04E-2), −102 (p = 5.43E-6), and −69 (p = 2.04E-4), where CD8+ T cells had only slightly lower methylation levels compared to the other subsets.
Within the PTPN22 promoter (), methylation at CpG sites −558 (p = 0.00E + 00) and −546 (p = 0.00E + 00) varied considerably between all three cell subsets. By contrast at CpG sites −288, −164, −96, and −68 methylation was low in all cell subsets.
In summary, we observed cell subset-specific DNA methylation patterns in other analyzed gene promoters except for the INS gene where quite similar distributions in methylation were seen in all cell populations.
Influence of SNP genotypes on CpG methylation
We compared methylation levels between individuals carrying different T1D susceptibility-associated SNP markers at the specific promoter CpG sites where methylation variation in immune cell subsets was detected (). After correcting for multiple comparisons, we observed a statistically significant association between the rs689 SNP and four CpG sites within the INS gene promoter: −234, −206, −102 and −69. At CpG sites −234 and −206 the association was statistically significant in all analyzed subsets. At −102 the association was significant in CD4+ and CD8+ T cells but at CpG −69 only in CD4+ T cells. The susceptibility genotype AA was associated with higher methylation at all these CpG sites (). We also found an association between rs12722495 and methylation at CpG sites −373 and −356 within the IL2RA promoter in B cells (). At both CpG sites, the risk genotype AA was associated with lower methylation. The other analyzed SNPs did not demonstrate any statistically significant association with CpG site methylation in the examined genes. P values for all analyzed SNP-CpG-pairs are shown in Supplementary Table 3.
Figure 2. CpG sites where DNA methylation is associated with rs689 and rs12722495 genotypes.
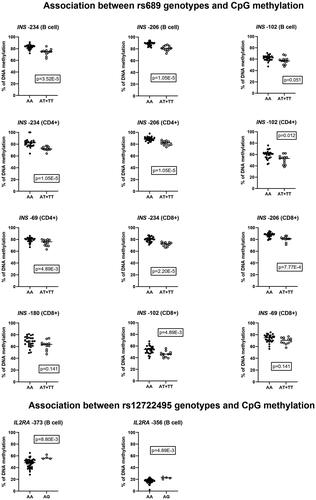
Table 1. Association between SNP markers and CpG site methylation: p values statistically significant before correcting for multiple comparisons, and the corrected p values.
Association between T1D and CpG methylation
Finally, we compared methylation levels between patients with T1D and matched healthy controls at CpG sites where methylation variation in lymphocyte subsets was detected. Differentially methylated CpG sites and their methylation levels are shown in . We found a statistically significant methylation difference at CpG −135 in INS in CD8+ T cells, in which patients with T1D had slightly higher methylation compared to controls (87.3 ± 7.2 vs. 78.8 ± 8.9). At other analyzed CpG sites the methylation level was similar between the groups. P values for all analyzed CpG sites are shown in Supplementary Table 4. Since there was an association between the rs689 SNP and INS promoter methylation (), we also separately compared the methylation level within these CpG sites between cases and controls carrying the susceptibility genotype (AA), but did not find any statistically significant differences after correcting for multiple comparisons.
Table 2. DNA methylation levels (%) in T1D patients and controls: results with significant p-values before correction, and their p values after correcting for multiple comparisons.
Discussion
In this study, we examined the association between four known T1D-susceptibility-associated SNP markers in three genes (rs12722495 and rs2104286 in IL2RA, rs689 in INS, and rs2476601 in PTPN22) and CpG site methylation in their proximal gene promoters. We also compared methylation between patients with T1D and matched healthy controls. The methylation analysis was carried out in sorted immune cell populations to avoid potential issues with heterogeneous samples, such as PBMCs. Analyzing a mixture of different cells can hide small methylation changes within the subsets or the methylation changes could result from differences in cell subset frequencies rather than differences within the subsets. We found an association between the rs689 SNP marker and DNA methylation at four CpG sites within the INS promoter: −234, −206, −102, and −69. At all four sites, the susceptibility genotype AA was associated with higher methylation. We also found a T1D-associated methylation difference at CpG −135 in INS in CD8+ T cells, where T1D patients had slightly higher methylation than controls.
The association between rs689 SNP and INS promoter methylation was first discovered by Fradin et al. [Citation14] who observed that the risk genotype was associated with higher methylation at four CpG sites (−206, −180, −102, and −69) in whole blood cell samples. This association was later confirmed in other studies, which also reported that, in addition to the proximal promoter, rs689 SNP seems to be associated with methylation at CpG sites further upstream [Citation11,Citation12]. There is also evidence for T1D-specific methylation changes in the INS promoter [Citation11,Citation14,Citation23]. Fradin et al. [Citation14] found a methylation difference between patients with T1D and controls at four CpG sites including CpG −135, which was observed to be differentially methylated also in our study. Carry et al. later confirmed the result for two of these sites and one additional CpG site [Citation11]. Interestingly, similar methylation changes have also been observed in blood [Citation14] and islet cells [Citation24] from patients with type 2 diabetes. Apart from the CpG site −135 in CD8+ T cells, we did not see any statistically significant differences between our cases and controls, but this difference compared to earlier reports could be due to our smaller study size.
Collectively the results from the current study and previous work indicate that there is an association between rs689 and INS gene methylation and also between T1D status and INS methylation but whether these associations have any functional role is still an open question. We know that demethylation at these CpG sites within the INS promoter is associated with INS gene expression. Kuroda et al. examined nine CpG sites in the human INS promoter and showed that they are unmethylated in the islet cell fraction of pancreas and methylated in the non-islet fraction [Citation25]. They also showed experimentally that methylation of these sites represses INS expression. Other studies have later confirmed such an inverse correlation [Citation24,Citation26] and observed other sites upstream that could also have an effect on the expression [Citation24,Citation27].
INS is expressed in pancreatic beta cells but also in the thymus during T-cell selection. Decreased expression of INS by thymic epithelial cells in individuals with the risk genotype could lead to autoreactive T cells escaping negative T-cell selection and thereby conferring a higher risk of beta-cell autoimmunity. The rs689 SNP is in linkage disequilibrium (LD) with the 5′ variable number tandem repeat (VNTR) polymorphism situated in the non-coding region in the INS gene [Citation28,Citation29], and the VNTR polymorphism has been associated with T1D risk and the susceptibility variant with lower expression of INS in the human thymus [Citation30].
We also found an association between the rs12722495 risk genotype and decreased methylation at CpG sites −373 and −356 within the IL2RA promoter in B cells. The rs2104286 risk genotype was not associated with IL2RA methylation and we did not find any T1D-associated methylation changes within the IL2RA promoter. Hypomethylation within the IL2RA promoter has earlier been associated with multiple sclerosis (MS) [Citation31] and autoimmune thyroid disease (AITD) [Citation32]. T1D-associated methylation differences in IL2RA have also been found at CpG sites −456 and −373, but more importantly, it was discovered that sixteen T1D-associated SNPs, including rs2104286, showed an association with methylation at CpG site −373 [Citation13]. Promoter methylation does seem to correlate inversely with IL2RA expression [Citation31,Citation33] and collectively, these results indicate that changes in DNA methylation could convey at least part of the effect of the rs12722495 SNP and that particularly methylation at CpG site −373 may be important.
We also analyzed methylation within the PTPN22 promoter but we did not find any methylation differences between rs2476601 genotypes, or between T1D cases and controls. There have only been a few studies examining PTPN22 methylation in a targeted manner and none regarding T1D status or rs2476601 genotype but PTPN22 promoter hypermethylation has been observed in Hashimoto thyroiditis [Citation34] and psoriasis [Citation35]. Methylation in the promoter at CpG sites −288, −164, −96, and −68 has previously been reported to correlate inversely with PTPN22 expression [Citation35] and now our findings indicate that DNA methylation levels at CpG sites −558 and −546 in PTPN22 promoter distinguish CD4+ and CD8+ T cells and B cells from each other and may indicate a transcription factor binding site in the promoter.
Broader methylation arrays combined with GWAS data have also found associations between T1D associated SNPs and DNA methylation [Citation11,Citation12,Citation15]. Using cord blood from newborn infants with risk genes for T1D, Kindt et al. [Citation15] found CpG sites where levels of methylation were associated with SNP mutations from all analyzed T1D susceptibility genes including INS, C1QTNF6, CDK4, CLEC16A, CTSH, PFKFB3, PSMG2, RGS1, SULT1A2 and UBASH3A. In another GWAS study, Ye et al. [Citation12] found 96 SNP-CpG pairs and in 5 of these loci, ITGB3, AFF3, PTPN2, CTSH, and CTLA4, DNA methylation seemed to mediate the genetic risk by affecting gene expression [Citation12]. Later Carry et al. [Citation11] examined associations between methylation and 13 T1D-associated SNPs using peripheral blood samples from 83 cases and 83 controls from the DAISY study. The Infinium Human Methylation 450K and EPIC beadchip data revealed 10 SNP-CpG pairs associated with two novel gene loci, GSDMB and IL27, and two loci discovered earlier: C1QTNF6 and INS [Citation11]. These results indicate that DNA methylation could mediate at least part of the effect of T1D susceptibility genes.
In addition to the effect of genetic variation, there are also other inter-individual variations in DNA methylation possibly caused by environmental factors. The role of DNA methylation in T1D development has been assessed in several studies and methylation changes preceding the T1D diagnosis [Citation16,Citation17] or autoantibody-positivity [Citation36] have been reported. These studies have been conducted with either whole blood or cord blood [Citation16], or with immune cell subsets purified from peripheral blood [Citation17,Citation36]. Of note, many discovered differentially methylated regions were cell subset-specific [Citation36].
In conclusion, we observed an association between rs689 and INS promoter methylation in sorted immune cells. We also found an association between rs12722495 and IL2RA promoter methylation in B cells. These findings are in line with earlier studies using whole blood and cord blood samples. Together with earlier reports, our current study suggests that at least part of the effect of rs689 and rs12722495 on T1D pathogenesis may be conveyed by DNA methylation. The cell subset-specific DNA methylation patterns we observed, underline how important it is to carefully consider the analyzed material in DNA methylation studies and to use sorted cell subsets when possible. Future case-control studies should also take genetic variation into account to make sure any methylation differences between cases and controls are not due to different distribution of T1D-risk genotypes.
Supplemental Material
Download Zip (84.5 KB)Acknowledgements
The authors thank Lovisa Reinius (Karolinska Institutet) and Marjo Haanperä (National Institute for Health and Welfare, THL) for their expertise and assistance with pyrosequencing. We are grateful to Anne Suominen (University of Turku) for her skillful technical assistance. We also give special thanks to Antti-Pekka Laine for assistance with the statistical analysis.
Disclosure statement
No potential conflict of interest was reported by the author(s).
Data availability statement
The datasets used and/or analyzed in the present study are not readily available due to data privacy regulations. Requests to access the datasets should be directed to DIPP Steering Committee, [email protected].
Additional information
Funding
References
- Robertson CC, Rich SS. Genetics of type 1 diabetes. Curr Opin Genet Dev. 2018;50:1–8.
- Barrett JC, Clayton D, Concannon P, et al. Genome-wide association study and meta-analysis finds over 40 loci affect risk of type 1 diabetes. Nat Genet. 2009;41(6):703–707.
- Onengut-Gumuscu S, Chen W-M, Burren O, et al. Fine mapping of type 1 diabetes susceptibility loci and evidence for colocalization of causal variants with lymphoid gene enhancers. Nat Genet. 2015;47(4):381–386.
- Robertson CC, Inshaw JRJ, Onengut-Gumuscu S, et al. Fine-mapping, trans-ancestral and genomic analyses identify causal variants, cells, genes and drug targets for type 1 diabetes. Nat Genet. 2021;53(7):962–971.
- Ram R, Morahan G. Effects of type 1 diabetes risk alleles on immune cell gene expression. Genes. 2017;8(6):167.
- Gaunt TR, Shihab HA, Hemani G, et al. Systematic identification of genetic influences on methylation across the human life course. Genome Biol. 2016;17(1):61.
- Jones PA. Functions of DNA methylation: islands, start sites, gene bodies and beyond. Nat Rev Genet. 2012;13(7):484–492.
- Hirai N, Watanabe M, Inoue N, et al. Association of IL6 gene methylation in peripheral blood cells with the development and prognosis of autoimmune thyroid diseases. Autoimmunity. 2019;52(7-8):251–255.
- Guimarães JR, Coêlho MdC, de Oliveira NFP. Contribution of DNA methylation to the pathogenesis of Sjögren’s syndrome: a review. Autoimmunity. 2022;55(4):215–222.
- Morita E, Watanabe M, Inoue N, et al. Methylation levels of the TNFA gene are different between graves’ and Hashimoto’s diseases and influenced by the TNFA polymorphism. Autoimmunity. 2018;51(3):118–125.
- Carry PM, Vanderlinden LA, Johnson RK, et al. DNA methylation near the INS gene is associated with INS genetic variation (rs689) and type 1 diabetes in the diabetes autoimmunity study in the young. Pediatr Diabetes. 2020;21(4):597–605.
- Ye J, Richardson TG, McArdle WL, et al. Identification of loci where DNA methylation potentially mediates genetic risk of type 1 diabetes. J Autoimmun. 2018;93:66–75.
- Belot M-P, Fradin D, Mai N, et al. CpG methylation changes within the IL2RA promoter in type 1 diabetes of childhood onset. PLOS One. 2013;8(7):e68093.
- Fradin D, Le Fur S, Mille C, et al. Association of the CpG methylation pattern of the proximal insulin gene promoter with type 1 diabetes. PLOS One. 2012;7(5):e36278.
- Kindt ASD, Fuerst RW, Knoop J, et al. Allele-specific methylation of type 1 diabetes susceptibility genes. J Autoimmun. 2018;89:63–74.
- Johnson RK, Vanderlinden LA, Dong F, et al. Longitudinal DNA methylation differences precede type 1 diabetes. Sci Rep. 2020;10(1):3721.
- Rakyan VK, Beyan H, Down TA, et al. Identification of type 1 diabetes–associated DNA methylation variable positions that precede disease diagnosis. PLOS Genet. 2011;7(9):e1002300.
- Reinius LE, Acevedo N, Joerink M, et al. Differential DNA methylation in purified human blood cells: implications for cell lineage and studies on disease susceptibility. PLOS One. 2012;7(7):e41361.
- American Diabetes Association. 2. Classification and diagnosis of diabetes: standards of medical care in diabetes—2021. Diabetes Care. 2020;44: S15–S33.
- Siljander HTA, Simell S, Hekkala A, et al. Predictive characteristics of diabetes-associated autoantibodies among children with HLA-conferred disease susceptibility in the general population. Diabetes. 2009;58(12):2835–2842.
- Ilonen J, Kiviniemi M, Lempainen J, et al. Genetic susceptibility to type 1 diabetes in childhood – estimation of HLA class II associated disease risk and class II effect in various phases of islet autoimmunity. Pediatr Diabetes. 2016;17 Suppl 22:8–16.
- Dejeux E, Audard V, Cavard C, et al. Rapid identification of promoter hypermethylation in hepatocellular carcinoma by pyrosequencing of etiologically homogeneous sample pools. J Mol Diagn. 2007;9(4):510–520.
- Mouzaki K, Kotanidou EP, Fragou A, et al. Insulin gene promoter methylation status in greek children and adolescents with type 1 diabetes. Biomed Rep. 2020;13(4):31.
- Yang BT, Dayeh TA, Kirkpatrick CL, et al. Insulin promoter DNA methylation correlates negatively with insulin gene expression and positively with HbA(1c) levels in human pancreatic islets. Diabetologia. 2011;54(2):360–367.
- Kuroda A, Rauch TA, Todorov I, et al. Insulin gene expression is regulated by DNA methylation. PLOS One. 2009;4(9):e6953.
- Husseiny MI, Kaye A, Zebadua E, et al. Tissue-specific methylation of human insulin gene and PCR assay for monitoring beta cell death. PLOS One. 2014;9(4):e94591.
- Neiman D, Moss J, Hecht M, et al. Islet cells share promoter hypomethylation independently of expression, but exhibit cell-type–specific methylation in enhancers. Proc Natl Acad Sci U S A. 2017;114(51):13525–13530.
- Barratt BJ, Payne F, Lowe CE, et al. Remapping the insulin gene/IDDM2 locus in type 1 diabetes. Diabetes. 2004;53(7):1884–1889.
- Vafiadis P, Bennett ST, Todd JA, et al. Insulin expression in human thymus is modulated by INS VNTR alleles at the IDDM2 locus. Nat Genet. 1997;15(3):289–292.
- Pugliese A, Zeller M, Fernandez A, Jr, et al. The insulin gene is transcribed in the human thymus and transcription levels correlate with allelic variation at the INS VNTR-lDDM2 susceptibility locus for type 1 diabetes. Nat Genet. 1997;15(3):293–297.
- Field J, Fox A, Jordan MA, et al. Interleukin-2 receptor-α proximal promoter hypomethylation is associated with multiple sclerosis. Genes Immun. 2017;18(2):59–66.
- Kyrgios I, Fragou A, Kotanidou EP, et al. DNA methylation analysis within the IL2RA gene promoter in youth with autoimmune thyroid disease. Eur J Clin Invest. 2020;50:e13199.
- Belot M-P, Castell A-L, Le Fur S, et al. Dynamic demethylation of the IL2RA promoter during in vitro CD4+ T cell activation in association with IL2RA expression. Epigenetics. 2018;13(5):459–472.
- Kyrgios I, Giza S, Fragou A, et al. DNA hypermethylation of PTPN22 gene promoter in children and adolescents with Hashimoto thyroiditis. J Endocrinol Invest. 2021;44(10):2131–2138.
- Chandra A, Senapati S, Roy S, et al. Epigenome-wide DNA methylation regulates cardinal pathological features of psoriasis. Clin Epigenetics. 2018;10(1):108.
- Starskaia I, Laajala E, Grönroos T, et al. Early DNA methylation changes in children developing beta cell autoimmunity at a young age. Diabetologia. 2022;65(5):844–860.