
Abstract
Autophagy is implicated in the pathogenesis of psoriasis. We aimed to identify autophagy-related biomarkers in psoriasis via an integrated bioinformatics approach. We downloaded the gene expression profiles of GSE30999 dataset, and the “limma” package was applied to identify differentially expressed genes (DEGs). Then, differentially expressed autophagy-related genes (DEARGs) were identified via integrating autophagy-related genes with DEGs. CytoHubba plugin was used for the identification of hub genes and verified by the GSE41662 dataset. Subsequently, a series of bioinformatics analyses were employed, including protein–protein interaction network, functional enrichment, spearman correlation, receiver operating characteristic, and immune infiltration analyses. One hundred and one DEARGs were identified, and seven DEARGs were identified as hub genes and verified using the GSE41662 dataset. These validated genes had good diagnostic value in distinguishing psoriasis lesions. Immune infiltration analysis indicated that ATG5, SQSTM1, EGFR, MAPK8, MAPK3, MYC, and PIK3C3 were correlated with infiltration of immune cells. Seven DEARGs, namely ATG5, SQSTM1, EGFR, MAPK8, MAPK3, MYC, and PIK3C3, may be involved in the pathogenesis of psoriasis, which expanded the understanding of the development of psoriasis and provided important clinical significance for treatment of this disease.
Introduction
Psoriasis is a recurrent, and prolonged skin disease that occurs widely worldwide, and brings a great burden to families and society [Citation1]. It has been related to the development of several diseases, including cardiometabolic syndrome, psoriatic arthritis, and depression. The aetiology of psoriasis is complex, which involves complex interactions among environment, immune system, and genetics [Citation2,Citation3]. Environmental factors, genetic background, and ethnicity have been indicated to influence the onset of psoriasis [Citation4]. Besides, both extrinsic risk factors (smoking, infection, vaccination, drugs, and mechanical stress) and intrinsic risk factors (mental stress, hypertension, dyslipidemia, diabetes, obesity, and metabolic syndrome) are associated with the exacerbation of psoriasis [Citation4]. Although lots of research have been employed to clarify the mechanisms and aetiologies, the exact pathology of psoriasis has not been fully understood. Therefore, it is important to develop novel and effective diagnostic methods to control the clinical symptoms of psoriasis.
Autophagy is a complex physiological process in eukaryotes responsible for the degradation of protein aggregates or dysfunctional organelles which is necessary for normal cell growth, development, and function [Citation5]. Dysregulated autophagy has been involved in multiple diseases, including multiple sclerosis, skin disease, arthritis, systemic lupus erythematosus, and cancer [Citation6,Citation7]. Impaired autophagy in psoriasis lesions (PLs) has been indicated to be associated with lysosomal dysfunction in the epidermis [Citation8]. Previous reports have demonstrated that decreased autophagy could influence psoriasis via regulation of immune cells [Citation9,Citation10]. Therefore, activation of autophagy may be a potential therapy in psoriasis [Citation11]. However, recent studies have reported several biomarkers and pathways involved in psoriasis via bioinformatics approach [Citation12,Citation13]. However, the diagnostic value of autophagy-related genes (ARGs) for psoriasis has not been revealed, and the potential mechanism of psoriasis still needs to be further investigated.
The purpose of this research was to screen ARGs of psoriasis via integrated bioinformatics analysis. Moreover, the CIBERSORT algorithm was used for the investigation of the correlation between immun e cells and hub genes. Our results may provide a novel perspective on the pathological mechanism of psoriasis.
Methods
Data collection and preprocessing
We obtained the gene expression matrix of psoriasis patients (GSE30999 and GSE41662 datasets) GEO database based on GPL 570 platform (Affymetrix Human Genome U133 Plus 2.0 Array). Before data analysis, the Affy package of R software was used to preprocess the gene expression data [Citation14]. Normalisation and background correction were carried out by “normalize-betweenarrays” function of R software. Principal component analysis (PCA) was performed to make sure the analysis was credible. Besides, we deleted probes with multiple genes. If genes correspond to multiple genes, the average value of probes was taken [Citation15]. The GSE30999 dataset contains 85 LS and 85 psoriasis nonlesion (NL). GSE41662 dataset contains 24 LS and 24 NL.
Identification of differentially expressed autophagy-related genes (DEARGs)
The “limma” package of R software was applied to obtain differentially expressed genes (DEGs) based on adjusted p < 0.05 and |log FC| >0.5 [Citation16,Citation17]. The volcano plot of DEGs was drawn using the “ggplot2” package. ARGs were collected from the Human Autophagy-dedicated Database (http://hamdb.scbdd.com/), and the overlapped genes among DEGs and ARGs were then identified as DEARGs. Then, the “heatmap” package was used to generate the heat map.
Enrichment analyses
The GO enrichment analysis includes molecular function (MF), biological process (BP), and cellular component (CC), and KEGG were carried out to further understand the biological functions of DEARGs. The “clusterProfiler” package was applied to visualise the results.
Identification and analysis of hub genes
We used the STRING online analysis tool to generate the protein–protein interaction (PPI) network of DEARGs to further analyse protein–protein interactions and protein functional associations [Citation18]. Subsequently, we utilised the Cytoscape software to further analyse and visualise the PPI network. Then, we utilised the CytoHubba plugin to identify hub genes according to three topological analysis algorithms, namely degree method scores (degree), closeness, and betweenness. Top 10 genes were picked out based on each algorithm, and the intersection genes were considered as the final hub genes. To evaluate the diagnostic value of hub genes, the areas under the curve (AUC) were measured by the pROC package [Citation19]. An AUC > 0.7 showed a good diagnostic value.
Assessment of immune infiltrating cells
The immune infiltrating cells were calculated using the CIBERSORT analysis tool. And the “vioplot” package was used to compare the immune cells infiltrating level between NL and LS groups.
Correlation analysis
We carried out the Spearman correlation analysis to assess the relationship between immune cells and hub genes and used the ggplot2 package to visualise the results. Statistical significance was set up p-value < 0.05.
Statistical analysis
GraphPad Prism software was applied to perform statistical analysis. Differential expression was compared using Student’s t-test, and statistical significance was set up p-value < 0.05.
Results
Identification of DEARGs in psoriasis
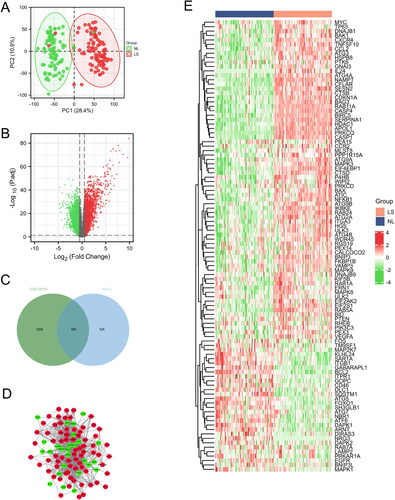
As shown in , NL and LS samples were separated, PCA result indicated the repeatability of data in the GSE30999 dataset. The volcano plot indicated that 7336 DEGs (4658 upregulated genes and 2678 down-regulated genes) were identified (). Then, we used the Veen tool to obtain 101 DEARGs (), and the PPI network and the clustering heatmap of DEARGs were presented in and , respectively, of which 27 were downregulated and 74 were upregulated.
Figure 1. Identification and analysis of DEARGs in the GSE30999 dataset. (A) PCA for GSE30999. (B) Volcano plot of the DEGs. (C) Venn diagram of the DEARGs in DEGs and ARGs. (D) The PPI network of the DEARGs, green and red, represent downregulated and upregulated genes, respectively. (E) Heatmaps of the DEARGs in the GSE30999 dataset.
Function analysis of the DEARGs
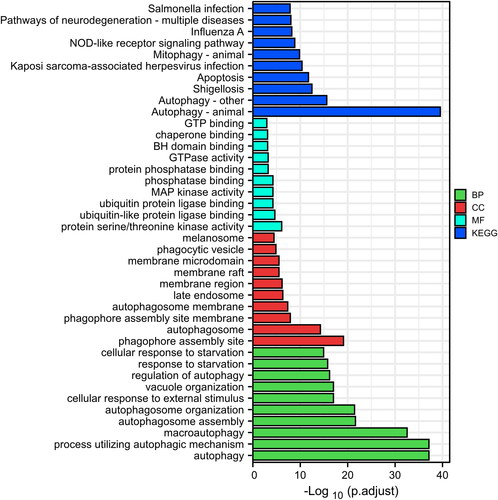
As presented in , for KEGG, DEARGs were mainly involved in autophagy, shigellosis, apoptosis, etc. For molecular function (MF), DEARGs were significantly enriched in ubiquitin-like protein ligase binding, protein serine/threonine kinase activity, MAP kinase activity, etc. In terms of cell component (CC), DEARGs were involved in phagophore assembly site membrane, phagophore assembly site, the autophagosome, etc. For biological processes (BP), DEARGs were involved in macroautophagy, a process utilising autophagic mechanism, autophagy, etc.
Figure 2. Functional analysis of the DEARGs.
Core DEARGs identification and analysis
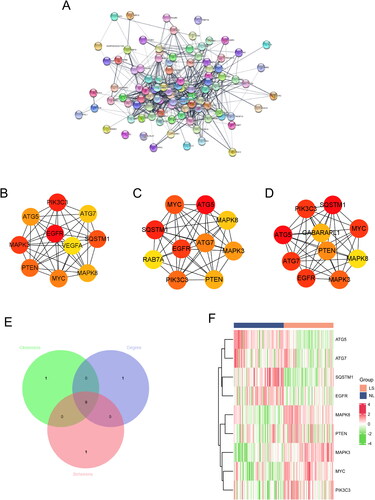
The 101 DEARGs in the GSE30999 dataset were selected for the PPI network construction to screening the potential hub genes (). Three classification methods (degree, closeness, and betweenness) in the CytoHubba plugin were used to identify core genes and the top ten 10 genes selected for further analysis ( and Supplementary Table 1). Subsequently, nine intersection genes were obtained by overlapping the top ten genes in three classification methods (). The mRNA expression levels of nine intersection DEARGs in the GSE30999 dataset were presented as a heatmap ( and Supplementary Table 2).
Figure 3. Identification of core DEARGs. (A) PPI network of DEARGs. Top 10 genes with the Highest betweenness (B), closeness (C), and degree (D). (E) Venn diagram of the overlapped genes. (F) Heatmaps of the 10 core DEARGs in the GSE30999 dataset.
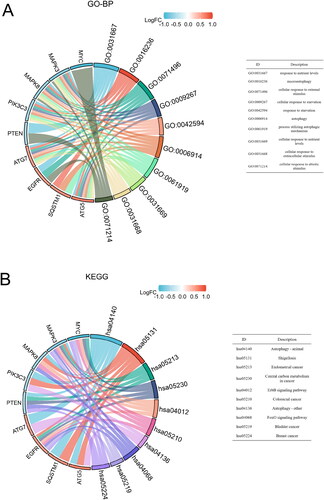
We also performed GO-BP and KEGG enrichment analysis of core DEARGs. For GO-BP, the nine core DEARGs were mainly enriched in cellular response to starvation, cellular response to external stimulus, response to nutrient levels, macroautophagy, autophagy, etc ( and Supplementary Table 3). For KEGG, the nine core DEARGs were significantly involved in autophagy–animal, shigellosis, endometrial cancer, central carbon metabolism in cancer, and ErbB signalling pathway, etc ( and Supplementary Table 4).
Figure 4. Function analysis of the 10 core DEARGs. (A) GO-BP enrichment analysis. (B) KEGG enrichment analysis.
Validation of the core DEARGs
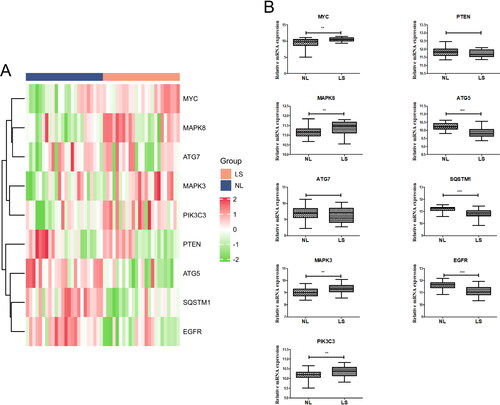
The core DEARGs gene expressions were verified via the GSE41662 dataset. As shown in , the expression levels of MYC, MAPK8, MAPK3, and PIK3C3 were significantly lower in NL than in LS (p < 0.05). The expression levels of ATG5, SQSTM1, and EGFR were significantly higher in NL than in LS (p < 0.05). However, the expression levels of PTEN and ATG7 indicated no difference between the NL and LS.
Figure 5. Validation of core genes. (A) Heatmaps of the 10 core DEARGs in the GSE41662 dataset. (B) mRNA expression of 10 core genes in the GSE41662 dataset.
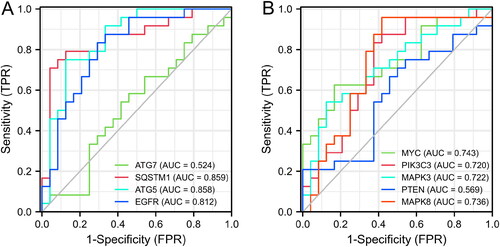
Besides, we constructed the ROC curves to assess the diagnostic values of core DEARGs. The AUC values of MYC, MAPK8, MAPK3, PIK3C3, ATG5, SQSTM1, and EGFR were all above 0.7, indicating that these genes could be used as indicators for psoriasis identification ().
Figure 6. Receiver operating characteristic (ROC) analysis of core genes.
The correlation analysis between core genes and immune infiltrating cells
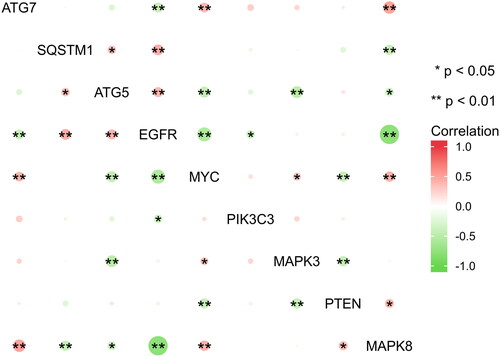
As shown in , correlation analysis revealed that MAPK8 was positively correlated with PTEN, MYC, and ATG7; MAPK8 was negatively correlated with EGFR, ATG5, and SQSTM1. PTEN was negatively correlated with MAPK3 and MYC. MAPK3 was positively correlated with MYC; MAPK3 was negatively correlated with ATG5. PIK3C3 was negatively correlated with EGFR. MYC was negatively correlated with EGFR and ATG5; MYC was positively correlated with ATG7. EGFR was positively correlated with ATG5 and SQSTM1; EGFR was negatively correlated with ATG7. ATG5 was negatively correlated with SQSTM1.
Figure 7. Correlation analysis of the 10 core DEARGs.
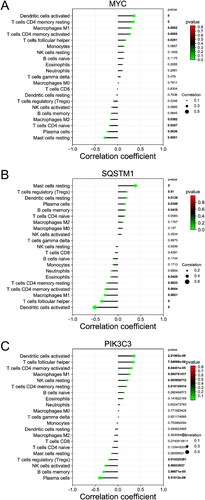
Besides, the proportions of B cells memory, plasma cells, T cells CD4 naïve, NK cells activated, dendritic cells resting, and Mast cells resting in NL patients were obviously higher than those in LS (p < 0.01). However, the proportions of T cells CD4 memory resting, T cells follicular helper, macrophages M1, and dendritic cells activated in NL patients were obviously lower than those in LS (p < 0.01) (). As shown in , ATG5 was positively correlated with dendritic cells resting, mast cells resting, B cells memory, and plasma cells; ATG5 was negatively correlated with dendritic cells activated, T cells CD4 memory activated, T cells follicular helper, Macrophages M1, and T cells CD4 memory resting. As shown in , EGFR was positively correlated with plasma cells, dendritic cells resting, T cells CD4 naive, B cells memory, and Mast cells resting; EGFR was negatively correlated with T cells gamma delta, Dendritic cells activated, Macrophages M1, T cells follicular helper, and T cells CD4 memory resting. As shown in , MAPK3 was positively correlated with Dendritic cells activated, T cells CD4 memory resting, T cells follicular helper, T cells CD4 memory activated, macrophages M1, neutrophils, and T cells CD8; MAPK3 was negatively correlated with T cells CD4 naive, B cells memory, plasma cells, dendritic cells resting, NK cells activated, and mast cells resting. As shown in , MAPK8 was positively correlated with Dendritic cells activated, T cells CD4 memory activated, T cells CD4 memory resting, Macrophages M1, T cells follicular helper, NK cells resting, and eosinophils; MAPK8 was negatively correlated with plasma cells, dendritic cells resting, B cells memory, mast cells resting, NK cells activated, T cells regulatory, and T cells CD4 naive. As shown in , MYC was positively correlated with Dendritic cells activated, T cells CD4 memory resting, macrophages M1, T cells CD4 memory activated, and T cells follicular helper; MYC was negatively correlated with Mast cells resting, plasma cells, T cells CD4 naive, and macrophages M2. As shown in , SQSTM1 was positively correlated with mast cells resting, T cells regulatory, dendritic cells resting, plasma cells, and B cells memory; SQSTM1 was negatively correlated with dendritic cells activated, T cells follicular helper, macrophages M1, T cells CD4 memory activated, T cells CD4 memory resting, and Eosinophils. As shown in , PIK3C3 was positively correlated with dendritic cells activated, T cells follicular helper, T cells CD4 memory activated, Macrophages M1, NK cells resting, and T cells CD4 memory resting; PIK3C3 was negatively correlated with Plasma cells, B cells memory, NK cells activated, and T cells regulatory.
Figure 8. Levels of immune cell fractions between NL and LS samples.
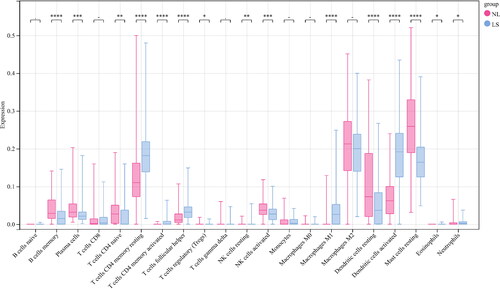
Figure 9. Correlation analysis between core genes and immune cells. (A) Correlation between immune cells and ATG5. (B) Correlation between immune cells and EGFR. (C) Correlation between immune cells and MAPK3. (D) Correlation between immune cells and MAPK8.
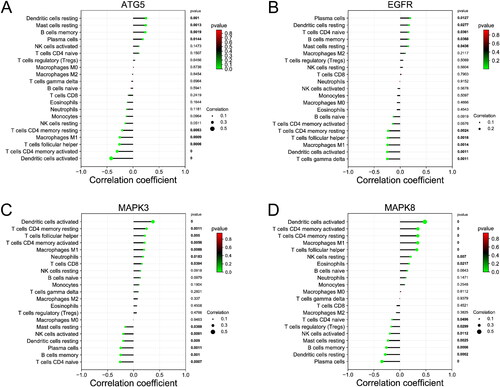
Figure 10. Correlation analysis between core genes and immune cells. (A) Correlation between immune cells and MYC. (B) Correlation between immune cells and SQSTM1. (C) Correlation between immune cells and PIK3C3.
Discussion
Autophagy has been implicated in autoimmune diseases, including psoriasis [Citation20]. Moreover, a previous study has demonstrated that modulators of autophagy might be developed as novel therapeutic drugs in the treatment of psoriasis [Citation10]. Bioinformatics analysis can identify diagnostic markers, offering potential biomarkers for human disease diagnosis and enhancing our understanding of disease pathogenesis [Citation21]. So far, few researchers have reported the ARGs and their correlation with immune cell infiltration in psoriasis. In our study, integrated bioinformatics analysis was performed to identify seven core DEARGs (ATG5, SQSTM1, EGFR, MAPK8, MAPK3, MYC, and PIK3C3) and reveal the immune infiltration landscape in psoriasis patients. In addition, the ROC curves of these genes showed larger AUCs, indicating their potential diagnostic value for psoriasis. As a result, this study deems these seven genes as significant and worthy of discussion.
Among the seven core DEARGs identified in the present study, ATG5 is an autophagy-related protein and involved in autophagosome formation and phagophore expansion [Citation22]. ATG5 also participated in autophagosomal membrane formation and played a vital role in tumour immunity and metabolism [Citation23]. ATG5 is an immunometabolic regulator in a dendritic cell against respiratory syncytial virus infection via controlling antiviral immunity [Citation24]. Moreover, ATG5-dependent autophagy plays an important role in psoriasis, and targeting ATG5 gene may be a potential therapy for psoriasis [Citation25]. SQSTM1, a ubiquitin-binding protein, participated in the regulation of various pathological processes, including autophagy [Citation26]. It has been reported that p62/SQSTM1 acted as a regulator and was associated with docosahexaenoic acid-induced autophagy [Citation27]. EGFR, a transmembrane receptor glycoprotein, previous studies revealed it is related to the pathological process of multiple diseases, such as cancer and psoriasis [Citation28,Citation29]. Besides, activation of EGFR causes cell angiogenesis and proliferation, while EGFR inhibitors are a potential therapeutic drug for psoriasis [Citation30]. Previous reports have indicated that the MAPK signalling pathway is associated with trichloroethene-induced autoimmune disease progression [Citation31]. The inactivation of the MAPK pathway is a potential mechanism for psoriasis [Citation32]. MYC gene is expressed during embryogenesis and associated with the regulation of cell death, cell metabolism, cell cycle, apoptosis, and cellular growth [Citation33]. Accumulating evidence has revealed that MYC is an important regulator of immune responses and metabolism [Citation34]. Moreover, MYC expression was significantly upregulated in psoriasis patients compared to healthy individuals [Citation35]. PIK3C3 has been involved in multiple cellular processes, such as phagocytosis, intracellular vesicular trafficking, endocytosis, and autophagosome formation [Citation36]. Emerging evidence has indicated that PIK3C3 plays an important role in CD4+ T cell-mediated EAE development and CD4+ T cell metabolism [Citation37]. In the present study, ROC curve analysis indicated that ATG5, SQSTM1, EGFR, MAPK8, MAPK3, MYC, and PIK3C3 genes could serve as promising biomarkers in psoriasis, as they were involving in several BPs, including autophagy. Therefore, studying autophagy can provide insight into the mechanisms underlying the development and progression of psoriasis, ultimately aiding in the prediction of disease status.
Autophagy has been reported to be involved in regulating immune cell subpopulations, such as natural killer cells, macrophages, dendritic cells, and T lymphocytes [Citation38]. The interaction between autophagy and immunity plays an important role in various diseases, including periodontitis, valvular atrial fibrillation, lower-grade glioma, and major depressive disorder [Citation39–43]. Previous study indicated that autophagy is associated with several autoimmune diseases, including psoriasis, rheumatoid arthritis, and systemic lupus erythematosus [Citation7]. However, no studies have explored the communicative functions of immune cell infiltration and autophagy in the development of psoriasis. Therefore, in order to improve the prognosis of psoriasis patients, the search for specific diagnostic markers and analysis of the pattern of immune cell infiltration in psoriasis have far-reaching implications. We performed a comprehensive evaluation of psoriasis immune infiltration using CIBERSORT to further investigate the role of immune cell infiltration in psoriasis. In the present study, our findings indicated that immune cell subpopulations (T cells follicular helper, T cells CD4 memory activated, T cells CD4 memory resting, B cells memory, Macrophages M1, Dendritic cells resting, Dendritic cells activated, and Mast cells resting) were significant difference between LS and NL patients. The finding of these immune cells infiltration is consistent with previous studies [Citation44,Citation45]. Besides, the correlation analysis results indicated that the expression of ATG5, SQSTM1, EGFR, MAPK8, MAPK3, MYC, and PIK3C3 was correlated with immune cells, which could imply an interaction between immunity and autophagy in psoriasis. Overall, a thorough comprehension of autophagy mechanisms can facilitate the progress toward the creation of effective diagnostic tools and targeted treatments for psoriasis.
However, there are some deficiencies in the present study. First, in vitro and in vivo experiments should be performed to verify the complex interaction between immune infiltration and DEARGs in psoriasis. Second, the relationship between disease severity and immune cells could not be estimated due to the lack of sufficient clinical information, such as disease activity status and disease phenotype.
In conclusion, seven core DEARGs (ATG5, SQSTM1, EGFR, MAPK8, MAPK3, MYC, and PIK3C3) were identified as potential biomarkers associated with psoriasis. Besides, various immune cell subpopulations are associated with psoriasis occurrence, and correlation analysis revealed that autophagy might be implicated in the immune disorder of psoriasis. Our results extended our understanding of autophagy in autoimmune diseases.
Ethics approval and consent to participate
Because GEO belongs to public databases, users can download relevant data for research and publish relevant papers. Therefore, the ethics approval and consent to participate was not applied for the present study.
Supplemental Material
Download MS Word (20.3 KB)Disclosure statement
All authors declared that they have no competing interests.
Data availability statement
Analysis data in the present study can be obtained from the corresponding author upon reasonable request. The datasets used in our study are available from the GEO database (https://www.ncbi.nlm.nih.gov/).
Additional information
Funding
References
- Griffiths CEM, Armstrong AW, Gudjonsson JE, et al. Psoriasis . Lancet . 2021;397(10281):1–12.
- Jabbari A, Johnson-Huang LM, Krueger JG. Role of the immune system and immunological circuits in psoriasis. Giornale italiano di dermatologia e venereologia: organo ufficiale. Societa Italiana di Dermatologia e Sifilografia. 2011;146(1):17–30.
- Boehncke WH, Schön MP. Psoriasis. Lancet. 2015;386(9997):983–994.
- Kamiya K, Kishimoto M, Sugai J, et al. Risk factors for the development of psoriasis. Int J Mol Sci. 2019;20(18):4347.
- Klionsky DJ, Emr SD. Autophagy as a regulated pathway of cellular degradation. Science. 2000;290(5497):1717–1721.
- Onorati AV, Dyczynski M, Ojha R, et al. Targeting autophagy in cancer. Cancer. 2018;124(16):3307–3318.
- Wu DJ, Adamopoulos IE. Autophagy and autoimmunity. Clin Immunol. 2017;176:55–62.
- Klapan K, Frangež Ž, Markov N, et al. Evidence for lysosomal dysfunction within the epidermis in psoriasis and atopic dermatitis. J Invest Dermatol. 2021;141(12):2838–2848.e4.
- Lu H, Kuang YH, Su J, et al. CD147 is highly expressed on peripheral blood neutrophils from patients with psoriasis and induces neutrophil chemotaxis. J Dermatol. 2010;37(12):1053–1056.
- Varshney P, Saini N. PI3K/AKT/mTOR activation and autophagy inhibition plays a key role in increased cholesterol during IL-17A mediated inflammatory response in psoriasis. Biochim Biophys Acta Mol Basis Dis. 2018;1864(5 Pt A):1795–1803.
- Hailfinger S, Schulze-Osthoff K. Impaired autophagy in psoriasis and atopic dermatitis: a new therapeutic target? J Invest Dermatol. 2021;141(12):2775–2777.
- Tang S, Jiang W, Xu P, et al. Integrated bioinformatic analysis of key biomarkers and signalling pathways in psoriasis. Scott Med J. 2022;67(1):7–17.
- Luo Y, Luo Y, Chang J, et al. Identification of candidate biomarkers and pathways associated with psoriasis using bioinformatics analysis. Hereditas. 2020;157(1):30.
- Gautier L, Cope L, Bolstad BM, et al. Affy–analysis of affymetrix GeneChip data at the probe level. Bioinformatics. 2004;20(3):307–315.
- Peng WF, Bai F, Shao K, et al. The key genes underlying pathophysiology association between the type 2-diabetic and colorectal cancer. J Cell Physiol. 2018;233(11):8551–8557.
- Chen F, Song J, Ye Z, et al. Integrated analysis of cell cycle-related and immunity-related biomarker signatures to improve the prognosis prediction of lung adenocarcinoma. Front Oncol. 2021;11:666826.
- Wang Z, Zhang M, Xu Y, et al. Identification of independent and communal differentially expressed genes as well as potential therapeutic targets in ischemic heart failure and Non-Ischemic heart failure. Pharmgenomics Pers Med. 2021;14:683–693.
- Szklarczyk D, Gable AL, Lyon D, et al. STRING v11: protein-protein association networks with increased coverage, supporting functional discovery in genome-wide experimental datasets. Nucleic Acids Res. 2019;47(D1):D607–D613.
- Robin X, Turck N, Hainard A, et al. pROC: an open-source package for R and S + to analyze and compare ROC curves. BMC Bioinform. 2011;12(1):77.
- Liu C, Gu L, Ding J, et al. Autophagy in skin barrier and immune-related skin diseases. J Dermatol. 2021;48(12):1827–1837.
- Moradi S, Tapak L, Afshar S. Identification of novel noninvasive diagnostics biomarkers in the parkinson’s diseases and improving the disease classification using support vector machine. Biomed Res Int. 2022;2022:5009892–5009898.
- Mizushima N, Yoshimori T, Ohsumi Y. The role of atg proteins in autophagosome formation. Annu Rev Cell Dev Biol. 2011;27(1):107–132.
- Xu C, Zang Y, Zhao Y, et al. Comprehensive Pan-cancer analysis confirmed that ATG5 promoted the maintenance of tumor metabolism and the occurrence of tumor immune escape. Front Oncol. 2021;11:652211.
- Oh DS, Park JH, Jung HE, et al. Autophagic protein ATG5 controls antiviral immunity via glycolytic reprogramming of dendritic cells against respiratory syncytial virus infection. Autophagy. 2021;17(9):2111–2127.
- Zhang Q, Shi H, Zhang J, et al. The paeonol target gene autophagy-related 5 has a potential therapeutic value in psoriasis treatment. PeerJ. 2021;9:e11278.
- Lamark T, Svenning S, Johansen T. Regulation of selective autophagy: the p62/SQSTM1 paradigm. Essays Biochem. 2017;61(6):609–624.
- Tan X, Zou L, Qin J, et al. SQSTM1/p62 is involved in docosahexaenoic acid-induced cellular autophagy in glioblastoma cell lines. In Vitro Cell Dev Biol Anim. 2019;55(9):703–712.
- Wu NL, Huang DY, Hsieh SL, et al. EGFR-driven up-regulation of decoy receptor 3 in keratinocytes contributes to the pathogenesis of psoriasis. Biochim Biophys Acta. 2013;1832(10):1538–1548.
- Normanno N, De Luca A, Bianco C, et al. Epidermal growth factor receptor (EGFR) signaling in cancer. Gene. 2006;366(1):2–16.
- Petch D, Anderson RJ, Cunningham A, et al. Design and synthesis of EGFR dimerization inhibitors and evaluation of their potential in the treatment of psoriasis. Bioorg Med Chem. 2012;20(19):5901–5914.
- Banerjee N, Wang H, Wang G, et al. Redox-sensitive Nrf2 and MAPK signaling pathways contribute to trichloroethene-mediated autoimmune disease progression. Toxicology. 2021;457:152804.
- Xu F, Xu J, Xiong X, et al. Salidroside inhibits MAPK, NF-κB, and STAT3 pathways in psoriasis-associated oxidative stress via SIRT1 activation. Redox Rep. 2019;24(1):70–74.
- Dang CV. c-Myc target genes involved in cell growth, apoptosis, and metabolism. Mol Cell Biol. 1999;19(1):1–11.
- Gnanaprakasam JN, Wang R. MYC in regulating immunity: metabolism and beyond. Genes (Basel). 2017;8(3):88.
- Osterland CK, Wilkinson RD, St Louis EA. Expression of c-myc protein in skin and synovium in psoriasis and psoriatic arthritis. Clin Exp Rheumatol. 1990;8(2):145–150.
- Yang G, Song W, Postoak JL, et al. Autophagy-related protein PIK3C3/VPS34 controls T cell metabolism and function. Autophagy. 2021;17(5):1193–1204.
- Yang G, Van Kaer L. PIK3C3/VPS34 links T-cell autophagy to autoimmunity. Cell Death Dis. 2020;11(5):334.
- Gerada C, Ryan KM. Autophagy, the innate immune response and cancer. Mol Oncol. 2020;14(9):1913–1929.
- Münz C. Enhancing immunity through autophagy. Annu Rev Immunol. 2009;27(1):423–449.
- Zhang X, Jin Y, Wang Q, et al. Autophagy-mediated regulation patterns contribute to the alterations of the immune microenvironment in periodontitis. Aging (Albany NY). 2020;13(1):555–577.
- He S, Deng Z, Li Z, et al. Signatures of 4 autophagy-related genes as diagnostic markers of MDD and their correlation with immune infiltration. J Affect Disord. 2021;295:11–20.
- Liu A, Jia K, Liang H, et al. Comprehensive analysis of autophagy-related genes and patterns of immune cell infiltration in valvular atrial fibrillation. BMC Cardiovasc Disord. 2021;21(1):132.
- Lin T, Cheng H, Liu D, et al. A novel six autophagy-related genes signature associated with outcomes and immune microenvironment in lower-grade glioma. Front Genet. 2021;12:698284.
- Clark RA, Kupper TS. Misbehaving macrophages in the pathogenesis of psoriasis. J Clin Invest. 2006;116(8):2084–2087.
- Chen J, Zhu Z, Li Q, et al. Neutrophils enhance cutaneous vascular dilation and permeability to aggravate psoriasis by releasing matrix metallopeptidase 9. J Invest Dermatol. 2021;141(4):787–799.