
 ?Mathematical formulae have been encoded as MathML and are displayed in this HTML version using MathJax in order to improve their display. Uncheck the box to turn MathJax off. This feature requires Javascript. Click on a formula to zoom.
Abstract
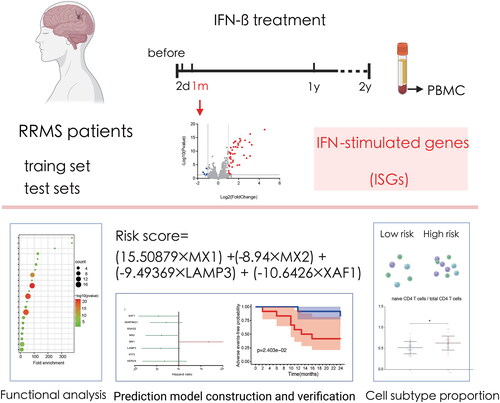
Interferon-beta (IFN-) is one of the classical drugs for immunomodulatory therapy in relapsing-remitting multiple sclerosis (RRMS) patients, but the drug responsiveness of different patients varies. Currently, there is no valid model to predict IFN-
responsiveness. This research attempted to develop an IFN-
responsiveness prediction model based on mRNA expression in RRMS patient peripheral blood mononuclear cells. Peripheral blood mononuclear cell mRNA expression datasets including 50 RRMS patients receiving IFN-
treatment were obtained from GEO. Among the datasets, 24 cases from GSE24427 were included in a training set, and 18 and 9 cases from GSE19285 and GSE33464, respectively, were adopted as two independent test sets. In the training set, blood samples were collected immediately before first, second, month 1, 12, and 24 IFN-
injection, and the mRNA expression data at four time points, namely, two days, one month, one year and two years after the onset of IFN-
treatment, were compared with pre-treatment data to identify IFN-stimulated genes (ISGs). The ISGs at the one-month time point were used to construct the drug responsiveness prediction model. Next, the drug responsiveness model was verified in the two independent test sets to examine the performance of the model in predicting drug responsiveness. Finally, we used CIBERSORTx to estimate the content of cell subtypes in samples and evaluated whether differences in the proportions of cell subtypes were related to differences in IFN-
responsiveness. Among the four time points, one month was the time point when the training set GSE24427 and test set GSE33464 had the highest number of ISGs. Functional analysis showed that these one-month ISGs were enriched in biological functions such as the innate immune response, type-I interferon signalling pathway, and other IFN-
-associated functions. Based on these ISGs, we obtained a four-factor prediction model for IFN-
responsiveness including MX1, MX2, XAF1, and LAMP3. In addition, the model demonstrated favourable predictive performance within the training set and two external test sets. A higher proportion of activated NK cells and lower naive CD4/total CD4 ratio might indicate better drug responsiveness. This research developed a polygene-based biomarker model that could predict RRMS patient IFN-
responsiveness in the early treatment period. This model could probably help doctors screen out patients who would not benefit from IFN-
treatment early and determine whether a current treatment plan should be continued.
Graphical Abstract
1. Introduction
Relapsing-remitting multiple sclerosis (RRMS) is a common autoimmune disease of the central nervous system, and its clinical manifestations alternate between relapse and remittance [Citation1]. Since the neural functional disorder caused by disease relapse each time is partially irreversible, patients might experience serious neural functional disorders after suffering from relapse many times [Citation2]. Therefore, a main focus of MS treatment is reducing the number of relapses and extending the relapse interval in patients. As an immunomodulatory therapy used to prevent relapse in RRMS, interferon (IFN)- has a history of more than 30 years, and was once used as a first-line treatment option, but is now not the most widely used drug because it is not as effective, on average, as other disease-modifying treatments, such as newer forms of IFN, monoclonal antibodies, and oral medications [Citation3,Citation4]. Responsiveness to this drug varies significantly among patients, and it has been reported that approximately 30% to 50% of patients may not respond to the drug [Citation5,Citation6]. The mechanism underlying poor drug responsiveness has not yet been clarified but is probably related to neutralising antibodies (NAbs) [Citation7,Citation8]. However, depending on factors such as the specific MS subtype, severity of disease, side effect profile, and therapeutic goals, IFN-
may still be preferred in some cases, especially for women considering pregnancy, breastfeeding, and older patients [Citation9–11]. Currently, patients with a poor treatment response cannot be screened out before therapy or in the early therapy phase. Therefore, for a long time, researchers have been attempting to identify biomarkers that can predict the responsiveness of RRMS patients to IFN-
treatment and guide individual patients’ adoption of IFN-
treatment [Citation12–15].
In recent years, an increasing number of post-injection predictive biomarkers in predicting the IFN treatment response in the plasma or cerebrospinal fluid have been discovered and reported, such as NAbs, myxovirus resistance protein (Mx) A or Mx1, and NLRP3 [Citation16–20]. However, the specificity of these biomarkers in predicting the treatment response of individual patients is limited. The construction of prognostic prediction models by integrating multiple biomarkers has been shown to be effective in many diseases [Citation21–23]. At the same time, the timing of biomarker assessment is also a key but unclear factor [Citation24,Citation25]. Although some studies found that the peak mRNA levels of MxA and other IFN- therapy-related genes in the plasma occurred within 6-12 h after IFN-
injection, the classification of MS patients based on the MxA expression level at this time point could not effectively predict the risk of recurrence after IFN-
therapy [Citation26,Citation27]. We hypothesised that IFN-
may have some long-term pharmacological effects on the body in addition to this short-term response, so more time points need to be tested. This research evaluated mononuclear cell gene expression in peripheral blood before and after IFN-
treatment of RRMS patients. By comparing the mRNA expression data at different time points following IFN-
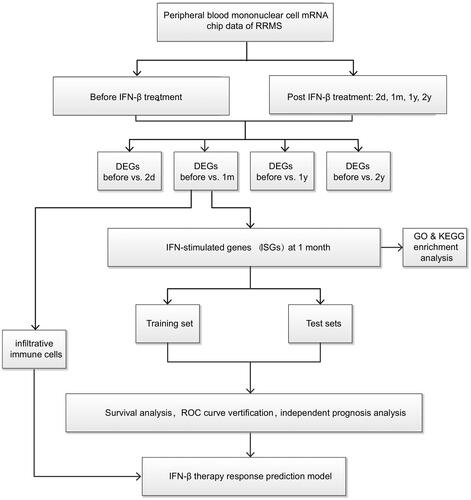
treatment with data collected before treatment, we identified differentially genes, namely, IFN- stimulated genes (ISGs), at different time points after treatment administration to define the optimal detection window after a drug response. Then, the ISGs in the optimal time window were used to build a drug response prediction model, which was verified with two mutually independent and external datasets. The flow chart is shown in .
Figure 1. Flowchart of the development of an IFN- responsiveness prediction model based on the mRNA expression level of RRMS patients’peripheral blood mononuclear cells. DEGs, differential expressed genes.
2. Materials and methods
2.1. Selection and collection of peripheral blood mononuclear cell expression datasets from RRMS patients
The GEO database (https://www.ncbi.nlm.nih.gov/gds) was used for gene chip collection, and relevant chip datasets, including GSE24427 [Citation28], GSE19285 [Citation29], and GSE33464 [Citation30], were downloaded under the keyword “relapsing-remitting multiple sclerosis”. All three GSE studies were from same lab. The peripheral blood mononuclear cell gene expression chip data for RRMS patients aged 23 years old to 63 years old who at least regularly received IFN- treatment for two years, or received IFN-
treatment for one year and had not relapsed within the following year, and finished two years of follow-up visit were chosen from the aforementioned datasets. These datasets included expression data collected before and one month after the onset of IFN-
treatment and contained clinical data for relapse during the two follow-up years and Expanded Disability Status Scale (EDSS) score changes.
We included 24 peripheral blood mononuclear cell specimens from RRMS patients receiving IFN- in GSE24427. Among these patients, 16 were females, and 8 were males; their average age was 40 years old. Gene expression data for five time points including before treatment and 2 days, 1 month, 1 year, and 2 years after the onset of IFN-
treatment were chosen. We included 18 peripheral blood mononuclear cell specimens from RRMS patients receiving IFN-
treatment in GSE19285. Among these patients, 13 were females, and 5 were males; their average age was 37 years old. The gene expression data collected before treatment and 1 month after the onset of treatment were chosen (no data for one year and two years after administration). We included 9 peripheral blood mononuclear cell specimens from RRMS patients receiving IFN-
treatment in GSE33464. Among these patients, 5 were females, and 4 were males; their average age was 39 years old. The gene expression data for four time points including before treatment and 1 month, 1 year, and 2 years after the treatment were chosen. Detailed clinical information of the RRMS patients in the training and test sets is presented in Table S1.
2.2. Screening of ISGs and gene ontology (GO) functional enrichment and Kyoto encyclopedia of genes and gnomes (KEGG) signalling pathway analyses
GSE24427 was adopted as the training set. Using the limma package [Citation31], we compared the gene expression data of patients at 2 days, 1 month, 1 year, and 2 years after IFN- treatment, respectively, with the pre-treatment data to obtain ISG lists at 4 different time points after treatment. The screening standard was p < 0.05 and fold change (FC) −2 to 2. STRING was used to establish the network of interactions among the ISG proteins. Enrichment of ISG gene clusters and signalling pathways was realised through DAVID (https://david.ncifcrf.gov/home.jsp) [Citation32]. Specifically, under the background of anthropogenic genes, GO functional enrichment and KEGG signalling pathways were analysed.
2.3. Screening of key genes related to the response of RRMS patients to IFN- treatment
Twenty-four RRMS patients in GSE24427 were defined as the training set. Seventeen MS patients in GSE19285 and 9 MS patients in GSE33464 were defined as test set 1 and test set 2, respectively. The training set was used to construct the IFN- treatment response prediction model. The test set was used to verify the predictive performance of the response prediction model. The ISGs of RRMS patients were combined with the adverse response occurrence data and clinical rating changes of 24 patients. Patients who had adverse event, including relapse event, an EDSS score increase of
(if baseline EDSS
) or
(if baseline EDSS
) [Citation33] within two years of IFN-
treatment were defined as poor response to treatment, otherwise defined as good response to treatment. The R software “survival” function package was adopted for single-factor Cox analysis and to screen out genes related to patients’ treatment responses. Next, the results obtained by single-factor Cox analysis were included in a LASSO regression analysis. LASSO regression, through construction of the regression coefficient of the penalty function towards independent variables, thus produced a stronger correlation with the RRMS patients’ IFN-
treatment response data. Next, multifactor Cox analysis was conducted on the genes obtained through the LASSO regression analysis, and the key genes related to patients’ treatment responses were identified.
2.4. Construction of the IFN- response prediction model for RRMS patients in the training set
The regression coefficients of key factors related to treatment response were identified through LASSO and Cox regression analyses. In this way, the IFN- treatment response prediction model for the training set could be built, in which the response value equals
1Exp1 +
2Exp2+……
nExpn.
Exp denotes the expression of a gene, “” denotes the regression coefficient in the multifactor Cox regression analysis of genes, and “n” denotes the gene dosage related to patient prognosis. The response value of each case in the training set could be computed with this formula. Then, the median of the response value was set as the cut-off value. According to the cut-off value, patients in the training set were divided into good and poor responsiveness groups. The “survival” package of R software was used to carry out exacerbation- and progression-free survival analysis of the good and poor responsiveness group. Additionally, the “Survival ROC” package was used to draw the receiver operating characteristic (ROC) curve and obtain an assessment of the predictive performance of the response prediction model.
2.5. Single-factor and multifactor prognostic analyses
Patient clinical information such as age, sex, baseline EDSS score before treatment, and relapse times before treatment were included. Then, the response rating was combined for single-factor and multi-factor Cox analyses to assess the impacts of clinical factors on the response rating.
2.6. Verification of the IFN- response prediction model for RRMS patients with the test sets
To test the accuracy of the treatment response prediction model, the risk values of 24 cases were calculated with the response prediction model built on the training set. The median of the risk value was adopted as the cut-off value, and the patients in the test set were divided into good and poor responsiveness groups. The R software “survival” package was adopted for Kaplan-Meier survival analysis of the high- and low-risk groups. The “survival ROC” package was used to draw the ROC curve to assess the performance of the response prediction model.
2.7. Subtype analysis of the proportions of mononuclear cells
To characterise the abundances of mononuclear cell subtypes based on RNA-seq data for blood, the CIBERSORTx (https://cibersortx.stanford.edu/) [Citation34] web tool was applied. Using a deconvolution algorithm, CIBERSORTx computed the levels of different cell types. CIBERSORTx derived an empirical p-value for the deconvolution of each case using Monte Carlo sampling, and samples with p < 0.05 were adopted for analysis because of the high reliability of the inferred cell composition. Therefore, cases with a p-value were not retained for subsequent analysis. To validate the accuracy of the CIBERSORTx data, the Tumour Immune Estimation Resource (TIMER) database was also employed to calculate the abundances of immune cells. Subsequently, box plots were utilised to present the differences in infiltrating immune cells, T cell activating and inhibitory receptors, and macrophage-associated molecules between the high- and low-risk groups using the “ggplot2” package.
2.8. Statistical analysis
All statistical analyses were conducted using R (version 4.0.3). The Wilcoxon test was used to screen significantly differentially expressed genes and infiltrating immune cells. Kaplan-Meier curves and the log-rank test were used to evaluate the statistical significance of differences in survival rates between risk groups. The predictive accuracy of risk signatures was determined with ROC curves. The proportional hazards assumption was tested with Schoenfeld residuals. Then, univariate and multivariate Cox regression analyses were performed to evaluate significant prognostic factors. Finally, the results of multivariate Cox regression analyses were visualised with a nomogram. A p-value < 0.05 was considered statistically significant.
3. Results
3.1. The best time point for prediction of the IFN- treatment response in RRMS patients
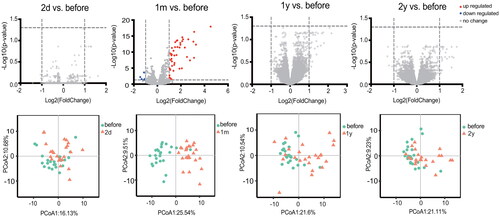
RRMS patients in the training set, GSE24427, had the largest number of ISGs after being treated with IFN- for one month. ISGs were evaluated after treatment with IFN-
at four time points, which identified 0 (2 days), 53 (1 month), 0 (1 year), and 0 (2 years) ISGs at the different time points (). PCA showing the percentage variability captured by the first two principal components is displayed across PC1 and 2. The analysis plot also revealed a distinct separation before and after IFN-
treatment for 1 month. In the test set GSE33464, the similar trend were detected (Figure S1). The GSE19285 dataset was not included in this analysis because it does not have data collected at two days, one year or two years after treatment. The above results indicated that one month after patients started receiving treatment seemed to be a good window to test the IFN-
treatment response.
Figure 2. Gene expression at different time points in RRMS patients’ peripheral blood mononuclear cells following IFN- treatment in the training set. Volcano maps and PCA showed that several genes altered significantly in patients at one month of treatment.
3.2. Protein-protein interaction network of ISGs and gene function analysis
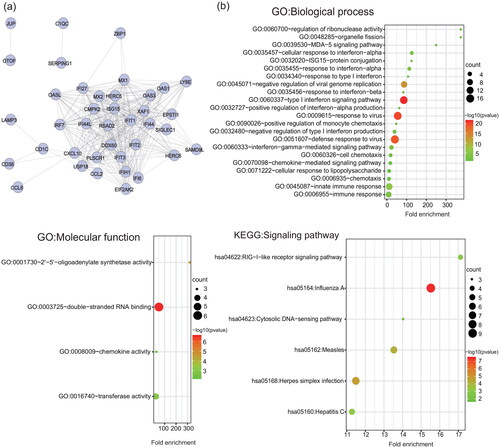
Fifty-three ISGs were detected at one month after the onset of IFN- therapy (Table S2). Functional analysis suggested that ISGs detected at one month after treatment were mainly enriched in the cellular response to type I interferon, response to virus, response to other organisms, response to biotic stimulus, etc. (, Table S3).
Figure 3. Protein-protein interaction network and functional analysis of ISGs detected at one month after the onset of IFN- therapy. (a) The network of interactions among the ISG proteins. Each node represents a protein. Disconnected nodes are not shown. (b) GO functional (biological process and molecular function) and KEGG signalling pathway enrichment analysis of ISGs. The bubble size and colour correlate with the number of ISGs and the significance of the p-value, respectively.
3.3. Construction of the IFN- treatment response prediction model with the data for RRMS patients in the training set
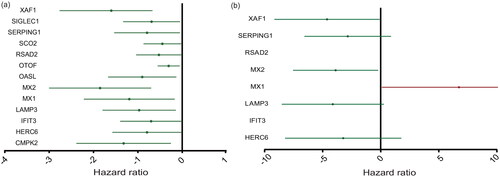
Single-factor Cox regression analysis of the training set indicated that 13 ISGs induced by IFN- were related to prognosis after IFN-
treatment. The 13 ISGs were CMPK2, HERC6, IFIT3, LAMP3, MX1, MX2, OASL, OTOF, RSAD2, SCO2, SERPING1, SIGLEC1, and XAF1 (). Then, LASSO and multifactor Cox regression analyses revealed that three genes, namely, MX1, MX2, and XAF1, were key genes related to the IFN-
treatment response (p < 0.05) and that these three genes could be adopted as independent prognostic factors. Increasing expression of MX1 was an indicator of a poor response, whereas increasing expression of MX2 and XAF1 was an indicator of a good response. In addition, the multifactor analysis yielded a p-value of 0.066 for LAMP3, which we included in the rating formula to improve the applicability of the formula. Finally, we constructed a predictive model for IFN-
treatment in RRMS patients consisting of four key prognosis-related genes using LASSO and Cox regression models. The risk score was written as “(15.50879
MX1) + (-8.94
MX2) + (-9.49369
LAMP3) + (-10.6426
XAF1)” (, Table S4).
Figure 4. The expression level of ISGs associated with the prognosis of RRMS patients. (a) Single-factor Cox regression analysis. (b) Multifactor Cox regression analyses. The four ISGs obtained by constructing the prognostic model shown in the forest map, red indicates high-risk gene and green denotes low-risk genes.
3.4. Verification of the RRMS patient IFN- treatment response prediction model with the training set and test sets
The risk score of each patient could be calculated with the formula, and the median of the risk score was adopted as the cut-off value, with the risk score based on the onset or progression of adverse events. The 24 cases in the training set, GSE24427, were divided into a high-risk group (12 cases) and low-risk group (12 cases). The clinical information of high-risk and low-risk group were shown in Table S5. The risk score and adverse events-free time corresponding to each sample and the expression value of each gene are shown in . Kaplan-Meier survival curve analysis demonstrated that the median time of adverse events in the high-risk group was significantly earlier than that in the low-risk group (p = 0.024) (). ROC curve analysis of the predictive performance for adverse events within 2 years of the responsiveness prediction model showed that the area under the curve for adverse event in MS patients within 2 years was 70.80% (), indicating that the model could be used to predict responsiveness to IFN- treatment.
Figure 5. Adverse events-free survival analysis and verification of IFN- treatment response prediction model. (a) The risk score and adverse events-free status distribution of training set (GSE24427) and test sets (GSE19285 and GSE33464). (b) Adverse events-free survival analysis curves of patients in the high- and low-risk group in training set and test sets. (c) ROC curves of the predictive performance for exacerbation and progression within 2 years of the responsiveness prediction model of training set and test sets.
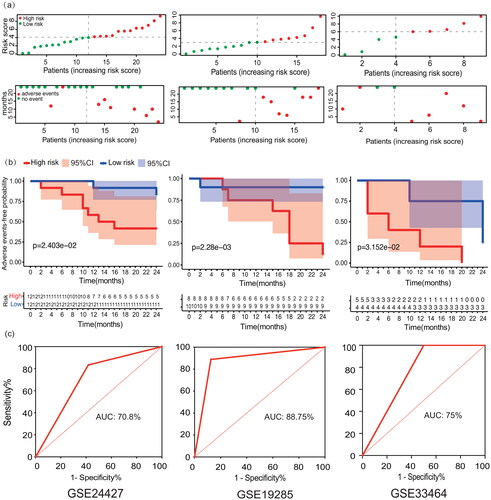
Next, we verified the prediction model in the test sets. The 18 cases in test set 1, GSE19285, were divided into a high-risk group (8 cases) and low-risk group (10 cases). The 9 cases in test set 2, GSE33464, were divided into a high-risk group (5 cases) and low-risk group (4 cases). The median time of adverse events in the high-risk group was significantly earlier than that in the low-risk group in both sets (p = 0.002, p = 0.032) (). ROC curve analysis showed that the area under the curve for adverse events in MS patients within 2 years was 88.75% and 75%, respectively (). The model was proved to be effective in predicting the response to IFN- treatment.
3.5. Single-factor and multifactor prognostic analyses
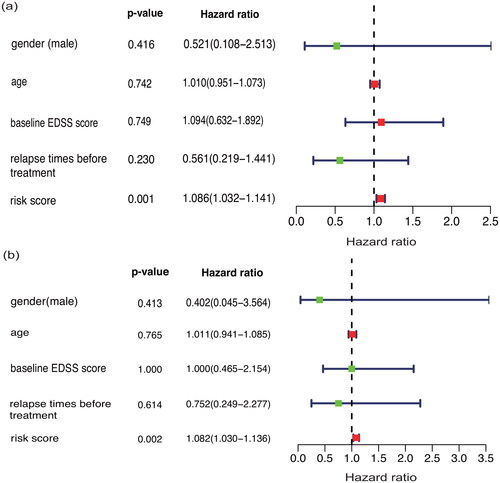
Considering that age, gender, baseline EDSS score and relapse times before treatment might also affect patients’ response to IFN- treatment, this research included the above variables in the IFN-
treatment response prediction model described above. The proposed response prediction model could still predict the response of patients to IFN-
treatment. This finding was verified in single-factor and multifactor Cox models (p < 0.01) ().
Figure 6. Single-factor (a) and multifactor (b) prognostic analyses of other demographic or clinical data of the patients.
3.6. Correlations between the IFN- response score and proportions of mononuclear cell subtypes
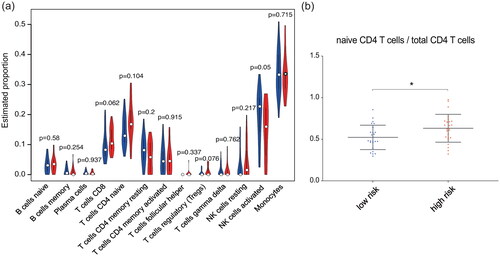
We combined the training set and test set data, used the classification of the high- and low-risk samples in the previous survival analysis and divided the 50 samples into a high-risk group containing 25 cases and a low-risk group containing 25 cases. As shown by the violin plot in , the abundances of mononuclear subtypes determined by using CIBERSORTx did not show much difference between the high-risk and low-risk group. There might have been a tendency for the proportion of activated NK cells in the high-risk group to be lower than that in the low-risk group (p = 0.05). However, it is worth noting that the proportion of naive CD4 T cells in the total CD4 T cell population was different between the high- and low-risk groups. Given the background that the overall number of CD4 T cells remained almost constant, the proportion of naive CD4 T cells in the total CD4 T cell population in the high-risk group was greater than that in the low-risk group (p = 0.018) ().
Figure 7. Correlations between the IFN- response score and proportions of mononuclear cell subtypes. (a) Violin plot of the abundances of mononuclear subtypes between the high-risk (blue) and low-risk (red) groups. (b) The abundances of naive CD4 T cells in the total CD4 T cell population between the high- and low-risk groups.
4. Discussion
There are actually multiple disease-modifying therapies available today for the treatment of relapsing MS, however the development of a predictive model of IFN- reactivity could make the drug still an important first-line treatment option. In this study, we carried out a predictive study of the response to IFN-
in a group of RRMS patients by comparing gene expression in peripheral blood mononuclear cells at different post-treatment times with respect to the time prior to the start of treatment. Several genes more altered in patients at one month of treatment, with no change at two days, 1 year, and 2 years post-treatment. Previous studies have described changes in gene expression in MS patients following interferon therapy. Serrano et al. identified differentially expressed genes at four time points during a 1-year period in MS patients receiving IFN-
therapy [Citation35]. Samples were collected from patients receiving IFN-
treatment before, 2 days, 1 month, and 1 year after treatment. The 15 IFN response genes, including MX1 and XAF1, were differentially expressed at all time points, and the gene expression of most patients reached the highest at 1 month after treatment. Another study examined gene expression in peripheral blood mononuclear cells of seven MS patients at baseline as well as 3 months after IFN-
-1a treatment, the gene expression changes became less pronounced, suggesting a steady-state response to IFN-
[Citation36]. The above results are consistent with our findings. In addition, by studying the most altered genes, we made a predicitive analysis that allows us to identify patients with high and low risk of not being good responders to IFN-
. The scaling of high and low risk is not observed with other demographic or clinical data of the patients.
We found that one month after the onset of IFN- treatment seemed to be a good time point to identify early-stage prediction indexes for IFN-
treatment responsiveness. The experiment revealed that the largest number of differentially expressed genes appeared one month after the onset of IFN-
treatment instead of 2 days. The same phenomena could also be observed in the test set (GSE33464). These probably indicate that the immune processes involved in ISGs in peripheral blood mononuclear cells at one month of IFN-
treatment are more complex. At one year and two years, we found that the number of ISGs was reduced again, which probably indicated that the ISGs originated from temporary physiological processes, or there is a feedback mechanism that ensures homeostasis. As a pleiotropic cell factor, IFN-
can affect relevant molecular models of multiple cells in response to external pathogenic stimulus reactions, such as various Toll like receptors, and affect some biological processes, such as immune cell autophagy [Citation37,Citation38]. In this study, the ISGs identified at the one-month time point were enriched in functions including double-stranded RNA binding, the antiviral response, and 2′-5′-oligoadenylate synthetase activity.
The Mx protein is a specific protein generated during the IFN- antiviral reaction that can inhibit virus transcription and is often regarded as a reaction-based biological indicator to assess IFN-
biological functions or patient responsiveness [Citation39]. Both MX1 and MX2 are IFN-inducible proteins but have different antiviral mechanisms and subcellular localisations, especially in autoimmune diseases such as MS. MX1 is mainly localised in the nucleus and associated with the nuclear membrane, where it exerts its antiviral activity by blocking the entry of viral ribonucleoproteins into the nucleus. MX2 is mainly located in the cytoplasm and associated with the intracellular membrane, where it exerts its antiviral activity by preventing viral ribonucleoproteins from entering the nucleus [Citation40]. In MS, immune processes occur mainly in the extra-nuclear, cytoplasmic and extra-cellular spaces within the central nervous system. The primary goal of MS treatment is not to directly target viruses but to modulate the immune system’s inflammatory response. Therefore, MX2, which is localised in the cytoplasm, may be more important in the treatment of MS.
It is worth noting that the biological effects of Mx can be blocked by anti-IFN- NAb, resulting in less effect [Citation41]. NAbs are one of the most recognised biological markers for the therapeutic effect of IFN-
treatment on RRMS and are related to the resistance of patients to IFN-
treatment. However, there are some problems in the clinical application of the Mx protein and NAb. One of the problems is that the baseline titre of NAb varies greatly among patients [Citation42]. In this way, the multiple-mRNA model we built in this study may help alleviate this problem. We comprehensively evaluated the mRNA transcripts of several genes (MX1, MX2, XAF1, and LAMP3) to improve the consistency of the predictive model when applied to different individuals. Furthermore, this study observed that low-level MX1 and high-level MX2 were positively correlated with patients’ drug responsiveness, which showed good agreement with previous studies on the correlations between MXs and IFN-
treatment [Citation43]. However, the predictive model of IFN-
treatment responsiveness proposed in this study involves the cooperative interaction of several genes, but may not be fully applicable to accurately predict a single gene for treatment responsiveness.
X-chromosome-linked inhibitor of apoptosis proteins associated factor 1 (XAF1) is a kind of apoptosis-promoting tumour inhibitor that has been extensively investigated in tumour-related disease research [Citation44]. Moreover, it has been reported that XAF1 can form a positive feedback link with IFN regulating factor-1 (IRF-1) to strengthen the role of IFN in vitro [Citation45]. In this research, we found that patients with good IFN- responsiveness had a higher level of XAF1. Accordingly, this paper speculated that the stronger XAF1 expression and mutual positive feedback of IRF-1 might be reasons for good IFN-
responsiveness. In addition, it is important to note that XAF-1 is an X chromosome-associated gene that may be copied more in females, and the role of XAF1 may be potentially related to the male/female ratio in each group. However, 70%-80% of X-linked genes are inactivated in females, maintaining similar levels of X-linked protein expression between the sexes [Citation46,Citation47]. Currently, we have found no relevant reports of gender differences in XAF1 [Citation48], but studies with larger samples are still needed to rule out potential gender effects. Lysosomal membrane protein 3 (LAMP3) is one of the membrane proteins related to lysosomes. LAMP1, LAMP2, and LAMP3 together are known as the products of cell reactions towards IFN-
[Citation49]. LAMP3 can activate cell apoptosis in response to autoimmune diseases, such as sicca syndrome, and is related to its autoantigen [Citation50]. However, the roles of LAMP3 in RRMS disease occurrence and development have not yet been reported. This research observed a positive correlation between an increase in LAMP3 levels and IFN-
treatment responsiveness, which indicated that enhanced expression of LAMP3 could benefit RRMS patients’ IFN-
treatment responsiveness.
We also tried to incorporate clinical factors into the IFN- treatment response prediction model, including gender, age, baseline disease severity degree, and relapse times before treatment. We found that none of these factors showed predictive power for IFN-
responsiveness. It is widely recognised that gender plays a role in the incidence and course of MS, but there is a lack of reports on gender differences in responsiveness to IFN-
therapy and Nab production in MS patients [Citation51]. However, in this research, although males showed a trend towards a lower risk of adverse events, it was not statistically significant. We believe this trend may not be instructive and may be related to the small sample size. Future studies with larger samples may help to deepen the understanding of gender differences in IFN-
therapy.
In addition, this study found that at one month after the initiation of IFN- therapy, there were differences in the proportions of mononuclear cell subtypes between the high and low IFN-
responsiveness prediction score groups. A higher proportion of activated NK cells and a lower naive CD4/total CD4 ratio showed correlations with better drug responsiveness. Since the proportion of total CD4 T cells did not change significantly, we speculated that IFN-
might promote the transformation of naive T cells into functional T cells without affecting the total number of CD4 T cells. The existence of this correlation indicated that the genes used in the responsiveness prediction model for IFN-β treatment might be involved in the changes in lymphocytes that occur after IFN-
treatment. Additionally, LAMP3 is closely related to dendritic cells and antigen-presenting functions [Citation52], which were not included in this study. More cell subtype studies are necessary in the future to predict IFN-
responsiveness.
Although IFN- is no longer the most widely used treatment for MS because it is not as effective on average as some of the other disease-modifying drugs, a subset of patients identified through the current approach could be very high responders. This study shows that the levels of several genes induced by IFN-
may predict future responses to IFN-
therapy in RRMS patients and may enhance the selection of drug responders. This topic has been studied extensively before, and the main originality of our study lies in the use of other longer experimental times. All three GSE studies were from same lab, the arrays may be identical and thus more reproducible and compatible. However, this study has several limitations: (a) the sample size of this study is limited, especially the limited sample of test set 2, so the prognostic model needs more data to be validated; (b) the data of this study are from public databases, so further experiments are still needed to investigate the clinical value of the model genes.
Author contributions
YX designed the research and collected data. YX and PY led the statistical analysis and imaging data process, contributing equally to the work. All authors contributed to interpretation of the data, preparation of the manuscript, and read and approved the final manuscript.
| Abbreviations | ||
| RRMS | = | Relapsing-remitting multiple sclerosis |
| IFN | = | interferon |
| NAbs | = | neutralising antibodies |
| Mx | = | myxovirus resistance protein |
| ISGs | = | IFN-stimulated genes |
| DEGs | = | differentially expressed genes |
| EDSS | = | Expanded Disability Status Scale |
| FC | = | fold change |
| GO | = | Gene Ontology |
| KEGG | = | Kyoto Encyclopaedia of Genes and Genomes |
| TIMER | = | the Tumour Immune Estimation Resource |
| ROC | = | receiver operating characteristic |
| LAMP3 | = | Lysosomal membrane protein 3 |
| XAF1 | = | X-chromosome-linked inhibitor of apoptosis proteins associated factor 1 |
| IRF-1 | = | IFN regulatory factor-1 |
Supplemental Material
Download Zip (2.4 MB)Disclosure statement
No potential conflict of interest was reported by the author(s).
Additional information
Funding
References
- Galea I, Ward-Abel N, Heesen C. Relapse in multiple sclerosis. BMJ. 2015;350(apr14 8):1h1765.
- Kalincik T. Multiple sclerosis relapses: epidemiology, outcomes and management. A systematic review. Neuroepidemiology. 2015;44(4):199–214.
- Freeman L, Longbrake EE, Coyle PK, et al. High-efficacy therapies for treatment-Naïve individuals with relapsing-remitting multiple sclerosis. CNS Drugs. 2022;36(12):1285–1299.
- Li H, Hu F, Zhang Y, et al. Comparative efficacy and acceptability of disease-modifying therapies in patients with relapsing-remitting multiple sclerosis: a systematic review and network meta-analysis. J Neurol. 2020;267(12):3489–3498.
- Huber AK, Duncker PC, Irani DN. The conundrum of interferon-β non-responsiveness in relapsing-remitting multiple sclerosis. Cytokine. 2015;74(2):228–236.
- Haji Abdolvahab M, Mofrad MR, Schellekens H. Interferon beta: from molecular level to therapeutic effects. Int Rev Cell Mol Biol. 2016;326:343–372.
- Hegen H, Millonig A, Bertolotto A, et al. Early detection of neutralizing antibodies to interferon-beta in multiple sclerosis patients: binding antibodies predict neutralizing antibody development. Mult Scler. 2014;20(5):577–587.
- Dujmovic I, Hegen H, Paz P, et al. Persistency of neutralizing anti-interferon-β antibodies in patients with multiple sclerosis treated with subcutaneous interferon-β depends on antibody titers, IgG subclasses, and affinity maturation. J Interferon Cytokine Res. 2017;37(7):317–324.
- Freedman MS, Coyle PK, Hellwig K, et al. Twenty years of subcutaneous interferon-Beta-1a for multiple sclerosis: contemporary perspectives. Neurol Ther. 2024;13(2):283–322.
- Ciplea AI, Langer-Gould A, Stahl A, et al. Safety of potential breast milk exposure to IFN-β or glatiramer acetate: one-year infant outcomes. Neurol Neuroimmunol Neuroinflamm. 2020;7(4):e757.
- Hellwig K, Geissbuehler Y, Sabidó M, et al. European interferon-beta pregnancy study group. Pregnancy outcomes in interferon-beta-exposed patients with multiple sclerosis: results from the European interferon-beta pregnancy registry. J Neurol. 2020;267(6):1715–1723.
- Paap BK, Hundeshagen A, Hecker M, et al. An inventory of short term and long term changes in gene expression under interferon β treatment of relapsing remitting MS patients. CPD. 2012;18(29):4475–4484.
- Jin T, Wang C, Tian S. Feature selection based on differentially correlated gene pairs reveals the mechanism of IFN-β therapy for multiple sclerosis. PeerJ. 2020;8:e8812.
- Croze E. Differential gene expression and translational approaches to identify biomarkers of interferon beta activity in multiple sclerosis. J Interferon Cytokine Res. 2010;30(10):743–749.
- Baranzini SE. Systems-based medicine approaches to understand and treat complex diseases. The example of multiple sclerosis. Autoimmunity. 2006;39(8):651–662.
- Matas E, Bau L, Martínez-Iniesta M, et al. Absence of MxA induction is related to a poor clinical response to interferon beta treatment in multiple sclerosis patients. J Neurol. 2016;263(4):722–729.
- Malhotra S, Río J, Urcelay E, et al. NLRP3 inflammasome is associated with the response to IFN-β in patients with multiple sclerosis. Brain. 2015;138(3):644–652.
- Pietrzak A, Kalinowska-Łyszczarz A, Osztynowicz K, et al. A long-term follow-up study on biochemical and clinical biomarkers of response to interferon beta-1b treatment in relapsing- remitting multiple sclerosis. Adv Clin Exp Med. 2020;29(7):841–851.
- Singh MK, Scott TF, LaFramboise WA, et al. Gene expression changes in peripheral blood mononuclear cells from multiple sclerosis patients undergoing beta-interferon therapy. J Neurol Sci. 2007;258(1–2):52–59.
- Sellebjerg F, Datta P, Larsen J, et al. Gene expression analysis of interferon-beta treatment in multiple sclerosis. Mult Scler. 2008;14(5):615–621.
- Rio J, Rovira A, Blanco Y, et al. Respuesta al tratamiento con interferon beta en pacientes con esclerosis multiple. Validacion del Rio Score [Response to treatment with interferon beta in patients with multiple sclerosis. Validation of the Rio Score]. Rev Neurol. 2016;63(4):145–150.
- Zhang M, Wang X, Chen X, et al. Novel immune-related gene signature for risk stratification and prognosis of survival in lower-Grade glioma. Front Genet. 2020;11(1):363.
- Xu X, Wu Y, Jia G, et al. A signature based on glycosyltransferase genes provides a promising tool for the prediction of prognosis and immunotherapy responsiveness in ovarian cancer. J Ovarian Res. 2023;16(1):5.
- Fukushima A, Sugimoto M, Hiwa S, et al. Elastic net-based prediction of IFN-β treatment response of patients with multiple sclerosis using time series microarray gene expression profiles. Sci Rep. 2019;9(1):1822.
- Gelati M, Corsini E, Dufour A, et al. Transmigration of PBMNCs from beta-IFN-1b-treated MS patients: a one-year longitudinal study. Autoimmunity. 2001;33(4):275–283.
- Garg N, Weinstock-Guttman B, Bhasi K, et al. An association between autoreactive antibodies and anti-interferon-β antibodies in multiple sclerosis. Mult Scler. 2007;13(7):895–899.
- Pachner AR, Dail D, Pak E, et al. The importance of measuring IFNbeta bioactivity: monitoring in MS patients and the effect of anti-IFNbeta antibodies. J Neuroimmunol. 2005;166(1–2):180–188.
- Goertsches RH, Hecker M, Koczan D, et al. Long-term genome-wide blood RNA expression profiles yield novel molecular response candidates for IFN-beta-1b treatment in relapsing remitting MS. Pharmacogenomics. 2010;11(2):147–161.
- Hecker M, Goertsches RH, Fatum C, et al. Network analysis of transcriptional regulation in response to intramuscular interferon-β-1a multiple sclerosis treatment. Pharmacogenomics J. 2012;12(2):134–146.
- Hecker M, Hartmann C, Kandulski O, et al. Interferon-beta therapy in multiple sclerosis: the short-term and long-term effects on the patients’ individual gene expression in peripheral blood. Mol Neurobiol. 2013;48(3):737–756.
- Smyth GK. Linear models and empirical bayes methods for assessing differential expression in microarray experiments. Stat Appl Genet Mol Biol. 2004;3(1):3–25.
- Sherman BT, Hao M, Qiu J, et al. DAVID: a web server for functional enrichment analysis and functional annotation of gene lists (2021 update). Nucleic Acids Res. 2022;50(W1):W216–W221.
- Steinman L, Fox E, Hartung HP, et al. Ublituximab versus teriflunomide in relapsing multiple sclerosis. N Engl J Med. 2022;387(8):704–714.
- Newman AM, Steen CB, Liu CL, et al. Determining cell type abundance and expression from bulk tissues with digital cytometry. Nat Biotechnol. 2019;37(7):773–782.
- Serrano-Fernández P, Möller S, Goertsches R, et al. Time course transcriptomics of IFNB1b drug therapy in multiple sclerosis. Autoimmunity. 2010;43(2):172–178.
- Annibali V, Di Giovanni S, Cannoni S, et al. Gene expression profiles reveal homeostatic dynamics during interferon-beta therapy in multiple sclerosis. Autoimmunity. 2007;40(1):16–22.
- Schmeisser H, Bekisz J, Zoon KC. New function of type I IFN: induction of autophagy. J Interferon Cytokine Res. 2014;34(2):71–78.
- Ejlerskov P, Rubinsztein DC, Pocock R. IFNB/interferon-β regulates autophagy via a MIR1-TBC1D15-RAB7 pathway. Autophagy. 2020;16(4):767–769.
- Sirisena DMKP, Tharuka MDN, Liyanage DS, et al. An interferon-induced GTP-binding protein, Mx, from the redlip mullet, liza haematocheila: deciphering its structural features and immune function. Fish Shellfish Immunol. 2020;96:279–289.
- Nakamura T, Asano A, Okano S, et al. Intracellular localization and antiviral property of canine Mx proteins. J Interferon Cytokine Res. 2005;25(3):169–173.
- Hesse D, Sellebjerg F, Sorensen PS. Absence of MxA induction by interferon beta in patients with MS reflects complete loss of bioactivity. Neurology. 2009;73(5):372–377.
- Hemmer B, Berthele A. Should we measure the bioavailability of interferon beta in vivo in patients with multiple sclerosis? Nat Clin Pract Neurol. 2012;19(10):1311–1317.
- Jensen PE, Sellebjerg F, Søndergaard HB, et al. Correlation between anti-interferon-β binding and neutralizing antibodies in interferon-β-treated multiple sclerosis patients. Euro J of Neurology. 2012;19(10):1311–1317.
- Jiang X, Yin L, Zhang N, et al. Bisphenol a induced male germ cell apoptosis via IFN β-XAF1-XIAP pathway in adult mice. Toxicol Appl Pharmacol. 2018;355:247–256.
- Jeong SI, Kim JW, Ko KP, et al. XAF1 forms a positive feedback loop with IRF-1 to drive apoptotic stress response and suppress tumorigenesis. Cell Death Dis. 2018;9(8):806.
- Talebizadeh Z, Simon SD, Butler MG. X chromosome gene expression in human tissues: male and female comparisons. Genomics. 2006;88(6):675–681.
- Fang H, Disteche CM, Berletch JB. X inactivation and escape: epigenetic and structural features. Front Cell Dev Biol. 2019;7:219.
- Jiang Z, Shao M, Dai X, et al. Identification of diagnostic biomarkers in systemic lupus erythematosus based on bioinformatics analysis and machine learning. Front Genet. 2022;13:865559.
- Suzuki J, Sakai J, Okada AA, et al. Oral administration of interferon-beta suppresses experimental autoimmune uveoretinitis. Graefes Arch Clin Exp Ophthalmol. 2002;240(4):314–321.
- Tanaka T, Warner BM, Odani T, et al. LAMP3 induces apoptosis and autoantigen release in Sjögren’s syndrome patients. Sci Rep. 2020;10(1):15169.
- Magyari M, Koch-Henriksen N, Laursen B, et al. Gender effects on treatment response to interferon-beta in multiple sclerosis. Acta Neurol Scand. 2014;130(6):374–379.
- Johansson P, Corripio-Miyar Y, Wang T, et al. Characterisation and expression analysis of the rainbow trout (Oncorhynchus mykiss) homologue of the human dendritic cell marker CD208/ lysosomal associated membrane protein 3. Dev Comp Immunol. 2012;37(3–4):402–413.