Abstract
Smoking conventional lit-end cigarettes results in exposure of nonsmokers to potentially harmful cigarette smoke constituents present in environmental tobacco smoke (ETS) generated by sidestream smoke emissions and exhaled mainstream smoke. ETS constituent concentrations generated by a conventional lit-end cigarette and a newly developed electrically heated cigarette smoking system (EHCSS) that produces only mainstream smoke and no sidestream smoke emissions were investigated in simulated “office” and “hospitality” environments with different levels of baseline indoor air quality. Smoking the EHCSS (International Organisation for Standardization yields: 5 mg tar, 0.3 mg nicotine, and 0.6 mg carbon monoxide) in simulated indoor environments resulted in significant reductions in ETS constituent concentrations compared to when smoking a representative lit-end cigarette (Marlboro: 6 mg tar, 0.5 mg nicotine, and 7 mg carbon monoxide). In direct comparisons, 24 of 29 measured smoke constituents (83%) showed mean reductions of greater than 90%, and 5 smoke constituents (17%) showed mean reductions between 80% and 90%. Gas–vapor phase ETS markers (nicotine and 3-ethenylpyridine) were reduced by an average of 97% (range 94–99%). Total respirable suspended particles, determined by online particle measurements and as gravimetric respirable suspended particles, were reduced by 90% (range 82–100%). The mean and standard deviation of the reduction of all constituents was 94 ± 4%, indicating that smoking the new EHCSS in simulated “office” and “hospitality” indoor environments resulted in substantial reductions of ETS constituents in indoor air.
Secondhand smoke, also known as environmental tobacco smoke (ETS), is a combination of the smoke emitted from the lit end of a conventional cigarette (CC) plus the smoke exhaled by the smoker (Baker & Proctor, Citation1990). Health agencies worldwide have concluded that exposure to secondhand smoke from cigarettes causes diseases including lung cancer and heart disease in adult nonsmokers, and is judged to be a risk factor for asthma, respiratory infections, cough, wheeze, otitis media (middle ear infection), and sudden infant death syndrome (SIDS) in children (California Environmental Protection Agency, Citation1997; U.S. Environmental Protection Agency, Citation1992; International Agency for Research on Cancer, Citation2004; U.S. Department of Health and Human Services, Citation2006). In addition, it has been concluded that secondhand smoke can exacerbate adult asthma and cause eye, throat, and nasal irritation (California Environmental Protection Agency, Citation1997; National Research Council, Citation1986; U.S. Department of Health and Human Services, Citation2006).
Indoor air quality (IAQ) can be negatively affected by the presence of ETS, and unacceptable IAQ has long been associated with the expression of discomfort or dissatisfaction of nonsmokers in environments where smoking occurs (Cain et al., Citation1987; Gunnarsen et al., Citation1991; Walker et al., Citation1997). The level of exposure to ETS in indoor environments is dependent on many factors. These can include the amount of smoking that takes place, the type of indoor environment (home, office, hospitality, etc.), the presence or absence of ventilation systems to remove or dilute ETS, and the time spent in the indoor environment. Over the past two decades, many studies have been conducted to investigate the levels of, and exposure to, ETS constituents in numerous environments (Jenkins et al., Citation2000).
In 2003, the World Health Organization (WHO) Scientific Advisory Committee on Tobacco Product Regulation (SACTob)Footnote1 specifically addressed the “Harm to Non-Users/Bystanders” of ETS exposure and the introduction of new tobacco products such as the electrically-heated cigarette smoking system (EHCSS). SACTob stated that “Many of the new products may claim reductions in generation of environmental tobacco smoke and there is clear reduction when shifting from burned tobacco products to products that heat rather than burn tobacco or to smokeless tobacco.” SACTob also supports the need for evaluation of emissions from new tobacco products under conditions of actual use including the determination of secondhand smoke emissions both quantitatively and qualitatively.
The technical concept of the EHCSS and the chemical and biological properties have been described in earlier publications (Patskan et al., Citation2003; Stabbert et al., Citation2003; Terpstra et al., Citation2003; Tewes et al., Citation2003). A distinct feature of the EHCSS is that it only produces mainstream smoke and no sidestream smoke is emitted. The objective of this investigation was to compare concentrations of well-established gas–vapor and particulate-phase ETS constituents, many of which are reputed to be potentially harmful ETS components, when smoking EHCSS or CC under conditions simulating indoor environments. For this purpose, two “real-world” scenarios were simulated (“office” and “hospitality” environments) in an environmentally controlled room with predetermined occupancy density and smoking rates. Ventilation rates were used to provide “low,” “medium,” and “high” IAQ conditions according to guidelines specified by the European Committee for Standardization [CEN] (CEN, 2004).
Methods
Study design
Two scenarios representing “office” and “hospitality” environments were simulated in an environmentally controlled room (size: 24.5 m2, 65 m3, length × width × height = 5.85 × 4.20 × 2.65 m). Different ventilation rates (36, 90, and 144 m3/h/person, respectively) were used to provide “low,” “medium,” and “high” IAQ for smoking environments as defined by the European ventilation performance standard CEN EN 13779 (CEN, 2004). Occupancy density was set to 12 and 1.5 m2/person with a smoking rate of 2 and 16 cigarettes/h for “office” and “hospitality” environments, respectively (ASHRAE, 2001, 2002). The study consisted of four simulations per cigarette type: three simulations of an “office” environment and one simulation in a “hospitality” environment (). Each of the 8 simulations lasted for 5 h. In the “office” simulations with two smokers, Smoker 1 started to smoke at the beginning of the simulation and continued to smoke 1 cigarette/h at intervals of 1 h between cigarettes. Smoking times for Smoker 2 started 30 min later. In the “hospitality” simulations, 8 smokers each smoked 1 cigarette every 30 min. Prior to each of the eight simulations, “background” sampling of the indoor air was performed for 4 h using the same ventilation conditions and no subjects present in the environmentally controlled room. At the beginning of the background session, the exposure room was flooded with carbon dioxide (CO2) up to a concentration of 1% and the decay rate of CO2 was determined to confirm the ventilation rate.
TABLE 1 Environmentally-controlled room setting and smoking conditionsa
An initial pilot study was performed using the CC to test whether ETS concentrations produced when smoking the CC under the “office” and “hospitality” simulations just described were in the range of “real-world” ETS constituent concentrations reported for both “office” and “hospitality” environments.
Subjects
Eight smokers (6 females, 2 males, age: 36–65 years) with a regular daily cigarette consumption of at least 20 cigarettes were recruited for participation in the study. The subjects were informed about the aims, sponsor, course of the study, and voluntary nature of their participation in both written and verbal form. All subjects were also informed about the possible health consequences of smoking. The subjects gave their written informed consent for their participation prior to the study commencing. Two subjects took part in all eight simulations and six subjects took part in only the two “hospitality” simulations. Before taking part in the simulations in which EHCSS was smoked, the subjects were familiarized with this new type of cigarette by smoking one to three EHCSS cigarettes under the instruction of the laboratory staff.
Test cigarettes
The EHCSS consists of a special cigarette containing conventional tobacco rolled into a tobacco mat, which is then overwrapped with a cigarette paper. This special cigarette is inserted into a battery-powered heater/lighter that heats the tobacco and minimizes burning during puffing. This design allows for greater control of the available heat resulting in lower temperatures (ca. 600°C) and less combustion of tobacco compared to conventional lit-end cigarettes (ca. 40 mg vs. 770 mg) (Patskan & Reininghaus, Citation2003). The EHCSS (5 mg tar, 0.3 mg nicotine, and 0.6 mg CO according to the International Standards Organization [ISO]) was used for simulations 1–4 and Marlboro (6 mg tar, 0.5 mg nicotine and 7 mg CO according to ISO) cigarettes for simulations 5–8.
Environmentally controlled room
The environmentally controlled room () was furnished with tables and chairs for eight persons, sideboards, and bookshelves. An electrical fan was used to circulate the indoor air. The supply indoor air was purified by sequentially passing through a particle filter and an activated carbon filter before entering the room through grids in three corners of the room. Three exhaust ducts in the ceiling removed air from the room. The room temperature was set to 22 ± 2°C by heating of the inlet air and by cooling elements mounted on the ceiling. The ventilation rate was controlled by electrical fans in the inlet and outlet air ducts of the room. Sampling traps were positioned near the breathing height of a seated person (110 cm above floor level) and connected with polyethylene tubes to 16 membrane sampling pumps. A particle analyzer was positioned close to the sampling traps. Indoor air for online measurement of CO2, CO, and NO/NO2 was drawn via a tube positioned at a height of 230 cm from the floor.
FIG. 1 Layout of the environmentally controlled room, seating for occupants, and location of online and offline sampling equipment.
Determination of indoor air constituents
The indoor air constituents measured online, instruments used, principle of the detection method, limit of detection (LOD), and precision of the measurements are summarized in . Outputs were recorded every 15 s with a data logger (21 × Micrologger, Campell, Scientific Ltd, Shepshed, Loughborough, UK). Temperature and relative humidity were recorded using a thermohydrograph (Wilhelm Lambrecht GmbH, Goettingen, Germany).
TABLE 2 Indoor air constituents measured onlinea
Eight sets of offline analyses () were performed in duplicate and the flow of each pump (KNF Neuberger GmbH, Freiburg, Germany) was adjusted by a needle valve and measured by a flow meter (0.2–2 L/min, EM-Technik GmbH, Maxdorf, Germany) placed upstream of the pump. The flow rates of the pumps were adjusted during sampling, if necessary. A bubble meter (Optiflow 650, Humonics, Rancho Cordova, CA) was used as the reference instrument. Indoor air constituents were determined according to the methods cited in , with modifications. The sampling time for all background sessions was 4 h. The sampling time for simulations 1 and 5 was 5 h, starting when smoking began. The sampling time for simulations 2–4 and 6–8 was 4 h, starting 1 h after smoking began.
TABLE 3 Indoor air constituents measured offlinea
Data treatment
For indoor environment simulations using both the EHCSS (simulations 1–4) and the CC (simulations 5–8), indoor air constituent measurements under the “background” and “smoking” periods correspond to the means of two duplicate samplings. The “net increase” ( through ) of the two cigarette types was calculated as the difference between the “smoking” and “background” periods. The “percent difference” between EHCSS and CC was estimated from the “net increase” values according to:
where EHCSS and CC are the “net increases” in an ETS constituent when smoking EHCSS or CC, respectively. Negative “net increase” values for the EHCSS, that is, “background” > “smoking,” were set to 0, corresponding to a percent difference value of −100%.
TABLE 4 Mean concentrations of indoor air constituents (“office” with “high” IAQ conditions)
Results
Both types of cigarettes were smoked in simulated “office” environments with “low,” “medium,” and “high” IAQ conditions and a simulated “hospitality” environment with “low” IAQ. The highest occupancy density (8 smokers) combined with the highest cigarette consumption (80 cigarettes/5 h) was represented in the “low” IAQ conditions used in “hospitality” simulations 4 and 8. Duplicate samples for each indoor air constituent determined were collected for 4 h during the “background” and “smoking” periods, except for simulations 1 and 5, where the sampling time started when smoking began. The ventilation rate was determined immediately before each “smoking” period, which lasted 5 h. Results of the measurements are reported in through 7.
“Office” with high “IAQ” conditions (simulations 1 and 5)
Results for both simulations using either EHCSS or CC are shown in . Two smokers smoked a total of either 10 EHCSS (simulation 1) or 10 CC (simulation 5). The target ventilation rate was 288 m3/h and the actual ventilation rates were 320 and 317 m3/h for simulations 1 and 5, respectively. In simulation 1, small increases were observed for the gas-phase ETS constituents, solanesol and 3-ethenylpyridine (3-EP), compared to background. Particulate matter expressed as 2,2′,4,4′-tetrahydroxybenzophenone (ultraviolet particulate patter [UVPM]-THBP) equivalents and fluorescence-based particulate matter (FPM) expressed as scopoletin (FPM-scopoletin) equivalents was also increased compared to background. In simulation 5, all ETS constituents increased versus background, and the increase in particles was about 10-fold above background.
“Office” with “medium” IAQ conditions (simulations 2 and 6)
Results for both simulations are shown in . Under this condition, two smokers smoked a total of either 10 EHCSS (simulation 2) or 10 CC (simulation 6). The target ventilation rate was 180 m3/h, while the actual ventilation rates were 200 and 215 m3/h for simulations 2 and 6, respectively. In simulation 2 while smoking EHCSS, small increases were observed for online particles, UVPM-THBP, FPM-scopoletin, solanesol, nicotine, toluene, phenanthrene, and pyrene compared to background. During simulation 6, all ETS constituents except CO2, NO, and NO2 were increased versus background. Increases, except for toluene, phenanthrene, and pyrene when compared to background, were about 10-fold lower in the EHCSS simulation compared to in the CC simulation.
TABLE 5 Mean concentrations of indoor air constituents (“office” with “medium” IAQ conditions)
“Office” with “low” IAQ conditions (simulations 3 and 7)
Results for both simulations using either EHCSS or CC are shown in . During these simulations, 2 smokers each smoked either 10 EHCSS (simulation 3) or 10 CC (simulation 7). The target ventilation rate was 72 m3/h and the actual ventilation rates were 102 and 115 m3/h for simulations 3 and 7, respectively. In simulation 3 while smoking EHCSS, small increases were observed for online and gravimetric particles, UVPM-THBP, FPM-scopoletin, solanesol, nicotine, and acetaldehyde compared to background. In simulation 7, all ETS constituents except for CO2, NO, and NO2 were increased relative to background. All ETS constituents, except for pyrene, were about 10-fold lower in the EHCSS simulation relative to when smoking CC.
TABLE 6 Mean concentrations of indoor air constituents (“office” with “low” IAQ conditions)
“Hospitality” with “low” IAQ conditions (simulations 4 and 8)
Results of the indoor air monitoring measurements of both simulations are shown in . Under this condition, 8 smokers each smoked 10 EHCSS (Simulation 4) or 10 CC (simulation 8), equivalent to 80 cigarettes per “smoking” period. The target ventilation rate was 576 m3/h and the actual ventilation rates were 543 and 643 m3/h for simulations 4 and 8, respectively. In simulation 4, small increases were observed for online and gravimetric particles, UVPM-THBP, FPM-scopoletin, solanesol, nicotine, 3-EP, toluene, N-nitrosonornicotine (NNN), and 2-aminonaphthylamine (2-NA) compared to background. During simulation 8, all ETS constituents except for CO2 and NO were increased compared to background. ETS constituents were about 10-fold higher in the CC simulation relative to EHCSS.
TABLE 7 Mean concentrations of indoor air constituents (“hospitality” with “low” IAQ conditions)
Comparison of EHCSS and CC smoking sessions
shows a graphical presentation of the percent difference in indoor air constituents in , representing simulation of an “office” with “high” IAQ conditions. shows a graphical presentation of the percent difference in indoor air constituents in , representing simulation of the “hospitality” environment with “low” IAQ conditions. CO2 is not included in the and because the ambient level is not generally influenced by cigarette smoking.
FIG. 2 Percent difference between smoking CC (Simulation 5) and smoking CC (Simulation 1) in the concentration of indoor air constituents in the “office” with a “high” IAQ condition.
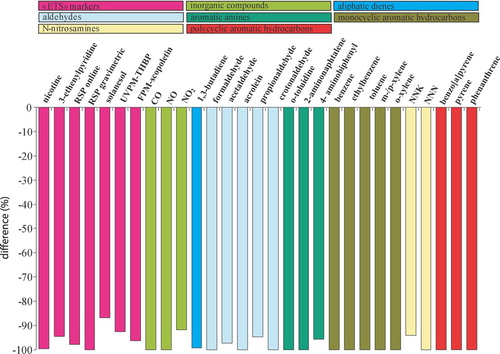
FIG. 3 Percent difference between smoking CC (Simulation 8) and smoking CC (Simulation 4) in the concentration of indoor air constituents in the “hospitality” environment with a “low” IAQ condition.
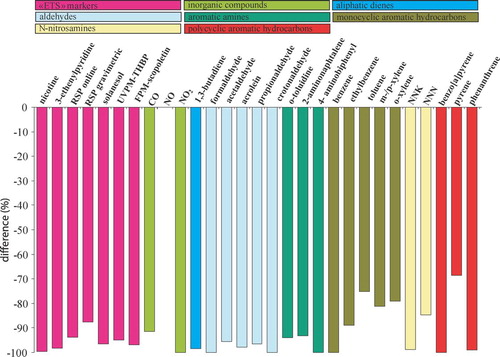
In a direct comparison between the simulations using either EHCSS or CC cigarettes, 24 of 29 measured smoke constituents (83%) showed mean reductions of greater than 90%, and 5 smoke constituents (17%) showed mean reductions between 80% and 90% when smoking EHCSS. Specific ETS markers for the gas–vapor phase of ETS (nicotine and 3-ethenylpyridine) were reduced by an average of 97% (range 94–99%) when the EHCSS was smoked compared to the CC. Similarly, ETS markers for the particulate phase (solanesol, UV-THBP, FPM-scopoletin) were reduced by 93% (range 85–97%). Total respirable suspended particles (RSP) determined either online by light scattering or as gravimetric RSP was reduced by 90% (range 82–100%). Thus, smoking EHCSS in simulated “office” and “hospitality” environments resulted in substantial reductions in indoor air ETS constituents compared to when smoking CC. The mean and standard deviation of the reduction of all constituents was 94 ± 4%.
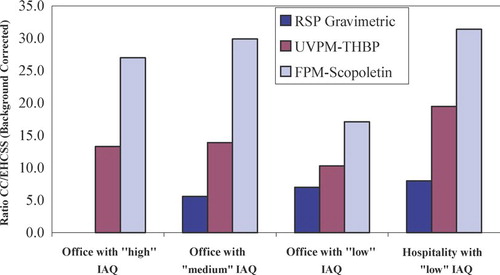
shows the ratio of ETS particulate matter constituent concentrations (background corrected CC/EHCSS) for each simulation condition. Because the RSP concentration determined in the EHCSS “office” simulation using a “high” IAQ conditions (simulation 1) was below the background concentration determined prior to smoking, no ratio could be calculated. shows that there is a higher ratio of ETS particulate phase marker concentrations when smoking CC compared to when smoking the EHCSS.
FIG. 4 Ratio of indoor air constituent concentrations (background corrected) of particulate phase markers CC/EHCSS for all simulations. For the “office” with “high” IAQ conditions the background was greater than in the EHCSS smoking session (simulation 1); therefore, a ratio could not be calculated.
Discussion
The study was performed in an environmentally controlled room under carefully controlled experimental conditions in order to compare concentrations of indoor air ETS constituents when smoking either CC or EHCSS. The study was designed using ventilation guidelines from international standardization organisations (ASHRAE, 2001, 2002; CEN, 2004) to simulate smoking conditions in an “office” with three levels of ventilation and subsequent IAQ conditions, and smoking in a “hospitality” environment with relatively “low” IAQ (). Actual ventilation rates were somewhat higher than the target ventilation rates; in simulations using the EHCSS the measured ventilation rates tended to be lower than in simulations using a CC and the ETS constituent concentrations were not corrected for these relatively small differences in ventilation rates.
Compared to background, smoking EHCSS resulted in a consistent and measurable increase only for RSP (measured online by light scattering, or measured gravimetrically). Average net increases in particles when smoking EHCSS increased as IAQ decreased in “office” simulations; the average net increase in particles determined in the “hospitality” simulation fell between the medium and low IAQ “office” simulations. Particle concentrations in the EHCSS simulations were almost 10-fold lower than those found in the CC simulations under the same conditions. However, different ratios (CC/EHCSS) were observed for the different particle markers (). These observations are suggestive of a qualitative difference in the ETS/RSP composition between EHCSS and CC smoke. This may be explained by the fact that tobacco is heated in the EHCSS, rather than burned as in a CC, resulting in an increased ratio of ETS constituents normally associated with tobacco combustion such as UVPM-THBP and FPM-scopoletin. As previously mentioned, the unique design of the EHCSS, in which sidestream smoke is not formed, results in ETS produced solely from exhaled mainstream smoke. Consequently, smoking EHCSS contributes less volatile and semivolatile constituents to indoor air than CC.
ETS constituents measured in this study showed no clear relationship to the number of cigarettes smoked, or to the ventilation conditions when smoking EHCSS (data not shown), suggesting that the ETS load from smoking EHCSS is indeed very small. In fact, levels for the measured indoor air smoke constituents in the EHCSS simulations did not consistently exceed the corresponding background levels (obtained with the same ventilation rate but without smoking).
In order to obtain specificity to tobacco smoke, indoor air constituents such as UVPM, FPM, and solanesol-PM have been proposed (Nelson et al., Citation1997). However, to convert the analytical measurements of UV absorbance, fluorescence intensity, and solanesol content to particulate matter equivalents (UVPM, FPM, and solanesol-PM, respectively) requires conversion factors that must be established by extensive laboratory measurements (Nelson et al., Citation1997). Such factors are specific for individual blends of tobacco and are not available for the EHCSS. Therefore, the standardized results called UVPM-THBP, FPMscopoletin, and solanesol were used in this study to compare indoor RSP from EHCSS and CC. These measurements are identical to those made from the conversion factor (Baek et al., Citation2004) applied to obtain UVPM, FPM, and solanesol-PM, respectively.
There is little published data available for FPM-scopoletin, solanesol, and UVPM-THBP used as surrogates for FPM, solanesol-PM, and UVPM, and only a few ETS constituents in indoor air other than nicotine, RSP, UVPM, FPM, and solanesol-PM have been studied sufficiently to permit a comparison of distributions of ETS constituents in “office” or “hospitality” environments. Therefore, comparisons to actual environments were only made using nicotine and ETS-RSP. show the cumulative distribution of nicotine concentrations in indoor air in European restaurants (Schorp & Leyden, Citation2002). The ratio of nicotine concentrations from smoking CC to that for smoking EHCSS across all simulations is 144 ± 125 (mean ± SD). Applying this ratio to the nicotine concentration distribution of conventional cigarettes resulted in a hypothetical “distribution of nicotine concentrations” predicted to occur if only EHCSS were smoked. The resultant distribution of nicotine concentrations would be shifted to the left, indicating that indoor nicotine concentrations would not exceed 1 μg/m3.
FIG. 5 Cumulative distribution of indoor air nicotine concentrations in European restaurants. The curve to the right (•) is derived from literature (Schorp & Leyden, Citation2002). The curve to the left (▴) is the hypothetical nicotine distribution curve if smoking of CC was replaced by smoking of an EHCSS.
The net increase in RSP above background in the “hospitality” simulations with “low” IAQ conditions is 287.9 μg/m3 and 35.8 μg/m3 for CC and EHCSS simulations, respectively. Because the RSP values reported are background corrected, it is more appropriate to compare the values with ETS/RSP (Bohanon et al., Citation2003). shows the cumulative distribution of indoor air particulate matter attributed to ETS (ETS-RSP) found in restaurants in France, Japan, Korea, the United Kingdom, the United States, and Switzerland (Bohanon et al., Citation2003). The ratio of ETS-RSP concentrations from smoking CC to those for smoking EHCSS across all simulations for the 3 surrogate compounds (UVPM-THBP, FPM-scopoletin, and solanesol) is 18 ± 8. Applying this ratio to the ETS-RSP concentration distribution of conventional cigarettes results in a hypothetical “distribution of ETS-RSP concentrations” where the high percentiles (> 90th) of ETS-RSP would be 11.7 (estimated range 7.5–15.8 μg/m3).
FIG. 6 Cumulative distribution of indoor air particulate-phase ETS-RSP in restaurants in France, Japan, Korea, the United Kingdom, the United States, and Switzerland. The curve to the right (•) is derived from literature (Bohanon et al., Citation2003). The curve to the left (▴) is the hypothetical ETS-RSP curve if smoking of CC was replaced by smoking of an EHCSS.
A number of studies have reported indoor air constituent measurements taken in hospitality venues when smoking was allowed and after smoking was absent (Repace, Citation2004; Travers et al., Citation2004; Connolly et al., Citation2005; Gorini et al., Citation2005; Mulcahy et al., Citation2005; Ellingsen et al., Citation2006; McNabola et al., Citation2006; Repace et al., Citation2006; Goodman et al., Citation2007; Semple et al., Citation2007). With the exception of two studies that reported nicotine concentrations (Gorini et al., Citation2005; Mulcahy et al., Citation2005), none of the reported studies included specific markers for tobacco smoke. However, review of these pre/post smoking ban data for indoor air constituents suggests that the percent changes are comparable with the observed ETS constituent concentrations after switching from smoking CC to EHCSS. In other words, the level of indoor air contaminants when EHCSS is being smoked is not discernibly different from the levels measured when cigarette smoking is absent. These data suggest that changing the product design, such as from conventional cigarettes to the EHCSS, can effectively reduce indoor air contaminant levels and may have the same effect as smoking bans.
In conclusion, the results of this study provide data for the comparison of the levels of ETS constituents in indoor air for simulated office and hospitality environments when CC and EHCSS cigarettes are smoked. Although significant and consistent increases in indoor air constituents compared to background were detected in simulations using the CC, smoking EHCSS was not consistently found to result in a significant increase above background levels for both volatile gas–vapor phase and particulate-phase ETS constituents. These results suggest that smoking EHCSS in an “office” or “hospitality” environment would result in an approximate 90% reduction in the concentrations of ETS constituents compared to when smoking conventional lit-end cigarettes.
Notes
1In November 2003 the status of SACTob was changed and it became the WHO Study Group on Tobacco Product Regulation (TobReg).
References
- AHRAE. 2001. ASHRAE Standard 62-2001. Ventilation for acceptable indoor air quality. Atlanta, GA: American Society of Heating, Refrigerating and Air-Conditioning Engineers.
- AHRAE. 2002. ASHRAE Standard 62-2001 Addendum 62o. Ventilation for acceptable indoor air quality Appendix I. Guidelines for ventilation in smoking-permitted areas. Atlanta, GA: American Society of Heating, Refrigerating and Air-Conditioning Engineers.
- S.-O. Baek, and R. A. Jenkins. 2004. Characterization of trace organic compounds associated with aged and diluted sidestream tobacco smoke in a controlled atmosphere—Volatile organic compounds and polycyclic aromatic hydrocarbons. Atmos. Environ. 38:6583–6599.
- R. Baker, and C. J. Proctor. 1990. The origins and properties of environmental tobacco smoke. Environ. Int. 16:231–245.
- H. R. Bohanon, J.-J. Piadé, M. K. Schorp, and Y. Saint-Jalm. 2003. An international survey of indoor air quality, ventilation and smoking activity in restaurants: A pilot study. J. Expos. Anal. Environ. Epidemiol. 13:378–392.
- W. S. Cain, T. Tosun, L.-C. See, and B. Leaderer. 1987. Environmental tobacco smoke: sensory reactions of occupants. Atmos. Environ. 21:347–353.
- California Environmental Protection Agency. 1997. Health effects of exposure to environmental tobacco smoke. Sacramento: California Environmental Protection Agency, Office of Environmental Health Hazard Assessment, Final Report.
- G. N. Connolly, C. Carpenter, H. R. Alpert, M. Skeer, and M. Travers. 2005. Evaluation of the Massachusetts Smoke-free Workplace Law. A preliminary report. Boston: Harvard School of Public Health, Tobacco Research Program.
- J. C. Chuang, G. A. Mack, M. R. Kuhlman, and N. K. Wilson. 1991. Polycyclic aromatic hydrocarbons and their derivatives in indoor and outdoor air in an eight-home study. Atmos. Environ. 25:369–380.
- K. Craver-Gladstone, G. D. Byrd, and M. W. Ogden. 2002. GC-MS analytical method for airborne nicotine, 3-ethenylpyridine, and myosmine. New Orleans, LA: CORESTA Conference 2002.
- D. G. Ellingsen, G. Fladseth, H. L. Daae, M. Gjolstad, K. Kjaerheim, M. Skogstad, R. Olsen, S. Thorud, and P. Molander. 2006. Airborne exposure and biological monitoring of bar and restaurant workers before and after the introduction of a smoking ban. J. Environ. Monit. 8:362–368.
- European Committee for Standardization. 2004. CEN European Standard EN 13779. Ventilation for non-residential buildings—Performance requirements for ventilation and room-conditioning systems. European Committee for Standardization, Brussels, September (approved by CEN on 2004-01-16).
- P. Goodman, M. Agnew, M. McCaffrey, G. Paul, and L. Clancy. 2007. Effects of the Irish smoking ban on respiratory health of bar workers and air quality in Dublin pubs. Am. J. Respir. Crit. Care Med. 175:840–845.
- G. Grimmer, and D. Schneider. 1995. Intercept-reactant method for the determination of aromatic amines in mainstream tobacco smoke. Beitr. Tabakforsch. Int. 16:141–156.
- G. Gorini, A. Gasparrini, M. C. Fondelli, A. S. Costantini, F. Centrich, M. J. Lopez, and E. Tamang. 2005. Environmental tobacco smoke (ETS) exposure in Florence hospitality venues before and after the smoking ban in Italy. J. Occup. Environ. Med. 47:1206–1210.
- L. Gunnarsen, and P. O. Fanger. 1991. Adaptation to indoor air pollution. Environ. Int. 18:43–54.
- International Agency for Research on Cancer. 2004 Tobacco smoke and involuntary smoking. IARC Monogr. Eval. Carcinogen. Risk Hum. 83. Lyon: IARC.
- International Standard Organization. 2003. ISO 18145. Tobacco and tobacco products—Determination of vapour-phase nicotine and 3-ethenylpyridine in air—Gas-chromatographic method. Geneva: International Organization for Standardization.
- International Standard Organization. 2001. ISO 15593. Environmental tobacco smoke—Estimation of its contribution to respirable suspended particles—Determination of particulate matter by ultraviolet absorbance and by fluorescence. Geneva: International Organization for Standardization.
- R. A. Jenkins, M. R. Guerin, and B. A. Tomkins. 2000. The chemistry of environmental tobacco smoke: Composition and measurement, 2nd ed. Indoor Air Research Series, M. Eisenberg, series ed. Boca Raton, FL: Lewis.
- R. A. Jenkins, M. P. Maskarinec, R. W. Counts, J. E. Caton, B. A. Tomkins, and R. H. Ilgner. 2001. Environmental tobacco smoke in an unrestricted smoking workplace: Area and personal exposure monitoring. J. Expos. Anal. Environ. Epidemiol. 11:369–380.
- K. Kuwata, M. Uebori, H. Yamasaki, and Y. Kuge. 1983. Determination of aliphatic aldehydes in air by liquid chromatography. Anal. Chem. 55:2013–2016.
- A. McNabola, B. Broderick, P. Johnston, and L. Gill. 2006. Effects of the smoking ban on benzene and 1,3-butadiene levels in pubs in Dublin. J. Environ. Sci. Health 41:799–810.
- M. Mulcahy, D. S. Evans, S. K. Hammond, J. L. Repace, and M. Byrne. 2005. Secondhand smoke exposure and risk following the Irish smoking ban: An assessment of salivary cotinine concentrations in hotel workers and nicotine levels in bars. Tobacco Control 14:384–388.
- National Research Council. 1986. Environmental tobacco smoke—Measuring exposure and assessing health effects. Washington, DC: National Academy Press.
- P. R. Nelson, F. W. Conrad, S. P. Kelly, K. C. Maiolo, J. D. Richardson, and M. W. Ogden. 1997. Composition of environmental tobacco smoke (ETS) from international cigarettes and determination of ETS-RSP: Particulate marker ratios. Environ. Int. 23:47–52.
- National Institute of Occupational Health and Safety. 1994. 1,3-Butadiene. Method no. 1024, Issue 2. In NIOSH Manual of Analytical Methods (NMAM), 4th ed. Available at: http://setonresourcecenter.com/hazcom/nmam/new.html.
- National Institute of Occupational Health and Safety. 2003. Hydrocarbons, aromatic. Method no. 1501. In NIOSH Manual of Analytical Methods (NMAM), 4th ed. Available at: http://setonresourcecenter.com/hazcom/nmam/new.html.
- M. W. Ogden, and K. C. Maiolo. 1992. Comparison of GC and LC for determining solanesol in environmental tobacco smoke. LC-GC Int. 10:459–462.
- G. Palmiotto, G. Pieraccini, G. Moneti, and P. Dolara. 2001. Determination of the levels of aromatic amines in indoor and outdoor air in Italy. Chemosphere 43:355–361.
- G. Patskan, and W. Reininghaus. 2003. Toxicological evaluation of an electrically heated cigarette. Part 1: Overview of technical concepts and summary of findings. J. Appl. Toxicol. 23:323–328.
- J. Repace. 2004. Respirable particles and carcinogens in the air of Delaware hospitality venues before and after a smoking ban. J. Environ. Med. 46:887–905.
- J. L. Repace, J. N. Hyde, and D. Brugge. 2006. Air pollution in Boston bars before and after a smoking ban. BMC Public Health 6:266.
- M. K. Schorp, and D. E. Leyden. 2002. Distribution analysis of airborne concentrations in hospitality facilities. Environ. Int. 27:567–578.
- S. Semple, K. S. Creely, A. Naji, B. G. Miller, and J. G. Ayres. 2007. Secondhand smoke levels in Scottish pubs: The effect of smoke-free legislation. Tobacco Control 16:127–132.
- R. Stabbert, P. Voncken, K. Rustemeier, H. J. Haussmann, E. Roemer, H. Schaffernicht, and G. Patskan. 2003. Toxicological evaluation of an electrically heated cigarette. Part 2: Chemical composition of mainstream smoke. J. Appl. Toxicol. 23:329–339.
- P. M. Terpstra, A. Teredesai, P. M. Vanscheeuwijck, J. Verbeeck, G. Schepers, F. Radtke, P. Kuhl, W. Gomm, E. Anskeit, and G. Patskan. 2003. Toxicological evaluation of an electrically heated cigarette. Part 4: Subchronic inhalation toxicology. J. Appl. Toxicol. 23:349–362.
- F. J. Tewes, T. J. Meisgen, D. J. Veltel, E. Roemer, and G. Patskan. 2003. Toxicological evaluation of an electrically heated cigarette. Part 3: Genotoxicity and cytotoxicity of mainstream smoke. J. Appl. Toxicol. 23:341–348.
- M. J. Travers, K. M. Cummings, A. Hyland, J. Repace, S. Babb, T. Pechacek, and R. Caraballo. 2004. Indoor air quality in hospitality venues before and after implementation of a clean indoor air law—Western New York, 2003. Morbid. Mortal. Weekly Rep. 53:1038–1104.
- U.S. Department of Health and Human Services. 2006. The health consequences of involuntary exposure to tobacco smoke: A report of the Surgeon General. Rockville, MD: U.S. Department of Health and Human Services, Centers for Disease Control and Prevention, Coordinating Center for Health Promotion, National Center for Chronic Disease Prevention and Health Promotion, Office on Smoking and Health.
- U.S. Environmental Protection Agency. 1992. Respiratory health effects of passive smoking: Lung cancer and other disorders. Washington, DC: U.S. Environmental Protection Agency, Office of Research and Development, Office of Health and Environmental Assessment. EPA/600/6-90/006F.
- C. Viau, G. Hakizimana, and M. Bouchard. 2000. Indoor exposure to polycyclic aromatic hydrocarbons and carbon monoxide in traditional houses in Burundi. Int. Arch. Occup. Environ. Health 73:331–338.
- J. C. Walker, P. R. Nelson, W. S. Cain, M. J. Utell, M. B. Joyce, W. T. Morgan, T. J. Steichen, W. S. Prichard, and M. W. Stancill. 1997. Perceptual and psychophysiological responses of non-smokers to a range of environmental tobacco smoke concentrations. Indoor Air 7:173–188.
- W. Wu, D. L. Ashley, and C. H. Watson. 2003. Simultaneous determination of five tobacco-specific nitrosamines in mainstream cigarette smoke by isotope dilution liquid chromatography/electrospray ionisation tandem mass spectrometry. Anal. Chem. 43:4827–4832.