
 ?Mathematical formulae have been encoded as MathML and are displayed in this HTML version using MathJax in order to improve their display. Uncheck the box to turn MathJax off. This feature requires Javascript. Click on a formula to zoom.
Abstract
Inhalation of aerosols generated by electronic cigarettes leads to deposition of multiple chemical compounds in the human airways. In this work, an experimental method to determine regional deposition of multicomponent aerosols in an in vitro segmented, realistic human lung geometry was developed and applied to two aerosols, i.e. a monodisperse glycerol aerosol and a multicomponent aerosol. The method comprised the following steps: (1) lung cast model preparation, (2) aerosol generation and exposure, (3) extraction of deposited mass, (4) chemical quantification and (5) data processing. The method showed good agreement with literature data for the deposition efficiency when using a monodisperse glycerol aerosol, with a mass median aerodynamic diameter (MMAD) of 2.3 μm and a constant flow rate of 15 L/min. The highest deposition surface density rate was observed in the bifurcation segments, indicating inertial impaction deposition. The experimental method was also applied to the deposition of a nebulized multicomponent aerosol with a MMAD of 0.50 μm and a constant flow rate of 15 L/min. The deposited amounts of glycerol, propylene glycol and nicotine were quantified. The three analyzed compounds showed similar deposition patterns and fractions as for the monodisperse glycerol aerosol, indicating that the compounds most likely deposited as parts of the same droplets. The developed method can be used to determine regional deposition for multicomponent aerosols, provided that the compounds are of low volatility. The generated data can be used to validate aerosol deposition simulations and to gain insight in deposition of electronic cigarette aerosols in human airways.
Introduction
In vivo inhalation studies are commonly used to assess the toxicity of deposited aerosol constituents and their influence on biological systems. However, when using standard inhalation toxicology approaches both the costs associated with testing and the time required to conduct the assays, generate, and analyze the data make it challenging to extensively test a large number of aerosols. Furthermore, in many parts of the world, there are mounting legal, regulatory, economic and social pressures that demand a reduction in animal testing and development of suitable alternatives such as in vitro and/or in silico testing (European Parliament, Citation2010; Schiffelers et al., Citation2012). As a result, new approaches are needed to obtain the knowledge of aerosol exposure and deposition mechanisms to determine the potential hazards for human health exposure.
Humans are continuously exposed to aerosols, solid or liquid particles suspended in a gas, during inhalation, which serves as a major pathway into the human body (Kreyling et al., Citation2010). During inhalation, an aerosol travels through different regions of the respiratory tract, which have different geometric shapes and dimensions. Starting from the mouth and nasal cavity, the aerosol flows through the pharynx (throat) and larynx (upper respiratory tract) down to the trachea and bronchial tubes before it finally reaches the alveoli. During this journey, the aerosol experiences a variety of conditions and undergoes dynamic evolution. Aerosol particles may deposit on airway walls and gaseous compounds may be absorbed by the surrounding biological tissues. Aerosol particle deposition is strongly dependent on the flow pattern. Depending on the sizes of the particles in the aerosol, deposition locations inside the respiratory tract may vary greatly and regions of locally increased deposition, called “hot spots”, may be formed (Longest & Holbrook, Citation2012; Srirama et al., Citation2012). This locally increased exposure, may lead to inflammation and the onset of certain exposure-related diseases (Balásházy et al., Citation2003).
To evaluate the impact of deposited compounds from aerosols on biological tissues, experimental dosimetry in vitro is increasingly used to study the effect of direct deposition on living cell-cultures in exposure systems, such as air–liquid interface (ALI) systems (Comouth et al., Citation2013; Paur et al., Citation2011; Tippe et al., Citation2002). For example, the Vitrocell® 24/48 ALI exposure system has been extensively used to evaluate the toxicity of cigarette smoke (Iskandar et al., Citation2013; Mathis et al., Citation2013; Schlage et al., Citation2014) as well as electronic cigarette aerosols (Neilson et al., Citation2015).
In vitro exposure systems using organotypic cell cultures are important to complement in vivo assessments for modern toxicology and have the potential to serve as a replacement. The systems should be robust, and the aerosol exposure equivalent or at least translatable to that of in vivo. It is therefore important to fully understand the aerosol dynamics in both in vitro exposure systems and the human respiratory tract. To determine the exposure and local deposition in the complex human airways at realistic flow conditions, aerosol particle deposition has been studied experimentally using physical in vitro replicas of the human respiratory tract (Chan & Lippmann, Citation1980; Cheng et al., Citation1999; Sosnowski et al., Citation2006), which are often generated from computed tomography or magnetic resonance imaging images. Many studies have been performed on extrathoracic deposition in mouth and throat replica (Cheng, Citation2012; Golshahi et al., Citation2013; Grgic et al., Citation2004aCitation,b; Zhang et al., Citation2004). In most of these studies, gamma scintigraphy and gravimetry were used to determine deposition of controlled single component aerosol particles. These two methods are less suitable for determining deposition of multicomponent aerosols, such as those generated by electronic cigarettes.
Deposition experiments are challenging to perform for volatile, evolving aerosols and limited to the number of branches of the physical airway model. Aerosol particle deposition patterns in the respiratory tract can also be predicted using physical and chemical characteristics of the aerosol with realistic inhalation conditions and geometries in computational fluid dynamic (CFD) simulations with integrated physical models of aerosol transport, evolution, and deposition mechanisms (Longest & Holbrook, Citation2012). The generic CFD approach offers detailed, noninvasive information about the physics of the formation, evolution, transport and deposition of the aerosol, provided that the computational approach can be validated with high quality experimental deposition data. CFD simulations are used to identify local deposition patterns in human lungs, which indicate the level of dosing that biological cells in these regions are exposed to.
Regardless of whether the focus is on estimating the deposition in the respiratory tract to link the local tissue exposure to the onset of exposure-related diseases, to relate the aerosol exposure in in vitro exposure systems or validating aerosol deposition CFD models, experimental data on aerosol deposition under controlled conditions are highly valuable. Experimental deposition data in the human airways have mostly been generated for solid aerosol particles or for single compound liquid aerosols (Chan & Lippmann, Citation1980; Lizal et al., Citation2015; Zhou & Cheng, Citation2005), implying that there is a lack of experimental data and methods to determine and quantify deposition of multicomponent liquid aerosol particles, such as those generated from nebulizers or electronic cigarettes.
In this work, we focus on the experimental determination and quantification of the regional deposition of liquid-based single-compound and multicomponent aerosol particles in a human respiratory tract cast model. The in vitro cast model of the human respiratory tract developed by Lizal et al. (Citation2012), which includes the oral cavity and tracheobronchial region down to generation 7, was used experimentally to quantify deposition of a monodisperse glycerol aerosol and a nebulized multicomponent aerosol generated under carefully controlled conditions. To allow for measurements of multicomponent deposited matter in different locations of the realistic respiratory tract geometry, the cast model was divided into sections and a sensitive chemical quantification method was adopted.
Materials and methods
The aerosol deposition experiments carried out in this work are based on the works by Belka et al. (Citation2014) and Lizal et al. (Citation2015) with a modified quantification technique for multicomponent aerosols. The experimental procedure comprises the following main steps: (1) Lung cast model preparation, (2) Aerosol generation and exposure, (3) Extraction of deposited mass, (4) Chemical quantification, and (5) Data processing.
Lung cast model preparation
A segmented airway model based on the geometry of a real human lung was used for the experiments. This model was developed by Lizal et al. (Citation2012) and used for the aerosol deposition study of monodisperse di-2-ethyl hexyl sebacate particles of different sizes by Lizal et al. (Citation2015). The cast consisted of an oral cavity and subsequent airways down to the 7th generation of branching.
The internal geometry of the model was created by combining a digital reference model of the human tracheobronchial tree developed by Schmidt et al. (Citation2004) and the oral cavity of model A from the Lovelace Respiratory Research Institute (Cheng et al., Citation1999), which was scanned and digitized at the Brno University of Technology. The resulting in silico representation of the human tracheobronchial tree is shown in (left). A physical model with 32 segments, shown in (right), was built from the digital geometry in the computer-aided design software Rhinoceros (McNeel, Barcelona, Spain) and produced by a Polyjet rapid prototyping method on an Objet machine (Stratasys, Eden Prairie, MN) with an accuracy of 0.1 mm and a layer thickness of 0.016 mm. The material used to construct the model was Veroclear from Stratasys. The segments of the cast model are constructed to separate the geometrical features of the airways. The model segments were numbered from top to bottom starting with the oral cavity as number one followed by the trachea as the second part as shown in . Going down the airway, bifurcations as well as connecting sections in the upper parts of the airways, where the physical dimensions are relatively large, were isolated into separate segments. Further down the lung cast, where the physical dimensions are smaller, several bifurcations and channels were combined into complex segments numbered from 13 to 22 in . To connect each of these complex shaped segments to an outlet tube, outlet connection segments numbered from 23 to 32 were also part of the entire model, as shown in . The above-mentioned segmentation of the model resulted in parts of widely different internal surface areas (Ai) and equivalent diameters (De,i) for the airway segments, as shown in . Following the strategy by Lizal et al. (Citation2012), the input diameter was used as the equivalent diameter for segments containing a single bifurcation. For segments containing more bifurcations, the average equivalent output diameters were first calculated for all the output cross sections in the segment. Thereafter, the average of all input and output equivalent diameters of the segment was used to represent the final De,i of the segment (Lizal et al., Citation2012).
Figure 1. Visualization of the digital geometry (left) and the complete segmented cast model of human airways (right). Reproduced from Belka et al. (Citation2014) with kind permission of The European Physical Journal (EPJ).
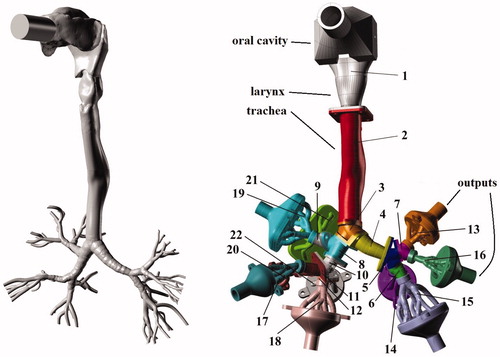
Table 1. Internal surface area Ai and equivalent diameter De,i of the airway segments of the lung cast.
Prior to each exposure experiment, all model parts were washed with a 2-propanol Chromasolv®, 99.9% solution from Sigma-Aldrich (St. Louis, MO) to ensure that no residual deposited mass was carried over from previous exposures. After the initial washing, the model parts were left to dry prior to being assembled by screwing together the 32 segments to form the final lung cast model. To avoid leakage during the aerosol exposures, a thin layer of silicone gel was applied to seal the joints between the segments. No explicit discharging of the assembled cast model was performed prior to the exposure experiments.
Aerosol generation and exposure
The monodisperse glycerol aerosol and the multicomponent aerosol were in this work generated using different aerosol generation technologies, which are described separately in the following subsections.
Generation of the monodisperse glycerol aerosol
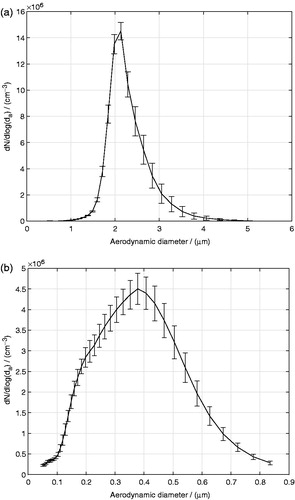
Aerosol particles were generated by a TSI 3475 Condensation Monodisperse Aerosol Generator (CMAG) from TSI, Inc. (Shoreview, MN). A sodium chloride solution was used to form nuclei onto which glycerol vapors were condensed in the condensation chimney of the CMAG. The temperature of the CMAG saturator was set to 140 °C and the output flow rate was adjusted to 4 L/min. The generated glycerol aerosol was fed through a Krypton-85 (Kr-85) neutralizer. The neutralizer imparts a Boltzmann equilibrium charge distribution on the aerosol droplets. The glycerol aerosol exiting the neutralizer was measured using a TSI 3321 Aerodynamic Particle Sizer® (APS) spectrometer to be close to monodisperse with a count median aerodynamic diameter (CMAD) of 2.1 μm and a geometric standard deviation (GSD) of 1.19, as shown in . The mass median aerodynamic diameter (MMAD) was calculated using the Hatch-Choate equation (Hinds, Citation1999) to be 2.3 μm. The conversion from CMAD to MMAD was done using the Hatch-Cloate equation instead of using the APS software output directly, to avoid that potential APS signal artifacts in large size bins would influence the calculated MMAD. The particle size of 2.3 μm was chosen, as it was the largest glycerol particle size that could be generated with the CMAG without sacrificing the monodispersity of the aerosol particle size distribution. The transient behavior of the glycerol aerosol generation using the CMAG was characterized by the APS spectrometer to determine the time required for the aerosol generation to stabilize. The aerosol droplet number density, N, as well as the aerosol droplet size distribution were found to be stable after around 2000 s from the start of the aerosol generation. The experiments in this work were carried out after the CMAG reached a stable operating mode. The SD (i.e. variability over time for a representative experiment) represented by the error bars in indicates the stability of the droplet size distribution during the course of the exposures. The SD was calculated from aerosol size distributions recorded every 5 min during the duration of an exposure. The mass concentration of the monodisperse glycerol aerosol exiting the CMAG was determined to be 7.3 μg/cm3. It was determined by first collecting the aerosol on Cambridge filters (Cambridge Filter Corporation, East Syracuse, NY) after 5, 10, 15, and 20 min of exposure, and thereafter extracting the captured aerosol mass from the filters and quantifying it by chemical analysis according to the procedure described in a later subsection.
Figure 2. (a) Monodisperse glycerol and (b) multicomponent aerosol droplet size distributions, where da is the aerodynamic diameter and the error bars represent the SD (i.e. variability over the duration of a representative experiment).
Generation of the multicomponent aerosol
Aerosol particles were generated via nebulization of a multicomponent liquid solution typically used in cartridges of electronic cigarettes. The multicomponent solution consisted of propylene glycol, glycerol, nicotine and water with their mass fractions being 52.6%, 28.1%, 1.9%, and 17.4%, respectively. Nebulization was chosen as aerosol generation technique, as it is challenging to generate a stable multicomponent aerosol based on propylene glycol in the CMAG. Moreover, as nicotine was used, a time-consuming and careful cleaning of the CMAG would have to be carried out after every use. Instead, the solution was nebulized by a 1-jet Collison nebulizer (BGI Inc., Waltham, MA). The input air gauge pressure entering the nebulizer was 138 kPa, which aspirated the solution into a high-velocity gas jet, wherein the solution was atomized by shear force into droplets that consequently impacted onto a glass surface to produce a secondary population of fine droplets. The size distribution of the nebulized aerosol was measured by a TSI 3936 Scanning Mobility Particle Sizer® (SMPS) instrument (TSI, Shoreview, MN), and as can be seen in , the aerosol was polydisperse with a CMAD of 0.307 μm and a GSD of 1.69 corresponding to a MMAD of 0.497 μm. The integrated TSI Data Merge Software Module Version 1.0.3.0 was used to convert the electrical mobility diameter provided by the SMPS to aerodynamic diameters. The intrinsic density of the multicomponent droplets used for the conversion to aerodynamic diameters was calculated based on the individual mass fractions and densities of the compounds to be 1 g/cm3. Before performing any cast exposure, the aerosol droplet size distribution was recorded every 5 min for the duration of an exposure for the selected nebulization settings to study the stability of the aerosol droplet size distribution over time. The individual mass concentrations of propylene glycol, glycerol, and nicotine in the multicomponent aerosol exiting the nebulizer were determined to be 5.0, 2.8, and 0.2 μg/cm3, respectively, using the same procedure as described previously for the monodisperse glycerol aerosol. The measured masses of the individual compounds increased linearly with time. The coefficients of determination of the linear fits, were 0.991, 0.968, and 0.997 for propylene glycol, glycerol, and nicotine, respectively, indicating that there were no significant evaporation of the compounds during the sampling.
Exposure
Charge neutralized aerosols were mixed with Alphagaz 1 Air dilution air (Carbagas AG, Gümligen, Switzerland) (80% nitrogen, 20% oxygen, 99.999% purity) in a dilutor (Mécanique Industrielle Flück, Boudry, Switzerland), as depicted in , to achieve a desirable total flow rate. The flow rate from the source of dilution air was controlled by a Bronkhorst F-201-C-RGD-22-V flow meter/controller. The diluted aerosol was then introduced to the lung cast model. The segmented cast model was composed of complex multi-generation parts that terminate by 10 output segments (see ). Each of these output segments were connected to a Cambridge filter (Cambridge Filter Corporation, East Syracuse, NY) inserted in holders, as described by Ghosh & Jeannet (Citation2014), to collect all the aerosol particles passing through the cast. The rest of the experimental setup consisted of 10 rotameters (Cole-Parmer, Vernon Hills, IL), each attached to 1 of the 10 outlets to set and report the flow rate distribution between different output branches and to assure a desired total flow rate through the cast. The outputs from all 10 rotameter outlets were connected through a manifold tube connector (Vitrocell Systems Gmbh, Waldkirch, Germany) to a KNF N840.12FT.18 vacuum pump (KNF Neuberger GmbH, Freiburg, Germany), which drew the aerosol through the cast by suction. Conductive black tubing (TSI, Shoreview, MN) was used to connect all parts of the experimental set-up, even though conductive tubing was only necessary upstream of the output filters. The temperature and relative humidity inside the cast model were not explicitly monitored, but were 22 ± 1 °C and 34 ± 2%, respectively, in the laboratory during all experiments. To be able to compare the generated deposition data with published data from other cast model experiments, and to produce reliable data that may be used to validate aerosol deposition simulations, there was no attempt made to match the temperature and relative humidity conditions with human conditions in this work.
Figure 3. Schematic of the experimental set-up.
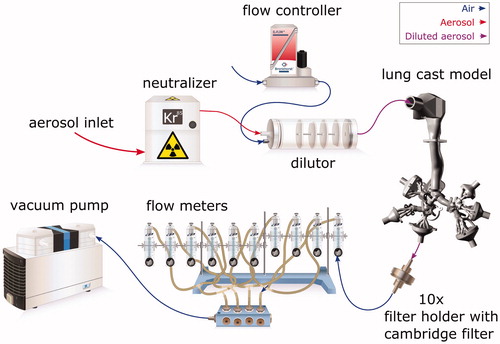
A steady-state inhalation mode with a flow rate of 15 L/min, representing average flow conditions of a sedentary regime (quiet breathing) (Elcner et al., Citation2016), was chosen to fully control the experimental condition and to facilitate the method validation with deposition data from other published in vitro inhalation studies. The flow rates Qi through the output segments numbered from 23 to 32, see , were set by the rotameters to the values related to the pneumatic resistance of the model airways reported by Lizal et al. (Citation2015), totaling a 15 L/min flow rate at the cast model inlet. The flow rates through the airway sections of the cast, provided in , were calculated from the flow rates of the outlet sections and the branch connectivities shown in . As shown in , the outlet flow rates were different for each of the 10 outlets. The inlet flow rate at the entrance to the oral cavity was measured by a TSI 4140 mass flow meter prior to every experiment to check the tightness of the model and that the total flow rate through the cast was 15 L/min. To ensure that the aerosol generation for the monodisperse glycerol aerosol experiments remained stable over the course of the exposure, the particle size distribution was measured before and after the deposition experiment using the APS. The cast model was exposed for 1 h in the monodisperse glycerol aerosol experiments and between 1.5 h and 2 h in the multicomponent aerosol experiments to achieve sufficient deposited mass on all cast segments for quantification. The experiments were repeated 7 times for the monodisperse glycerol aerosol and 4 times for the multicomponent aerosol experiments, each on different days.
Table 2. Flow rates for each airway segment of the lung cast for the monodisperse glycerol aerosol and multicomponent aerosol experiments.
Extraction of deposited mass
After the segmented lung cast was exposed to the generated aerosols, all segments of the cast model and the filter holders were disassembled. The deposited mass on each disassembled segment was extracted by rinsing with known amounts of 2-propanol Chromasolv®, 99.9% solution from Sigma-Aldrich. The 2-propanol extraction solution contained phenol-13C6 (2 μg/mL and naphthalene-D8 0.5 μg/mL), which were used to monitor the stability of the chemical quantification using gas chromatography-mass spectrometry (GC-MS). Because the segments of the cast are differently sized in both volume and internal surface area, the extraction method for the various compounds was adapted to optimize the extracted deposited mass per volume of extraction solution. Smaller parts of the cast were placed in beakers filled with the extraction solution and were sonicated for 1 min. Larger parts, such as the oral cavity and the trachea, were wrapped with SigmaAldrich parafilm to seal the inlet and outlet and a small amount of the extraction solution was injected inside. These wrapped segments were put in a Labinco LD76 Digital Rotary Mixer (Gemini BV, Apeldoorn, the Netherlands) for 30 min with a frequency of rotation of 1 Hz. The Cambridge filters and filter holders were washed together by flushing them with the extraction solution without taking them apart. The resulting extraction solutions, including the extracted deposited mass, were stored in dark glass bottles and put into a freezer at −20 °C before the chemical quantification was carried out. Because the disassembling and the extraction procedure is time-consuming, only compounds with low volatility can be measured by the developed experimental method. For highly volatile compounds, the initially deposited mass can evaporate during handling.
Black conductive tubing was used to connect the outlet segments and the filter holders but was not extracted in the experiments. However, to investigate the amount of aerosol that deposits in these tubes compared with that on the output filters, a selection of seven tubes were washed by the extraction solution and analyzed by the chemical quantification method. The deposited mass in the connecting tubes on average represented 2.5% of the deposited mass collected by the connected filter. Based on the findings from the monodisperse glycerol aerosol experiments, the same extraction procedure was also used for the multicomponent aerosol experiments, i.e. each cast segment was rinsed once per experimental run to extract the deposited mass from the segment.
Chemical quantification
In this section, the chemical quantification method allowing for quantification of multiple chemical compounds found in the extraction solutions from the segments is presented.
Preparation of calibration samples
Calibration samples for the three compounds of interest were prepared at different concentration levels, using: certified nicotine 99.9% from the Institute of Industrial Organic Chemistry (Warsaw, Poland), and propylene glycol 99.5%, glycerol 99.5% and 2-propanol Chromasolv®, 99.9% were from Sigma-Aldrich. For each compound, 12 calibration standards containing glycerol at concentrations ranging from 1.4 to 700 μg/mL, nicotine from 0.3 to 135 μg/mL and propylene glycol at concentrations ranging from 0.2 to 160 μg/mL were prepared. The calibration standards also contained acrylamide, diethylene glycol, menthol, phenol and triacetine compounds, which were not used for quantification purposes in this work, since only glycerol, nicotine and propylene glycol were analyzed. The calibration standards were prepared in a dilution solution of 2-propanol containing naphthalene-D8 (0.5 μg/mL) and phenol-13C6 (2 μg/mL). Naphthalene-D8 and phenol-13C6 were used to control the stability and repeatability of the chemical analysis.
Preparation of extracted samples
The samples extracts, resulting from the washing of the cast segments, were extracted and diluted with a 2-propanol solution containing phenol-13C6 (2 μg/mL) and naphthalene-D8 (0.5 μg/mL) to obtain concentration levels within the predefined calibration ranges for the measured compounds. The extracts were then transferred into GC vials for GC-MS analysis.
Instrumentation and quantification
The analysis were performed using an Agilent 6890 N Gas Chromatograph from Agilent Technologies Inc. (Santa Clara, CA), equipped with an Agilent J & W DB-WAXetr GC capillary column (30 m, 0.25 mm inner diameter, 0.5 μm film thickness) and an Agilent Mass Spectrometer 5973 as the detector. The MSD Chemstation software version E.02.02.1431 was used for data acquisition and integration.
The carrier gas was helium at a constant flow rate of 1.2 mL/min. The column temperature was initially set to 65 °C for a period of 0.5 min, then gradually increased to 175 °C at a rate of 7 °C/min, and finally increased to 260 °C at a rate of 15 °C/min and held at 260 °C for 8 min. The injection port temperature was set at 250 °C to inject 0.5 μL of samples and standards in a pulsed splitless mode.
For GC-MS detection, an electron ionization system was used with an ionization energy of 70 eV. The MS transfer line temperature, MS source and MS Quad temperatures were set at 250 °C, 230 °C and 150 °C, respectively. Data acquisition was carried out by the single ion monitoring mode and the quantification was performed by extraction of the total ion count obtained at the retention time of the measured compounds for glycerol (retention time: 21.4 ± 0.3 min), nicotine (retention time: 17.8 ± 0.3 min) and propylene glycol (retention time: 12.8 ± 0.3 min).
The monitored ions were m/z 45 and 61 for segment 1 in the retention time zone of propylene glycol; m/z 55, m/z 71, m/z 133, m/z 136 and m/z 162 for segment 2 in the retention time zone of nicotine; and m/z 43, m/z 61, m/z 116 and m/z 145 for segment 3 in the retention time zone of glycerol.
To determine the deposited aerosol mass present in the analyzed samples, the results of the chemical analyses were quantified against the 12 analyzed calibration standards for each compound. This quantified the analyzed compound that was deposited and extracted from each of the cast segments. Hence, the mass deposited in all cast segments and filters was quantified, so that the mass deposition rates over the period of the experiment could be derived.
Data processing
The final step of the experimental method was to process the deposition data from the chemical quantification. The measured quantity resulting from the chemical quantification was the mass deposition rate per segment i of the analyzed compound α, denoted by , having the dimension unit mass per unit time.
can be computed by dividing the quantified mass mi,α of each compound α in segment i with the total exposure time t. Another quantity, more relevant for assessing the dosage delivered to biological tissues, is the deposition surface density rate denoted by
having the dimension unit mass per unit time per unit area.
is defined as
divided by the internal surface area, Ai, of the segment i. To allow for a comparison of the generated deposition data to published data in the literature, the deposition efficiency was calculated for each segment of the cast for the monodisperse glycerol aerosol experiment. Deposition efficiency is a dimensionless quantity used in the literature for deposition in in vitro lung cast models (Chan & Lippmann, Citation1980; Lizal et al., Citation2015; Zhou & Cheng, Citation2005). The deposition efficiency, ξα,i, of compound α and segment i is defined as the ratio between the mass of the particles deposited in segment i, and the total mass of the aerosol particles entering the segment. ξα,i can be calculated from the measured
using the expression:
(1)
(1)
where θ denotes the segments downstream of segment i, including the outlet connection segments (numbered 23–32), outlet tubes and filters. Moreover, instead of segment numbers, it is common to represent the sections in terms of their representative Stokes (St) number (Zhou & Cheng, Citation2005). The St number is a dimensionless number characterizing the dynamics of particles suspended in a fluid flow and can be calculated as:
(2)
(2)
for the lung cast segment i, where ρp is the intrinsic density of an aerosol particle of diameter dp, Ui is the average velocity in segment i having an equivalent diameter De,i, and μ is the dynamic viscosity of the fluid (Lizal et al., Citation2015). The average velocity in each segment can be calculated from the volumetric flow rates according to:
(3)
(3)
The St numbers for the monodisperse glycerol aerosol together with representative Reynolds numbers ( for both aerosol types, where ν is the kinematic viscosity of the aerosol) for the single generation segments are provided in . The thermophysical properties used for the dimensionless numbers were: ν = 1.56 × 10⁻⁵ m2/s and μ = 1.84 × 10⁻⁵ Pa s, representing air at 25 °C, and ρp = 1258 kg/m3 representing glycerol liquid density at 25 °C.
Table 3. Dimensionless numbers for each single generation segment of the lung cast for the monodisperse glycerol aerosol experiments.
Another quantity used to analyze the deposition of the analyzed compounds from the experiments was the regional deposition fraction, RDFα,i, defined as:
(4)
(4)
where Nc = 22. RDFα,i represents the amount of compound α that is deposited in segment i compared to the total deposited mass in all segments representing the airway geometry (i = 1,…,22). The data of the filters and filter holders were not included in the calculation of the RDFα,i, as especially the captured propylene glycol and nicotine were found to re-evaporate from the filters during the long exposure times and constant flow rates. Nevertheless, comparing the RDFα,i calculated from EquationEquation (4)
(4)
(4) for the various compounds gives an indication on how the different chemical compounds deposit in the cast segments as compared to each other.
Results and discussion
In this section, the results of the experiments carried out in this work are presented and discussed separately for the monodisperse glycerol aerosol and the multicomponent aerosol experiments.
Monodisperse glycerol aerosol experiment
The deposition of the monodisperse glycerol aerosol can be expressed in the mass deposition rate per segment, (α = glycerol). shows that among the airway cast segments (i = 1,…,22) the highest
was in the mouth cavity (i = 1) followed by the trachea segment (i = 2), whereas
was much lower in the smaller segments further down the airway. This is a consequence of the much larger available surface areas, Ai’s of the oral cavity and trachea segments as compared with those of bifurcations and bronchial tubes segments (see ). The 10 output connectors (i = 23,…,32) together with their attached filter holders and filters, shown in , account for more than 99% of the total deposited mass in the experiment. This indicates that only about 1% of the aerosol entering the mouth cavity was deposited in the first 7 generations of the lung cast for this particular aerosol and flow conditions.
Figure 4. Mass deposition rate, , of glycerol (α = glycerol) (a) per cast segments (i = 1,…,22), and (b) the deposition surface density rate per segment,
for the monodisperse glycerol aerosol experiments.
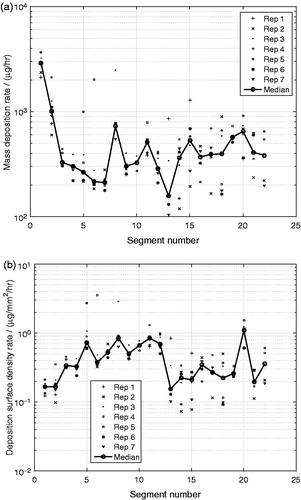
Figure 5. Mass deposition rate, , of glycerol (α = glycerol) per output connector segments (i = 23,…,32), in which the deposited mass extracted from the attached filter holders and filters were added for the monodisperse glycerol aerosol experiments.
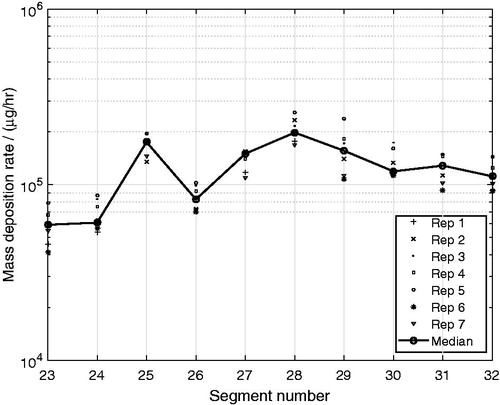
A more relevant measure for the aerosol deposition in the airways is the deposition surface density rate, , which relates to the concentration of the deposited matter on the internal surface of the lung cast segments. shows that the highest
took place in the upper bifurcations and bronchial tubes (i = 3,…,12) and in the segment i = 20, representing the 4th bifurcation on the right side of the lung (see ). Furthermore, the
was low in the oral cavity segment (i = 1) and in the trachea segment (i = 2), even though the deposition rates were high in . The deposition surface density rate was also relatively low in the segments i = 13,…,22, representing the 4th–7th airway generation, with the exception for segment i = 20, as mentioned previously.
The variability of the quantified deposition rate of glycerol was high between the seven replicates as shown in . This variability is most likely a consequence of the many manual handling steps of the experimental method. The manual extraction step for the complexly shaped segments was difficult to perform because of the small quantity of extraction solution that could be used to still be able to quantify the deposited mass by GC-MS analysis.
As mentioned previously, the lung cast was not electrically discharged prior to the aerosol exposures, even though the material may have contained a small electrostatic field by itself. The potential remaining image charge in the cast may have increased the deposition slightly despite the aerosol being charge neutralized. This potential effect should however be minor for the aerosol droplets in the monodisperse glycerol aerosol experiments, as electrostatic effects are most pronounced for sub-micrometer particles at low flow rates (Azhdarzadeh et al., Citation2015; Hickey, Citation2007).
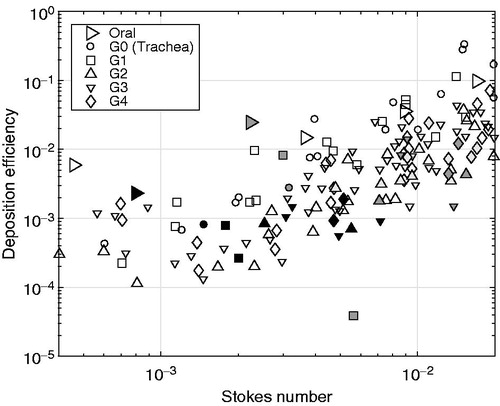
Another way to represent the deposition characteristics of the aerosol in the various segments is to convert the deposition data to the dimensionless quantity deposition efficiency, ξα,i, and the segment number to their respective representative St number. shows that despite the variability of the experiments, the quantified deposition efficiency agreed well with previously published in vivo as well as experimental in vitro lung cast deposition data by Cheng et al. (Citation1999), Chan & Lippmann (Citation1980), Zhou & Cheng (Citation2005) and Lizal et al. (Citation2015). For example, the deposition efficiency of the oral cavity segment, resulting from the monodisperse glycerol aerosol experiments, matches the trend set by the data of Cheng et al. (Citation1999) and Lizal et al. (Citation2015), as shown in . It is also shown in that the deposition efficiencies of the segments representing the trachea and the airway generations G1–G4 closely match the data by Chan & Lippmann (Citation1980), Zhou & Cheng (Citation2005) and Lizal et al. (Citation2015). For the segments incorporating multiple generations in the same segment (i = 13,…,22), no comparison with literature data could be done, due to a lack of equivalent literature data. The general agreement with the data by Lizal et al. (Citation2015), despite the larger particle size leading to larger St numbers in the experiments by Lizal et al. (Citation2015), is important as the lung casts used are identical and so are the computations of the dimensionless parameters from the segment flow rates and equivalent diameters of the various segments. In the works by Chan & Lippmann (Citation1980) and Zhou & Cheng (Citation2005), both the lung geometries (in vivo as well as another lung cast) and the conversion to representative dimensionless parameters are slightly different compared with those used in this study. For example, the lung cast models used by Lizal et al. (Citation2015) and in this work are more complex than in the works by Chan & Lippmann (Citation1980) and Zhou & Cheng (Citation2005) with more airway generations (7 compared to 4), realistic laryngeal structure and an integrated oral cavity. Moreover, the particle type used as well as the quantification methods applied are different for all studies. For example, Chan & Lippmann (Citation1980) and Zhou & Cheng (Citation2005) used solid particles and optical methods, Lizal et al. (Citation2015) used liquid-based aerosol particles and positron emission tomography, whereas liquid-based aerosol particles and chemical GC-MS analysis were used in our work to quantify the deposited mass of the monodisperse glycerol aerosol. The added model complexity and the differences in the aerosol particle types may explain the wider scatter in these data compared with those by Chan & Lippmann (Citation1980) and Zhou & Cheng (Citation2005). Nevertheless, the ξα,i values generated from the monodisperse glycerol aerosol experiments were shown to represent the published data well, which gives confidence in the experimental method developed to determine the regional deposition in our lung cast model using a chemical quantification method suitable to detect multiple chemical components in the extracted deposited matter.
Figure 6. Deposition efficiency, ξα,i, for the oral cavity, the trachea (G0) and the segments representing generations G1–G4 as a function of the local Stokes number for the monodisperse glycerol aerosol experiments (α = glycerol). Symbols of different colors represent data from different sources: the present study (black), Zhou & Cheng (Citation2005) (white), Chan & Lippmann (Citation1980) (light gray) and Lizal et al. (Citation2015) (dark gray). The only exception is the white symbols for the oral segment representing the data extracted from Cheng et al. (Citation1999).
Multicomponent aerosol experiment
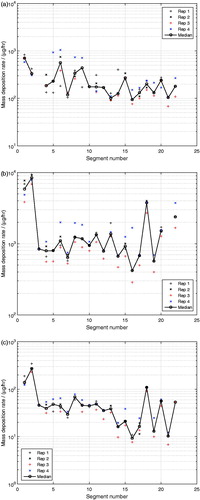
Having established confidence in the developed experimental method by validating the deposition efficiency of a single-compound aerosol generated under controlled conditions, the method was further applied to the exposure of the lung cast using a multicomponent aerosol. As shown in , the mass deposition rates, , for glycerol (), propylene glycol () and nicotine () show similar deposition patterns, although of different magnitudes for all three compounds with respect to the cast segments.
of glycerol in segment i = 3 and of propylene glycol in segment i = 21, were outside of the calibration ranges and are therefore missing in , respectively. In the monodisperse glycerol aerosol experiments, the oral cavity (i = 1) experienced a significantly higher
than the other cast segments, whereas this effect was less apparent in the multicomponent aerosol experiments for any of the compounds, as shown in . The reduced deposition rate in the upper segments of the cast for the multicomponent aerosol, where the flow rates were the highest, indicates that the more than 4 times smaller aerosol droplets in the multicomponent aerosol experiments (MMAD of 0.5 μm) were less prone to deposit by inertial effects than the larger droplets (MMAD of 2.3 μm) in the monodisperse glycerol aerosol experiments. The magnitudes of the mass deposition rates of glycerol were very similar between the monodisperse glycerol aerosol and the multicomponent aerosol experiments, except for the oral cavity (i = 1) as discussed previously. The
of propylene glycol was significantly higher than for glycerol and the
of nicotine was the lowest of all three analyzed compounds in the multicomponent aerosol experiments. These results are direct consequences of the composition of the nebulized liquid mixture, in which propylene glycol and nicotine were the most and the least abundant compounds, respectively. As shown in , the variability of the measured
, for all three compounds were similar to the variability in the monodisperse glycerol aerosol experiments. This gives confidence that the developed method is also suitable for quantifying the deposited masses of compounds coming from exposures of multicomponent aerosols. The lack of temperature control of the cast model may have resulted in vapor condensation onto the walls of the cast model. This potential vapor condensation may also have contributed to the measured deposition, despite the low volatility of the three compounds measured. Evaporation of propylene glycol from the nebulized aerosol droplets, but also for nicotine, may have however occurred during the dilution step in the mixing unit. Thanks to the chemical quantification of the extracted deposited matter adopted in this work, the developed methodology also accounts for vapor condensation in addition to droplet deposition. This is an important benefit of the developed method, especially in the context of toxicological assessments, where the total dosing (including both vapor absorption and aerosol droplet deposition) contributes to the toxicological activity. Even though the aerosol was charge neutralized, image charges induced by the cast material itself may also have contributed to the aerosol droplet deposition, especially for the lower branches where the flow rates are the lowest (Azhdarzadeh et al., Citation2015; Hickey, Citation2007). The effect of potential image charges in the cast model on the deposition is difficult to estimate and represents a limitation of the present cast model.
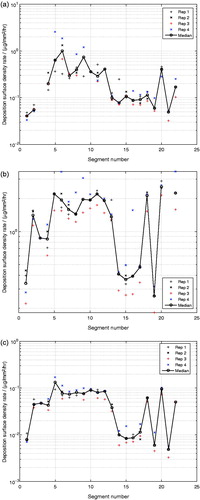
Figure 7. Mass deposition rate per segment, , of (a) glycerol, (b) propylene glycol and (c) nicotine from exposure with a multicomponent aerosol.
As shown in , for glycerol and propylene glycol was similar on the outlet filters, even though the mass concentration of propylene glycol, measured directly after the nebulizer, was 1.8 times that of glycerol. Moreover, the mass deposition rate of glycerol were found to be on average 69 times that of nicotine on the filters (see ), whereas the mass concentration of glycerol, measured directly after the nebulizer, was 14 times that of nicotine. This indicates that most likely, the propylene glycol and the nicotine that were captured on the outlet filters most likely re-evaporated from the filters during the long exposure under constant flow rates. The observed equality between the deposited propylene glycol and glycerol for the outlet filters was not seen for the cast segments, as shown in . This indicates that even though some re-evaporation may have occurred from the deposited mass on the cast segments, no compound-specific effects on the measured deposition rates on these segments were observed. This is also confirmed by the regional deposition fraction RDFα,i for each compound, presented below.
Figure 8. Mass deposition rate, , of glycerol, propylene glycol and nicotine per output connector segments (i = 23,…,32), in which the deposited mass extracted from the attached filter holders and filters were added for the multicomponent aerosol experiments.
As shown in , the deposition surface density rate, , for all three compounds showed similar patterns over all the segments of the cast as the monodisperse glycerol aerosol. The highest
was observed in the bifurcations and smaller segments (i = 5,…,12).
Figure 9. Deposition surface density rate per segment, , of (a) glycerol, (b) propylene glycol and (c) nicotine from exposure with a multicomponent aerosol.
To estimate potential differences between the deposition of the different chemical compounds analyzed, the regional deposition fraction RDFα,i was calculated from EquationEquation (4)(4)
(4) for each of the three quantified compounds of the multicomponent aerosol and for the glycerol in the monodisperse glycerol aerosol experiments. As especially propylene glycol and nicotine were shown to re-evaporate from the output filters during the multicomponent aerosol experiments, the deposited mass on the filters were not included in the calculations. As shown in , the RDFα,i of each analyzed chemical compound in the multicomponent aerosol experiments, and also the glycerol in the monodisperse glycerol aerosol experiments, were all overlapping, showing the same general pattern for all quantified compounds. This indicates that the deposition of the analyzed compounds of the multicomponent aerosol deposit in a similar way, presumably as part of multicomponent aerosol droplets.
Figure 10. Regional deposition fraction per segment, RDFα,i, for glycerol, propylene glycol and nicotine for the multicomponent aerosol (black) and the monodisperse glycerol aerosol (red). The individual gray and light red symbols represent the individual experimental points, whereas the symbols connected by a line represent the median values for the respective compound.
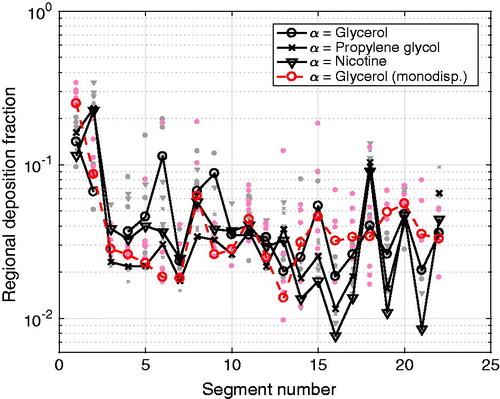
As shown in , the highest regional deposition fraction for all three compounds from the multicomponent aerosol experiments were found in the upper part of the airways (i = 1, 2) and in one of the complex segments (i = 18) covering the 5th–7th generation. For the monodisperse glycerol aerosol experiments, highest regional deposition fractions were found in the oral cavity (i = 1) and in the trachea segment (i = 2). Despite the generally common trend between the RDFα,i patterns for the monodisperse glycerol aerosol and the multicomponent aerosol experiments, it can be observed that the RDFα,i of the multicomponent aerosol shows a more fluctuating pattern with respect of the segment number. This more fluctuating pattern is similar for all three compounds, but especially for glycerol. This indicates that the difference in the segment geometries and the internal flow condition inside the segments were important driving factors for deposition, irrespectively of the type of the chemical compound in the multicomponent aerosol.
The applicability of the developed method is not limited to the two aerosols and the chemical compounds analyzed in this work. The experimental method can be applied to other single-component and multicomponent aerosols, as long as there is a sufficient amount of the deposited compound in the collected extraction solution to give a reliable signal during the GC-MS analysis and that the chemical compounds are chemically stable at the operating temperature to avoid significant evaporation during handling. Compared with the methods used in other deposition studies, this method benefit from being able to determine and quantify multiple liquid-based deposited compounds, which makes it suitable for deposition studies of multicomponent aerosols, such as electronic cigarette aerosols. Moreover, as mentioned previously, thanks to the chemical quantification of the extracted deposited matter adopted in this work, the developed methodology also accounts for vapor condensation in addition to droplet deposition. This is important for toxicological assessments, as the total amount of the deposited chemical compounds contributes to the toxicological activity at the deposition location. Further improvements of the method include the integration of temperature and humidity control, as well as realistic wall treatments on the cast segments to better represent realistic condition in the human airways.
Conclusions
In this work, an experimental method to determine regional deposition of multicomponent aerosols in a segmented, realistic human lung geometry was developed and applied to two aerosols, namely a monodisperse glycerol aerosol and a multicomponent aerosol. The method comprised the following steps: (1) lung cast model preparation, (2) aerosol generation and exposure, (3) extraction of deposited mass, (4) chemical quantification and (5) data processing. The chemical quantification using GC-MS can quantify the deposition of glycerol, propylene glycol and nicotine from the extracted mass of the deposited aerosol. The developed method is not restricted to these compounds, and the deposition of other compounds having relatively low volatility may be quantified. This work therefore forms the basis for future investigations of the deposition of electronic cigarette aerosols.
To validate the methodology, the deposition efficiency of a monodisperse glycerol aerosol, with a MMAD of 2.3 μm, exposing the segmented lung cast at a constant flow rate of 15 L/min was used. The generated data showed good agreement to published literature data for the deposition efficiency. The deposition surface density rate over all segments was variable with highest values in the bifurcation segments and smaller segments (i = 5,…,12). This result indicates that inertial impaction was the dominating deposition mechanism in the monodisperse glycerol aerosol experiments.
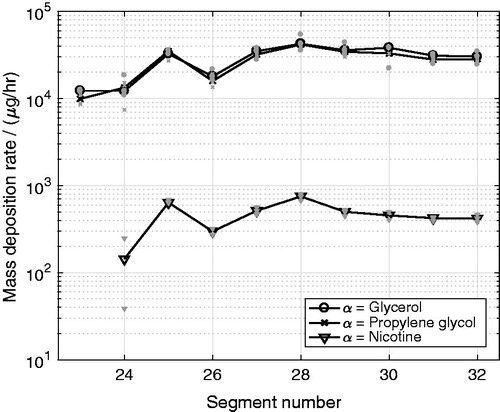
The experimental method was also applied to determine the deposition of a nebulized multicomponent aerosol in the segmented lung cast at the same flow conditions as for the monodisperse glycerol aerosol experiments. The deposited amounts of glycerol, propylene glycol and nicotine were quantified. The deposition surface density rates of the three compounds showed similar deposition patterns as that of the monodisperse glycerol aerosol. Moreover, the regional deposition fraction of each component indicated that most of the deposited mass of the three analyzed compounds of the multicomponent aerosol were likely deposited as parts of the same multicomponent aerosol droplets.
To summarize, an experimental method was developed and applied to determine regional deposition of multicomponent aerosols in a segmented replica of the human respiratory tract. This method has the potential to: (1) provide understanding of the deposition characteristics in the human airways for different flow conditions and multicomponent liquid-based aerosols, such as those generated by electronic cigarettes, (2) correlate the dosage in human airways with that of in vitro exposure systems for toxicological assessments, and (3) provide reliable experimental deposition data for validation of aerosol deposition simulations using CFD. The developed experimental method has the capability to quantify the total deposited mass from both the aerosol particle deposition and the vapor phase condensation, which is beneficial for predictions of the dosing for toxicological assessments. Future application of the developed method includes investigations of the deposition characteristics of electronic cigarette aerosols under conditions of temperature and humidity control.
Acknowledgements
The research described in this report was funded by Philip Morris Products S.A., Switzerland (part of Philip Morris International (PMI) group of companies) and supported by the Brno University of Technology (BUT) project FSI-S-14-2355.
Disclosure statement
This research was conducted by PMI and BUT employees and with PMI funding. The authors had full access to all research data and ensure their integrity as well as the accuracy of the data analysis.
Additional information
Funding
References
- Azhdarzadeh M, Olfert JS, Vehring R, Finlay WH. (2015). Effect of electrostatic charge on deposition of uniformly charged monodisperse particles in the nasal extrathoracic airways of an infant. J Aerosol Med Pulm Drug Deliv 28:30–4.
- Balásházy I, Hofmann W, Heistracher T. (2003). Local particle deposition patterns may play a key role in the development of lung cancer. J Appl Physiol 94:1719–25.
- Belka M, Lippay J, Lizal F, et al. (2014). Comparison of methods for evaluation of aerosol deposition in the model of human lungs. EPJ Web Confer 67:02006.
- Chan TL, Lippmann M. (1980). Experimental measurements and empirical modelling of the regional deposition of inhaled particles in humans. Am Ind Hyg Assoc J 41:399–409.
- Cheng YS. (2012). Aerosol deposition in the extrathoracic region. Aerosol Sci Technol 37:659–71.
- Cheng YS, Zhou Y, Chen B. (1999). Particle deposition in a cast of human oral airways. Aerosol Sci Tech 31:286–300.
- Comouth A, Saathoff H, Naumann KH, et al. (2013). Modelling and measurement of particle deposition for cell exposure at the air-liquid interface. J Aerosol Sci 63:103–14.
- Elcner J, Lizal F, Jedelsky J, et al. (2016). Numerical investigation of inspiratory airflow in a realistic model of the human tracheobronchial airways and a comparison with experimental results. Biomech Model Mechanobiol 15:447–69.
- European Parliament, (2010). Directive 2010/63/EU of the European Parliament and of the council of 22 September 2010 on the protection of animals used for scientific purpose. Official J Eur Union L276:33–79.
- Ghosh D, Jeannet C. (2014). An improved Cambridge filter pad extraction methodology to obtain more accurate water and tar values: In situ Cambridge filter pad extraction methodology. Beitrge Zur Tabakforschung/Contrib Tob Res 26:38–49.
- Golshahi L, Noga ML, Vehring R, Finlay WH. (2013). An in vitro study on the deposition of micrometer-sized particles in the extrathoracic airways of adults during tidal oral breathing. Ann Biomed Eng 41:979–89.
- Grgic B, Finlay W, Burnell P, Heenan A. (2004a). In vitro intersubject and intrasubject deposition measurements in realistic mouththroat geometries. J Aerosol Sci 35:1025–40.
- Grgic B, Finlay W, Heenan A. (2004b). Regional aerosol deposition and flow measurements in an idealized mouth and throat. J Aerosol Sci 35:21–32.
- Hickey AJ. (2007). Inhalation aerosols: physical and biological basis for therapy. New York: CRC Press.
- Hinds H. (1999). Aerosol technology: properties, behavior, and measurement of airborne particles. 2nd ed. New York: John Wiley & Sons Inc.
- Iskandar AR, Martin F, Talikka M, et al. (2013). Systems approaches evaluating the perturbation of xenobiotic metabolism in response to cigarette smoke exposure in nasal and bronchial tissues. Biomed Res Int 2013:512086.
- Kreyling W, Hirn S, Schleh C. (2010). Nanoparticles in the lung. Nat Biotechnol 28:1275–6.
- Lizal F, Belka M, Adam J, Jedelsky J, Jicha M. (2015). A method for in vitro regional aerosol deposition measurement in a model of the human tracheobronchial tree by the positron emission tomography. Proc Inst Mech Eng H J Eng Med 229:750–7.
- Lizal F, Elcner J, Hopke P, et al. (2012). Development of a realistic human airway model. Proc Inst Mech Eng H J Eng Med 35:84–92.
- Longest P, Holbrook L. (2012). In silico models of aerosol delivery to the respiratory tract - development and applications. Adv Drug Deliv Rev 64:296–311.
- Mathis C, Poussin C, Weisensee D, et al. (2013). Human bronchial epithelial cells exposed in vitro to cigarette smoke at the air-liquid interface resemble bronchial epithelium from human smokers. Am J Physiol Lung Cell Mol Physiol 304:L489–503.
- Neilson L, Mankus C, Thorne D, et al. (2015). Development of an in vitro cytotoxicity model for aerosol exposure using 3D reconstructed human airway tissue; application for assessment of e-cigarette aerosol. Toxicol in Vitro 29:1952–62.
- Paur HR, Cassee F, Teeguarden J, et al. (2011). In vitro cell exposure studies for the assessment of nanoparticle toxicity in the lung ssue; application for assessment of e-cigarett. J Aerosol Sci 42:668–92.
- Schiffelers MJWA, Blaauboer BJ, Hendriksen CFM, Bakker WE. (2012). Regulatory acceptance and use of 3R models: a multilevel perspective. Altex 29:287–300.
- Schlage WK, Iskandar AR, Kostadinova R, et al. (2014). In vitro systems toxicology approach to investigate the effects of repeated cigarette smoke exposure on human buccal and gingival organotypic epithelial tissue cultures. Toxicol Mech Methods 24:470–87.
- Schmidt A, Zidowitz S, Kriete A, et al. (2004). A digital reference model of the human bronchial tree. Comput Med Imaging Graph 28:203–11.
- Sosnowski T, Moskal A, Gradon L. (2006). Dynamics of oropharyngeal aerosol transport and deposition with the realistic flow pattern. Inhal Toxicol 18:773–80.
- Srirama PK, Wallis CD, Lee D, Wexler AS. (2012). Imaging extra-thoracic airways and deposited particles in laboratory animals. J Aerosol Sci 45:40–9.
- Tippe A, Heinzmann U, Roth C. (2002). Deposition of fine and ultrafine aerosol particles during exposure at the air/cell interface. J Aerosol Sci 33:207–18.
- Zhang Y, Finlay W, Matida E. (2004). Particle deposition measurements and numerical simulation in a highly idealized mouththroat. J Aerosol Sci 35:789–803.
- Zhou Y, Cheng YS. (2005). Particle deposition in a cast of human tracheobronchial airways. Aerosol Sci Tech 39:492–500.