
Abstract
Objective
To develop a stochastic five-lobe lung model and to compute particle deposition fractions in the five lobes, considering anatomical as well as ventilatory asymmetry.
Materials and methods
The stochastic five-lobe lung model was derived from an existing stochastic model for the whole lung, which implicitly contains information on the lobar airway structure. Differences in lobar ventilation and sequential filling of individual lobes were simulated by a stochastic lobar ventilation model. Deposition fractions of inhaled unit density particles in the five lobes were calculated by an updated version of the Monte Carlo deposition code Inhalation, Deposition, and Exhalation of Aerosols in the Lung (IDEAL).
Results
Simulations for defined exposure and breathing conditions revealed that the two lower lobes receive higher deposition and the two upper lobes lower deposition, compared to the average deposition for the whole lung. The resulting inter-lobar distribution of deposition fractions indicated that the non-uniform lung morphometry is the dominating effect, while non-uniform ventilation only slightly enhances the lobar differences. The relation between average lobe-specific deposition fractions and corresponding average values for the whole lung allowed the calculation of lobe-specific deposition weighting factors.
Discussion
Comparison with limited deposition measurements for upper vs. lower (U/L) and left vs. right (L/R) lobes revealed overall agreement between experimental and theoretical data. Calculations of the L/R deposition ratio for inhaled aerosol boli confirmed the hypothesis of Möller et al. that the right lung is less able to expand at the end of a breath because of the restrictive position of the liver.
Introduction
Lung diseases caused by the inhalation of particulate matter have often been reported to occur at specific sites in the lung, particularly within specific lobes. For example, Parkash (Citation1977) found that lung carcinomas are more likely to develop in the right than in the left lung, and more likely in the upper than in the lower lobes. He further postulated that this site specificity ought to correlate more with localized deposition patterns than with biological-hematogenic factors. Likewise, Sahmoun et al. (Citation2005) observed that primary small cell lung cancer has a predilection for the right rather than the left lung. Among the 978 patients treated for lung cancer, the highest percentage (35%) of non-small cell carcinoma was detected in the right upper (RU) lobe (Kudo et al. Citation2012). In addition, lung tumors were preferentially found in the upper lobes as well as in the right lung. These pathological findings suggest that the reported lobar site selectivity may result from non-uniform particle deposition patterns among the five lobes of the lung. This non-uniformity of lobar deposition may be related not only to lobe-specific anatomical differences, but also to non-uniform, lobe-specific lung ventilation patterns. For example, Bennett et al. (Citation1998, Citation1999) and Möller et al. (Citation2009) attributed the measured left/right asymmetry of deposition in shallow bolus experiments to asymmetric ventilation distributions. Thus, for risk assessment purposes, particle deposition patterns ought to be determined for each individual lobe, rather than to predict average deposition fractions for the whole lung.
At present, experimental data on lobar deposition patterns in the human lung have not been reported. Thus this information can currently only be provided by computational particle deposition models, which are based on an asymmetric lobar airway geometry, such as the five-lobe lung models of Yeh and Schum (Citation1980) and Asgharian et al. (Citation2001), or the stochastic lung model of Koblinger and Hofmann (Citation1985, Citation1990). Based on their five-lobe model, Yeh and Schum (Citation1980) were the first to compute particle deposition in the different lobes, assuming uniform lung ventilation. Chang and Yu (Citation1999) developed a mathematical model of the ventilation distribution using a five-lobe airway model, which predicted ventilation differences between upper and lower lobes. This modeling approach was subsequently extended by Subramaniam et al. (Citation2003) to simulate lobar particle deposition patterns. Later, Asgharian et al. (Citation2006) investigated the effect of realistic models of lung ventilation on lobar deposition patterns. For the analysis of bolus dispersion in the human lung, Hofmann et al. (Citation2008) developed a ventilation model which simulates the asymmetric and asynchronous ventilation of the various lung lobes in a stochastic, asymmetric lung structure.
Thus the objectives of this study are (i) to develop a stochastic five-lobe lung model based on the stochastic model for the whole lung (Koblinger and Hofmann Citation1985, Citation1990), (ii) to compute particle deposition fractions in the five lobes with an updated version of the Monte Carlo deposition code Inhalation, Deposition, and Exhalation of Aerosols in the Lung (IDEAL) (Hofmann and Koblinger Citation1990; Koblinger and Hofmann Citation1990), considering anatomical as well as ventilatory asymmetry, (iii) to derive lobe-specific deposition weighting factors relative to uniform deposition throughout the whole lung, and (iv) to compare predicted lobar deposition fractions with the available, though very limited, theoretical, and experimental evidence.
Materials and methods
Five-lobe morphometric model of the human lung
The five-lobe model of the human lung is based on a stochastic morphometric model of the human lung (Koblinger and Hofmann Citation1985, Citation1990), which implicitly contains information on the lobar airway structure. The stochastic, asymmetric morphometric model describes the inherent asymmetry and variability of the human airway system in terms of probability density functions of airway diameters, lengths and branching angles, and correlations among some of the morphometric parameters (Koblinger and Hofmann Citation1985).
The bronchial airway structure of the stochastic, asymmetric five-lobe lung model is based on the extensive morphometric measurements of Raabe et al. (Citation1976), where airway dimensions and angles of the bronchial region were recorded for the trachea and all bronchial airways down to about airway generation 10, while only 10 − 25% of bronchiolar airways down to the terminal bronchioles were measured. To construct a complete stochastic asymmetric bronchial tree model, measured airway diameters, lengths, branching, and gravity angles were statistically analyzed in terms of frequency distributions and correlations among several parameters (Koblinger and Hofmann Citation1985). Since the location of each bronchial airway in the morphometric data is classified by a binary identification number, this data set is the only currently available morphometric data base which allows the construction of a stochastic lobar lung model. The morphometrically observed branching asymmetry and variability of airway dimensions lead to highly variable pathlengths from the trachea to the terminal bronchioles. For example the shortest path comprises 11 generations and the longest path 21 generations. As a result, intermediate airway generations are composed of bronchial and alveolated airways at variable degrees of superposition. For a detailed description of the stochastic bronchial airway model, the reader is referred to the original papers of Koblinger and Hofmann (Citation1985, Citation1990).
The corresponding stochastic model of the acinar airways is based on the morphometric data of Haefeli-Bleuer and Weibel (Citation1988), supplemented by morphometric data from other sources (Hansen and Ampaya Citation1975; Schreider and Raabe Citation1981). While the stochastic acinar airway structure is the same in all lobes, acinar diameters and lengths in each lobe are determined by the diameter distributions of the terminal bronchioles supporting a given lobe. Furthermore, the number of terminal bronchioles in a given lobe determines the number of acinar airways in that lobe and, in further consequence, the lobar volume.
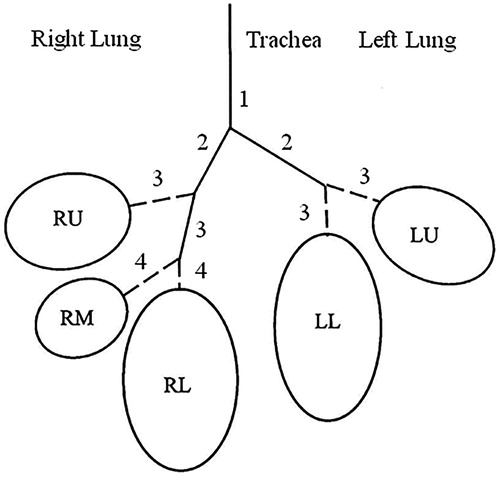
The human lung is composed of five lobes, three in the right lung and two in the left lung: right upper lobe (RU), right middle lobe (RM), right lower lobe (RL), left upper lobe (LU), and left lower lobe (LL) (). In contrast to the five-lobe model of Yeh and Schum (Citation1980), which includes all airways leading to the individual lobes, the present lobar lung model contains only the intra-lobar airways, i.e. if the trachea is denoted as generation 1, lobes RU, LU, and LL start with generation 3 and lobes RM and RU with generation 4 ().
Figure 1. Schematic representation of the five lobes of the human lung. Lung lobes are denoted as left upper lobe (LU), left lower lobe (LL), right upper lobe (RU), right middle lobe (RM), and right lower lobe (RL).
For the construction of main and lobar bronchi, the ratios of the parent cross-section to the combined cross-section of both daughters were derived from the morphometric data of Raabe et al. (Citation1976, varying from 0.802 (LL) to 1.15 (RM). These values were interpreted as geometric means of lognormal probability density functions, while the related geometric standard deviations were derived from the analysis of the morphometric data in downstream bronchial airways which differ only slightly among the various generations (truncation level: 2 GSD). These differences in cross-section ratios lead to different numbers of bronchial airway generations in each lobe. The average numbers of bronchial airway generations in each lobe, listed in , represent the arithmetic means of the distributions of all bronchial airway generations, ranging from 11 to 21 (Koblinger and Hofmann Citation1985).
Table 1. Lobar volumes, effective lobar bronchial surface areas, and average number of bronchial airway generations of the five lobes of the human lung, normalized to a Functional Residual Capacity (FRC) of 3300 cm3 (International Commission on Radiological Protection (ICRP) Citation1994).
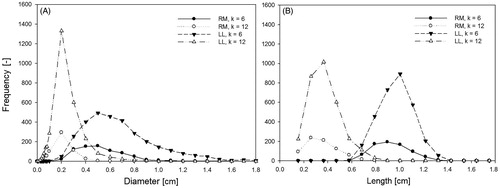
As a result of the volumetric differences, distributions of airway diameters and lengths vary among the five lobes. For comparison, all other structural parameters and correlations derived for the whole lung also apply to each individual lobe. To illustrate these lobar differences, distributions of airway diameters and lengths in generations 6 (bronchi) and 12 (bronchioles) are plotted in for diameters (panel A) and lengths (panel B) in the LL and RM lobes, thus ranging from the largest to the smallest lobe, based on 10,000 simulations of random particle paths. The observation that airway diameters and lengths in the LL lobe are significantly greater than the corresponding airway dimensions in the RM lobe reflects differences in lobar volume. Both diameter and length distributions can be approximated by lognormal distributions, although they are less skewed as compared to the corresponding distributions for the whole lung (Koblinger and Hofmann Citation1985), where the superposition of the individual lobar distributions leads to distinct lognormal distributions on mathematical grounds. Due to differences in lobar volume by about a factor 4, the number of airways in generations 6 and 12 in the two lobes also varies by about that same factor.
Figure 2. Distributions of airway diameters (panel A) and lengths (panel B) in generations k = 6 (bronchi) and k = 12 (bronchioles) in the LL lobe (largest volume) and the RM lobe (smallest volume). Median diameters are 8.7 mm (GSD = 1.4) for k = 6 and 6.3 mm (GSD = 2.4) for k = 12 in the LL lobe, and 4.3 mm (GSD = 1.5) for k = 6 and 1.2 mm (GSD = 1.9) for k = 12 in the RM lobe, respectively. Median lengths are 9.8 mm (GSD = 1.1) for k = 6 and 7.4 mm (GSD = 1.8) for k = 12 in the LL lobe, and 8.6 mm (GSD = 1.2) for k = 6 and 2.7 mm (GSD = 1.6) for k = 12 in the RM lobe, respectively. Airway diameters and lengths are based on the morphometric measurements of Raabe et al. (Citation1976) applying a linear scaling factor of 0.84 to represent FRC dimensions.
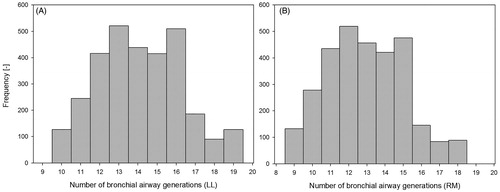
In addition to lobar differences in airway diameters and lengths, differences in lobar volume are also caused by differences in the number of bronchial airway generations from the entrance to the lobe to the terminal bronchioles in each lobe. For example, distributions of the number of intra-lobar bronchial airway generations in the LL and RM lobes are illustrated in based 10,000 simulations of random particle paths. Related median generation numbers are 14.1 (GSD = 1.17) in the LL lobe, starting with generation 3, and 12.6 (GSD = 1.18) in the RM lobe, starting with generation 4. The number of intra-lobar bronchial airway generations determines the number of terminal bronchioles in each lobe and, in further consequence, the number of acinar airways and hence lobar volume.
Figure 3. Distributions of the number of intra-lobar bronchial airway generations in the LL lobe (panel A) and RM lobe (panel B). Median generation numbers are 14.1 (GSD = 1.17) in the LL lobe and 12.6 (GSD = 1.18) in the RM lobe.
While lobar volumes are based on actual morphometric airway dimensions in each lobe, effective lobar surface areas in this study are related to the corresponding deposition pattern (Hofmann et al. Citation2006), i.e. effective lobar surface areas represent the sum of the surface areas of individual airways which actually experience a deposition event, weighted by the relative number of particles deposited there. As a result of the preference of particle paths along the major daughter airways at asymmetric airway bifurcations, effective bronchial surface areas are higher than the morphometric surface areas based on the measured airway dimensions. Average effective lobar bronchial surface areas for uniform and non-uniform ventilation conditions are listed in , based on 10,000 simulations of random particle paths. Since uniform and non-uniform ventilation produce different lobar deposition patterns, resulting effective lobar surface areas also differ from each other. Although the deposition patterns and hence effective bronchial surface areas refer to specific exposure conditions, variations of inhaled particle diameters hardly affected the resulting surface areas. The lobar volumes listed in represent computed average lobar volumes of the stochastic lung geometry, assuming that the number of alveoli is proportional to the number of terminal bronchioles in each lobe.
Since the bronchial airway dimensions of Raabe et al. (Citation1976) reportedly refer to a total lung capacity (TLC) of 5563.88 cm3 (Yeh and Schum Citation1980), all bronchial airway diameters and lengths were scaled down to a standard functional residual capacity (FRC) of 3300 cm3 for an adult male (International Commission on Radiological Protection (ICRP) Citation1994), assuming a constant scaling factor of 0.84, defined by the cube root of the ratio of FRC to TLC. No scaling procedure was applied to the acinar data of Haefeli-Bleuer and Weibel (Citation1988) as they already represent FRC dimensions. With the exception of the trachea and the main and lobar bronchi, which are assumed to be rigid structures, an additional linear scaling procedure was applied to diameters and lengths of downstream bronchial and acinar airway generations to account for the roughly linearly increasing and decreasing lung volume during inspiration and expiration of tidal volume VT (Hofmann Citation2011).
Lobar ventilation model
Upon inhalation, the distribution of the airflow among the different lobes, and hence the probability of a particle entering a given lobe, depends on the respective lobar volume, based on the assumption that the number of alveoli in a given lobe is proportional to the volume of that lobe (Yeh and Schum Citation1980). Since the present stochastic lobar lung model and the single-path five-lobe model of Yeh and Schum (Citation1980) are both derived from the morphometric data of Raabe et al. (Citation1976), flow splitting among the different lobes is based on the lobar volumes provided by Yeh and Schum (Citation1980), corrected for the extra-lobar airways. This correlation between lobar volume and lobar flow has experimentally been confirmed by measurements of the lobar distribution of inhaled air in several patients with a wide range of FRCs by SPECT/CT methods (De Backer et al. Citation2010).
The asymmetric branching pattern at airway bifurcations in the stochastic lung model automatically introduces an inherent ventilation inhomogeneity within each lobe. Flow partitioning at bronchial airway bifurcations within a given lobe is computed as the ratio of the cross-sectional areas of the major and minor branches. This ratio is then modified by the relationship between flow asymmetry and area asymmetry proposed by Phillips and Kaye (Citation1997), which was also derived from the morphometric data of Raabe et al. (Citation1976), assuming that the flow rate through each branch is proportional to the respiratory volume it supplies. Depending on parent airway diameter and branching angles of the major and minor daughter airways, the exponent of the diameter ratio varies between 2 and 3. Note that total and lobar deposition fractions are hardly affected by the choice of the diameter exponent.
In addition to the above morphometry-based ventilation asymmetry within lobes, differences in ventilation between different lobes of the lung (asymmetry) and sequential filling of different lobes (asynchrony) observed experimentally were simulated by a stochastic lobar ventilation model (Hofmann et al. Citation2008). Since this model has been described in detail in Hofmann et al. (Citation2008), only some salient features will be discussed here for the sake of the reader.
Ventilation asymmetry, i.e. lower lobes are ventilated more efficiently than upper lobes, is simulated by two ventilation coefficients for the upper and lower lobes, based on upper and lower lobar volumes and experimental asymmetry factors. By convention, the upper lobes RU and LU refer to the upper region of the lung and the lower lobes RL and LL correspond to the lower region of the lung, while the RM volume is equally distributed between the upper and the lower lung. Ventilation asymmetry leads to a higher flow to the lower lobes and to a lower flow to the upper lobes compared to the flow distribution based on lobar volumes.
Ventilation asynchrony, i.e. upper lobes are ventilated more rapidly than lower lobes, is simulated by two time-dependent linear ventilation functions for the upper and lower lobes, based on upper and lower asymmetry coefficients and experimental asynchrony factors. As a result of ventilation asynchrony, airflow into the upper lobes is highest at the beginning of inspiration, while airflow into the lower lobes is highest at the end of inspiration.
This lobar ventilation model was validated by comparison with the experimental data of Brand et al. (Citation1997) on aerosol bolus dispersion and deposition in human volunteers (Hofmann et al. (Citation2008)). The excellent agreement with these experimental data represents a reliable basis for the simulation of lobar deposition patterns.
For subsequent deposition calculations, two different ventilation scenarios were distinguished: (i) uniform ventilation, where all lobes are uniformly ventilated, hence exhibiting only the effect of the morphological asymmetry, and (ii) non-uniform ventilation, where the additional effects of ventilation asymmetry and asynchrony are considered, hence displaying the combined effect of non-uniform lung morphology and ventilation.
Stochastic particle transport and deposition model IDEAL
The present calculations of inhaled particle deposition patterns in individual lobes of the human lung are based on an updated version the stochastic particle deposition model IDEAL initially developed by Koblinger and Hofmann (Citation1990) and Hofmann and Koblinger (Citation1990, Citation1992). Since the publication of the first version of the IDEAL deposition model, the code has been continuously modified, extended, and applied to different exposure situations (Hofmann et al. Citation1999, Citation2002, Citation2005, Citation2006, Citation2008, Citation2009; Pichelstorfer et al. Citation2013; Winkler-Heil et al. Citation2014).
In the Monte Carlo transport and deposition model, the random walk of inhaled particles through the stochastically generated airway system is simulated by randomly selecting a sequence of airways for each individual particle. At each asymmetric airway bifurcation, the major and minor daughter parameters are randomly selected from the related frequency distributions (diameters, lengths, branching, and gravity angles) and the various correlations by Monte Carlo methods along the path of an inhaled particle in an iterative manner, interpreting the frequency distributions as probability density functions.
In the case of a deposition event, which would terminate the path of an inhaled particle, deposition in a given airway is simulated by decreasing its statistical weight in subsequent airways. The contribution of a deposition event to the deposition fraction in a given airway is then determined by the product of the actual statistical weight times the deposition efficiency in that airway. For the calculation of particle deposition fractions in individual airways, the deposition equations used in the present simulations are compiled in the Appendix.
Particles are inhaled at random times during the inspiration phase. In conductive airways, the time for a particle to pass through a selected airway depends on the air velocity in that airway and its length, modified by a random time interval representing convective mixing. For cylindrical airways, the convective mixing process is expressed by an effective axial diffusivity, which differs for inspiration and expiration (Hofmann et al. Citation2008). In the acinar region, the random selection of the residence time in an alveolated airway depends on the effective dispersion coefficient proposed by Scherer et al. (Citation1975).
The velocity of a particle in cylindrical airways under laminar flow conditions is randomly selected from the parabolic flow profile to simulate the effect of secondary flows on radial mixing within bifurcations (Hofmann et al. Citation2001, Citation2008). In alveolated airways, the flow velocity is further reduced by the fact that a fraction of the inhaled air is drawn into alveoli upon inspiration, causing a continuous decline of the flow rate (Hofmann et al. Citation2008). During the expiratory phase, a uniform flow profile is adopted to account for secondary expiratory flows (Hofmann et al. Citation2001).
The probability that a given air volume element enters an alveolus is randomly selected from the ratio of the flow into the alveoli of a given acinar airway to the total flow entering that airway. The flow into an alveolus depends on the difference of alveolar volumes between the contracted and expanded state, which is determined by the inflated and deflated alveolar diameters, multiplied by the degree of alveolization in that generation (Weibel Citation1963). The minimum alveolar diameter representing the deflated state of an alveolus at the end of expiration is assumed to be 233 µm, which increases to 250 µm at the end of inhalation under resting breathing conditions (Balásházy et al. Citation2008). The relationship between alveolar expansion and physical activity is modeled by a linear function, starting from a maximum alveolar diameter of 250 µm for resting breathing conditions (VT = 750 mL) up to a maximum diameter of 273 µm for heavy exercise (VT = 1923 mL) (Balásházy et al. Citation2008).
Flow-induced chaotic mixing of tidal air with residual air within an alveolus due to the rhythmical expansion and contraction of alveoli (Tsuda et al. Citation1995; Tippe and Tsuda Citation2000) was considered by a constant empirical mixing factor of 0.3, based on experimental mixing data (Altshuler et al. Citation1959) and an extensive analysis of total and regional deposition data. Thus if a particle enters an alveolus, it is randomly selected either to be mixed or not (Hofmann et al. Citation2008). The same mixing factor was assumed for the mixing of particles remaining in a given cylindrical alveolated airway after the end of the inhalation phase with the residual air in the region of the lung distal to that generation. These particles are relocated to a distal generation by randomly selecting an airway generation located between that generation and the last generation of that path. Since the alveolar volume is significantly higher than the tubular airway volume in the distal parts of the lung, this particle is placed in an alveolus.
Due to mixing in the alveolated region of the lung, differences between inhaled and exhaled flow profiles and axial diffusion, a small fraction of non-deposited particles will still remain airborne in the lung at the end of the exhalation phase. These particles are then tracked during the next full breathing cycle and are either deposited or exhaled or remain again in the lung for the next breathing cycle.
The stochastic deposition model IDEAL was validated by comparison with the experimental data of Heyder et al. (Citation1986) for a wide range of particle sizes and of Schiller et al. (Citation1988) for ultrafine particles, and the fitted deposition fractions provided by International Commission on Radiological Protection (ICRP) (Citation1994) (Hofmann Citation2011). The excellent agreement with these experimental data represents a reliable basis for the simulation of lobar deposition patterns.
Results
Subsequent lobar deposition calculations refer to inhalation through the mouth as this is the preferential breathing mode in human inhalation studies. However, the selection of the oral or nasal route is of no significance for lobar deposition patterns as it does not affect the relative distribution among the individual lobes, only the absolute number of particles reaching each lobe. The standard breathing scenario assumed in the present calculations refers to sitting breathing conditions for an adult male with FRC = 3300 mL, VT = 750 mL, and breathing frequency f = 12 min−1 (International Commission on Radiological Protection (ICRP) Citation1994). All subsequent deposition calculations refer to intra-lobar bronchial airways, i.e. only the bronchial airways within a given lobe are considered. However, inclusion of the deposition fractions in the upstream airways leading to the individual lobes increases deposition to all lobes, while only slightly affecting the distribution among the different lobes.
For the assessment of health risks associated with the inhalation of particulate matter, deposition densities, i.e. deposition fractions divided by their corresponding surface areas, may be a better indicator of risk than deposition fractions (Hofmann et al. Citation2006). Since most lung tumors are of bronchogenic origin, lobar bronchial deposition densities are obtained by dividing the lobar bronchial deposition fractions by their corresponding effective lobar bronchial surface areas. Thus to cover all aspects of health considerations, subsequent deposition calculations comprise not only lobar deposition fractions but also bronchial deposition densities.
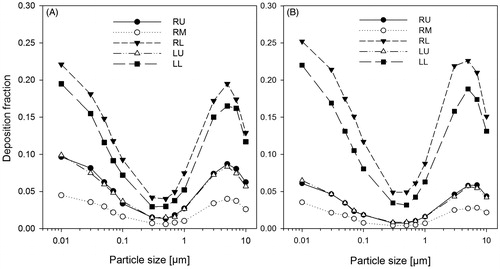
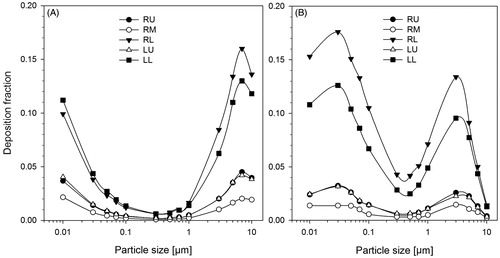
Deposition fractions of inhaled unit density particles, ranging from 10 nm to 10 μm, in the five lobes of the human lung, assuming uniform ventilation (panel A), i.e. considering only the effect of the stochastic, asymmetric lung morphology, and non-uniform ventilation (panel B) are plotted in . Over the whole range of particle diameters, deposition fractions are significantly higher in the two lower lobes than in the two upper lobes and smallest for the RM lobe. Although this general pattern is consistent with their respective lobar volumes, their differences are not borne out numerically by their lobar volumes. Despite comparable lobar volumes, lobar deposition is higher in the RL lobe than in the LL lobe due to the higher airflow into the right lung (volume ratio right/left lung = 1.15). The additional effect of non-uniform ventilation, i.e. asymmetric and asynchronous filling of the lung, which enhances the flow to the lower portions of the lung, slightly increases deposition in both lower lobes and hence reduces it in both upper lobes and the RM lobe.
Figure 4. Deposition fractions of unit density particles, ranging from 10 to 10 μm, in the five lobes of the human lung for oral sitting breathing conditions and both uniform (panel A) and non-uniform (panel B) ventilation conditions.
Corresponding bronchial (panel A) and alveolar (panel B) deposition fractions in the five lobes of the human lung are displayed in for non-uniform ventilation conditions. Consistent with the deposition fractions for the whole lung exhibited in , bronchial and alveolar deposition fractions are again highest in the two lower lobes, although differences between the two lobes practically disappear in the bronchial region, while they become even more pronounced in the alveolar region. The same tendencies could be observed in corresponding calculations for uniform ventilation conditions.
Figure 5. Bronchial (panel A) and alveolar (panel B) deposition fractions of unit density particles, ranging from 10 nm to 10 μm, in the five lobes of the human lung for oral sitting breathing and non-uniform ventilation conditions.
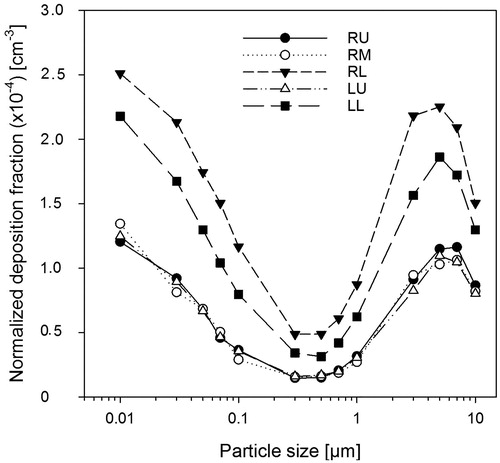
The general pattern of the inter-lobar distribution of deposition fractions observed in suggests that lobar volume is the major determinant of lobar deposition fractions. To test this hypothesis, lobar deposition fractions for non-uniform ventilation conditions exhibited in (panel B) were divided by their respective lobar volumes (). If the lobe-specific normalized deposition curves fall into one curve, then this would prove that lobar volume is indeed the driving force. While the normalization to the same lobar volume reduces the differences between the upper and lower lobes, differences in deposition fractions still exist. Although lobar volume may indeed be the major determinant, intra-lobar structural differences, such as differences in the number of lobar airway generations and volume-related differences in airway diameters and lengths, may also play a role. Furthermore, the observation that uniform ventilation further reduces inter-lobar differences between normalized upper and lower deposition fraction suggests that non-uniform ventilation also contributes to the still existing differences.
Figure 6. Normalized lobar deposition fractions, i.e. lobar deposition fractions divided by their respective lobar volumes, of unit density particles, ranging from 10 to 10 μm, in the five lobes of the human lung for oral sitting breathing and non-uniform ventilation conditions.
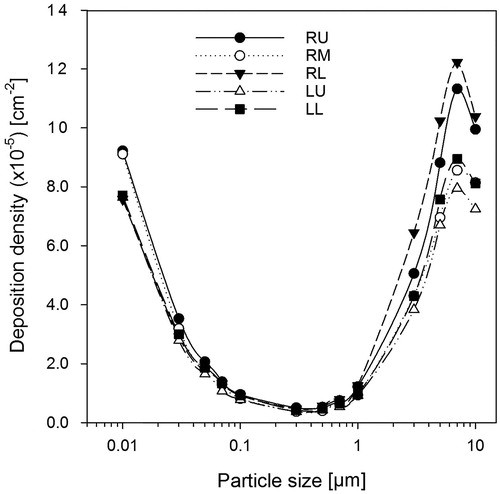
Lobar bronchial deposition densities obtained by dividing the lobar bronchial deposition fractions plotted in by their corresponding effective lobar bronchial surface areas listed in are shown in . With the exception of the smallest and largest particle diameters, where slight lobar differences can still be observed, lobar deposition densities hardly differ from each other. This demonstrates that bronchial surface area reduces the effect of lobar volume on deposition densities. Corresponding calculations for uniform ventilation conditions reveal the same tendency.
Figure 7. Lobar bronchial deposition densities, i.e. deposition fractions divided by their average effective bronchial airway surfaces within each lobe, of unit density particles, ranging from 10 to 10 μm, in the five lobes of the human lung for oral sitting breathing and non-uniform ventilation conditions.
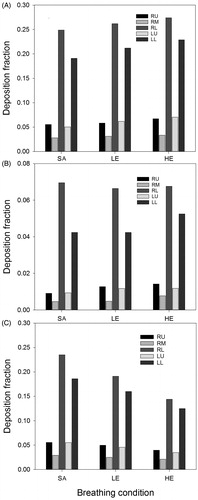
To illustrate the effect of physical activity or flow rate Q on the resulting lobar deposition fractions, deposition fractions of 20 nm (panel A), 200 nm (panel B), and 5 µm (panel C) unit density particles within the different lobes are plotted in for sitting awake (VT = 0.75 L, f = 12 min−1, Q = 300 cm3 s−1), light exercise (VT = 1.25 L, f = 20 min−1, Q = 833.3 cm3 s−1) and heavy exercise (VT = 1.923 L, f = 26 min−1, Q = 1672.2 cm3 s−1) breathing conditions for an adult male (International Commission on Radiological Protection (ICRP) Citation1994). These particle diameters were selected to reflect the action of different deposition mechanisms, i.e. diffusion (20 nm), diffusion and impaction (200 nm), and impaction and sedimentation (5 µm). For all particle sizes and physical activities, the deposition maxima can be found in the two lower lobes. While the distributions among the lobes are only slightly affected by the breathing conditions, the absolute values of the deposition fractions reflect the effect of the dominant deposition mechanisms and their dependence on flow rate. For example, an increasing flow rate from sitting to heavy exercise decreases deposition by diffusion and sedimentation and increases deposition by impaction. While the decreasing deposition fractions of 5 µm particles with rising flow rate follow the dependence of the sedimentation deposition efficiency on flow rate, deposition fractions of the 20 nm particles even slightly increase with flow rate despite decreasing deposition efficiencies for diffusion. The reason for this unexpected behavior is that due to higher tidal volumes, inhaled particles can penetrate deeper into the lung, thereby enhancing alveolar deposition. In the case of 200 nm particles, the effect of diffusion and impaction seem to balance each other.
Figure 8. Lobar deposition fractions of 20 nm (panel A), 200 nm (panel B), and 5 µm (panel C) unit density particles for oral sitting breathing and non-uniform ventilation conditions in the five lobes of the human lung for sitting awake (SA), light exercise (LE), and heavy exercise (HE) breathing conditions (International Commission on Radiological Protection (ICRP) Citation1994).
Lobar bronchial deposition fractions of 20 nm (panel A), 200 nm (panel B), and 5 µm (panel C) unit density particles within the different lobes are in shown for sitting, light exercise, and heavy exercise breathing conditions. Consistent with the plots for total lobar deposition, the distributions among the lobes for a given particle size are quite similar for all physical activities. Differences between the particle diameters can again be attributed to operating physical deposition mechanisms. While deposition fractions of 20 nm particles are consistently highest in the LL lobe, maximum deposition of 5 µm is found in the RL lobe for all breathing conditions. As opposed to total lobar deposition fractions plotted in , bronchial deposition fractions of 20 nm particles decrease with rising flow rate consistent with deposition theory, demonstrating that increased total deposition is indeed caused by increased deposition in the alveolar region.
Figure 9. Lobar bronchial deposition fractions of 20 nm (panel A), 200 nm (panel B), and 5 µm (panel C) unit density particles for oral sitting breathing and non-uniform ventilation conditions in the five lobes of the human lung for sitting awake (SA), light exercise (LE), and heavy exercise (HE) breathing conditions (International Commission on Radiological Protection (ICRP) Citation1994).
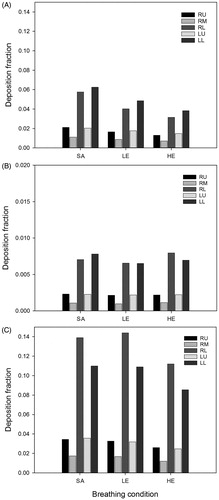
Figure 10. Deposition fractions of 20, 200, and 5 µm unit density particles for oral sitting breathing and non-uniform ventilation conditions among bronchial and alveolar airway generations within different lobes.
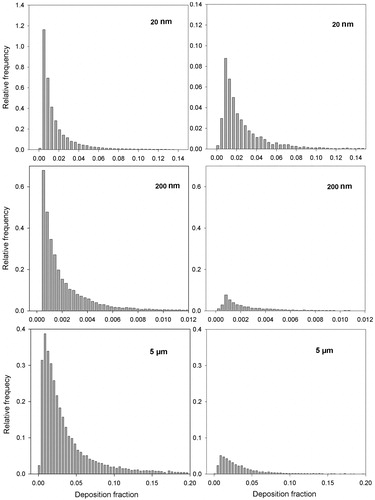
The variability of lobar bronchial deposition fractions due to the stochastic, asymmetric lung structure, and related flow distributions are illustrated in for 20, 200, and 5 µm unit density particles in the RL lobe (maximum deposition) (left panels) and the RM lobe (minimum deposition) (right panels). The significant width of the distributions, particularly the high deposition tail, demonstrates that the average bronchial deposition fractions presented in are averages over a wide range of individual deposition values. This variability of bronchial deposition within each lobe can reasonably be approximated by lognormal distributions. The relative frequency distributions in the other three lobes exhibit the same pattern and thus are not shown here.
Figure 11. Variability of lobar bronchial deposition fractions for 20, 200, and 5 unit density particles for oral sitting breathing and non-uniform ventilation conditions in the RL lobe (left panels) and RM lobe (right panels).
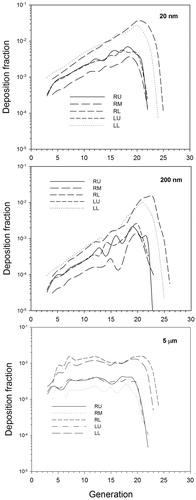
Lobar deposition fractions of 20, 200, and 5 µm unit density particles for oral sitting breathing and non-uniform ventilation conditions are plotted in as functions of airway generations, comprising all bronchial and alveolar airway generations in the different lobes. Consistent with the lobar deposition fractions shown in , deposition fractions are highest in the RL and LL lobes and smallest in the RM lobe, while their relative distributions among the airways are practically the same in all lobes. For all particle sizes, deposition fractions in each lobe rise with increasing airway generation number, before tapering off due to the significant reduction of airways in the most distal airway generations.
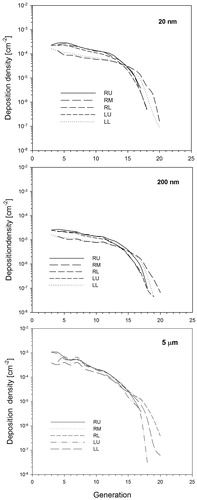
Related bronchial deposition densities of 20, 200, and 5 µm unit density particles for oral sitting breathing and non-uniform ventilation conditions within the different lobes are presented in . Bronchial deposition densities are steadily declining with increasing airway generation number in all lobes due to the ever-increasing surface area. Consistent with the total lobar bronchial deposition densities shown in , differences between the individual lobes are significantly reduced compared to the bronchial deposition fractions exhibited in .
Figure 12. Deposition densities of 20, 200, and 5 µm unit density particles for oral sitting breathing and non-uniform ventilation conditions among bronchial airway generations in the five lobes of the human lung.
Lobe-specific deposition weighting factors
Lung deposition models based on the widely used symmetric, single-path morphometric lung models cannot, by definition, provide information on deposition fractions in the different lobes of the human lung. However, the stochastic, asymmetric five-lobe lung model presented in this study allows the calculation of lobe-specific deposition weighting factors relative to whole lung calculations. These lobe-specific deposition weighting factors are defined as the ratios of the lobar deposition fractions to the corresponding whole lung deposition fractions, i.e. weighting factors of >1 indicate a lobar deposition greater than the average whole lung deposition and a smaller deposition for values <1. These deposition weighting factors can be used to convert average deposition fractions for the whole lung based on symmetric airway generation or regional compartment models to lobar deposition fractions. Lobe-specific deposition weighting factors for several particle diameters under oral sitting breathing conditions are listed in , derived from the lobar deposition fractions plotted in , illustrating the dependence on particle diameter. Lobar deposition weighting factors are consistently >1 for both lower lobes and <1 for the two upper lobes and the RM lobe, with maximum values for the RL lobe and minimum values for the RM lobe.
Table 2. Dependence of lobe-specific deposition weighting factors on particle diameter for the five lobes of the human for non-uniform ventilation conditions and oral sitting breathing conditions.
Based on the lobar deposition fractions for 20, 200, and 5 μm particles for sitting, light and heavy exercise breathing conditions exhibited in , the dependence of corresponding lobe-specific deposition weighting factors on physical activity or flow rate is presented in . For each particle diameter, deposition weighting factors vary only slightly with breathing conditions.
Table 3. Dependence of lobe-specific deposition weighting factors for 20 nm, 200 nm, and 5 μm particles on physical activity or flow rate for sitting awake (Q = 300 cm3 s−1), light (Q = 833.3 cm3 s−1), and heavy exercise (Q = 1672.2 cm3 s−1) and non-uniform ventilation conditions.
Comparison of model predictions with theoretical and experimental data
The first lobar deposition calculations were reported by Yeh and Schum (Citation1980) based on their five-lobe typical path lung model. Consistent with the present results, deposition of unit density particles with diameters ranging from 10 to 10 μm was highest in the two lower lobes, least in the RM lobe, and intermediate in the two upper lobes.
Gerrity et al. (Citation1981) also calculated lobar deposition fractions for 4 μm particles under defined inhalation conditions, based on the asymmetric Horsfield et al. (Citation1979) bronchial tree model. Despite the application of a different lung model, lobar deposition fractions obtained with the present model for the same exposure conditions, assuming uniform ventilation, agree almost quantitatively with the results of Gerrity et al. (Citation1981).
Comparison of the lobar bronchial and alveolar deposition fractions for particle diameters ranging from 10 to 10 μm with the corresponding predictions by Subramaniam et al. (Citation2003), based on the multiple-path model of Asgharian et al. (Citation2001), reveal general agreement between the two models for uniform ventilation conditions. Despite inherent structural differences, deposition fractions of submicron particles in both models were highest in the RL and LL lobes and lowest in the RM lobes, with the RU and LU lobes at intermediate values. While tracheobronchial and alveolar deposition fractions exhibit excellent agreement for submicron particles, lobar deposition fractions for particle diameters above about 1 μm are significantly higher in the present model, although consistent with the later calculations of Asgharian et al. (Citation2006). Furthermore, both models predict the same tendency for lobar deposition densities as well as generational deposition fractions. Differences observed can be attributed to the additional effect of non-uniform ventilation, which enhances deposition in the lower portions of the lung relative to the upper lobes, and, in the case of deposition densities, to the application of effective surface areas as compared to morphometric surface areas.
Based again on the multiple-path model, Asgharian et al. (Citation2006) reported bronchial and alveolar particle deposition fractions in the five lobes of the human lung. While total and regional deposition fractions exhibit the same dependency on particle diameter in the range from 10 nm to 10 μm, tracheobronchial and alveolar deposition fractions were highest in the LL lobe, followed by lower values for the RL lobe. This differs from the present simulations, where deposition fractions were highest in both the RL and LL lobes. These differences in lobar deposition may be attributed to differences in the alveolar airway structure, i.e. symmetric vs. asymmetric, where the majority of inhaled particles is deposited. Furthermore, the uniform and non-uniform expansion patterns of the human lung (Asgharian et al. Citation2006) refer to all airways in the human lung and not to the ventilation distributions among the five lobes as in this study.
Although lobar deposition fractions are currently not accessible experimentally, deposition measurements for specific combinations of lobes, such as upper vs. lower lobes (Bennett et al. Citation1985) and right lobes vs. left lobes (Möller et al. Citation2009) have been reported in the literature.
In their experimental study, Bennett et al. (Citation1985) measured the deposition of monodisperse 2.6 µm 99mTc tagged particles in the apical (upper lobes) and basal (lower lobes) regions of right lung of five adult male and female subjects for average resting (VT = 614 mL, f = 13.4 min−1) and exercise (VT = 1582 mL, f = 31.4 min−1) breathing conditions. Apical to basal deposition ratios varied significantly among the test persons, ranging from 0.61 to 0.96 (average 0.71) for resting and from 0.38 to 0.90 (average 0.70) for exercise. Inspection of the gamma camera images suggest that RU + RM represent the apical and RL the basal region, respectively. Computed deposition fractions include also deposition in main and lobar airways, consistent with the gamma camera measurements.
Based on non-uniform ventilation and an FRC of the volunteers of 3304 mL, computed upper-to-lower lung (U/L) deposition ratios were 0.50 for resting and 0.53 for exercise. These ratios are lower than the average measured ratios of 0.71 (resting) and 0.70 (exercise). However, assuming uniform ventilation, which reduces the differences between upper and lower lobes, corresponding ratios were 0.68 (resting) and 0.72 (exercise), similar to the experimental values. The large individual variability of U/R values observed in the experiments, which cannot be explained by corresponding inter-subject differences of FRC, VT, and f, may be attributed primarily to inter-subject differences in lobar volumes and lobar ventilation. These inter-subject variations of measured U/L ratios as well as the effect of uniform and non-uniform ventilation on predicted U/L ratios suggest that some individuals may have a more uniform and others more non-uniform lung ventilation.
Despite the overall agreement between experimental and theoretical U/L ratios, there are two experimental ambiguities, which affect the validity of this comparison. First, projections of the right lung lobes onto a two-dimensional plane demonstrate that the three lobes overlap each other in the middle region of the lung. As a result, bronchial deposition in the RM and RL lobes may partly contribute to the upper lung region. Thus measured deposition fractions in each lobe cannot be assigned unambiguously to either the apical or the basal region, which questions the obtained U/L ratios. Second, Bennett et al. (Citation1985) also reported total and alveolar deposition fractions for both breathing conditions. While computed alveolar deposition fractions generally agree with the measured values, measured total deposition fractions are significantly smaller than the computed values, e.g. 28 vs. 39% for resting conditions. For comparison, a fit to the experimental data of Heyder et al. (Citation1986) for resting breathing conditions (International Commission on Radiological Protection (ICRP) Citation1994) yields a total lung deposition fraction of 38%, consistent with the model results. This suggests that bronchial deposition may have been underestimated in the experiment, which primarily affects deposition in the upper region.
To further investigate the distribution of deposition fractions between the upper and lower lobes in more detail, U/L ratios were calculated for total and bronchial deposition fractions and bronchial deposition densities for particle diameters ranging from 10 nm to 10 μm and full breath sitting breathing conditions. Total and bronchial deposition fractions in the upper lobes were significantly lower than those in the lower lobes, consistent with the lower flow into the upper lobes (U/L = 0.62). However, since the bronchial surface areas of the upper lobes are much smaller than those for the lower lobes (U/L = 0.27), corresponding differences between deposition densities are significantly reduced. Since U/L deposition ratios for uniform ventilation are increased relative to non-uniform ventilation, the assumption of uniform or non-uniform ventilation significantly affects the distribution of particles deposited among upper and lower lobes, as already discussed in the analysis of the Bennett et al. (Citation1985) experiment.
In the case of left-to-right lung (L/R) deposition, Möller et al. (Citation2009) measured L/R deposition ratios of 100 nm 99mTc labeled carbon particles (GSD = 1.6) in nonsmokers (NS) and smokers (S), which were delivered as 100 mL boli to deep and shallow penetration depths. Likewise, 81mKr gas was inhaled in a shallow bolus, but also in a 1 L full breath. The average measured L/R ratio of 0.85 for a full breath inhalation of the Kr-gas reflects the volume ratio of the left to the right lung (model: 0.86). For shallow bolus inhalation of the carbon particles to the phase-1 dead space increases this ratio to 1.57 (NS) and 1.32 (S), if normalized to the volumetric ratio of 0.85, while the average L/R ratio for the deep aerosol bolus was only 0.89, consistent with the full breath ratio of the Kr-gas (0.85).
In the stochastic deposition model IDEAL, particles are inhaled at random times during the inhalation phase. This allows the simulation of aerosol boli within defined time intervals, while inhaling aerosol-free air during the remaining time (Hofmann et al. Citation2008). Inhalation conditions in the Möller et al. (Citation2009) experiment were: VT=1 L, inspiration and expiration time = 4 s, breath-hold time = 8 s, deep bolus front depth = 800 mL (0.8 s), shallow bolus front depth = 150 mL (3.4 s), and bolus length = 100 mL (0.4 s). Computed deposition fractions include also deposition in main and lobar airways, consistent with the gamma camera measurements.
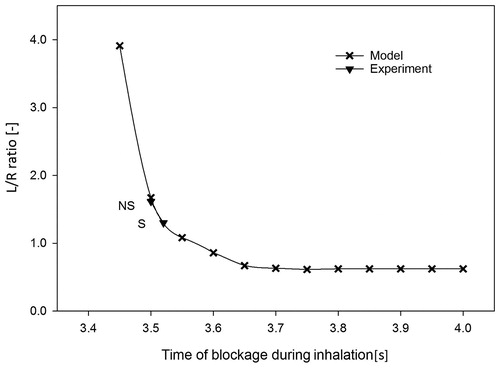
The unexpected finding of an increase of the L/R ratio with deeper penetration into the lung prompted Möller et al. (Citation2009) to suggest that the right lung is less able to expand at the end of a breath than the left lung because of the restrictive position of the liver. This hypothesis was simulated by stopping the airflow into the right lung at a given point in time toward the end of bolus inhalation and then re-directing all subsequently inhaled particles exclusively into the left lung. This blockage time point was varied in 0.05 s steps from the start of the bolus at 3.4 s to its end at 3.8 s. With increasing blockage time, deposition in the right lung decreases as fewer particles reach the peripheral region of the right lung, while increasing deposition in the left lung as additional particles are entering the left lung. The dependence of the L/R deposition ratio for the shallow 100 nm particle bolus with increasing blockage time to the right lung is plotted in . Comparison with the experimentally observed normalized L/R ratio for nonsmokers (1.57) and smokers (1.32) indicates a blockage time of about 3.5 s, i.e. airflow into the right lung is blocked during the last 0.5 s of the 4 s inhalation phase. The difference in the L/R ratio between nonsmokers and smokers may be attributed to cigarette-induced modifications of the lung structure relative to a healthy lung. Likewise, computed L/R ratios for the shallow gas bolus and the deep aerosol bolus are consistent with blockage times between 3.5 and 3.6 s.
Figure 13. Dependence of the left-to-right (L/R) lung deposition ratio of 100 nm 99mTc labeled carbon particles, delivered as a 100 mL bolus (0.4 s) to a shallow bolus front depth of 150 mL (VT = 1000 mL), i.e. inhaled at 3.4 s, on the blockage time to the right lung for an inhalation time of 4 s. Experimental L/R ratios for nonsmokers (NS) and smokers (S), normalized to the volumetric ratio of 0.85, are included for comparison (Möller et al. Citation2009).
While the analysis of the shallow bolus experiment demonstrated the necessity to implement the blockage of the right lung at the end of inhalation, the question arises, whether this blockage has also to be considered for total lung deposition for a full breath and normal breathing conditions. Indeed, deposition calculations for 100 nm and 5 μm particles for the same inhalation conditions, except without the 8 s pause, demonstrated that such a blockage does not affect total deposition fractions. Furthermore, the partial blockage of the right lung leads to a more uniform distribution among the right and left lobes, despite differences in related lobar flows.
To extend the analysis of the distribution of deposition fractions between the left and the right lung to other particle diameters, L/R ratios were calculated for total and bronchial deposition fractions and bronchial deposition densities for particle diameters ranging from 10 nm to 10 μm and full breath sitting breathing conditions. The ratios for total and bronchial deposition were smaller than one, consistent with the lower flow into the left lung (L/R = 0.86). This ratio was even smaller for the bronchial deposition densities due to the higher bronchial surface area of the left lobes (L/R = 1.17). Computed L/R deposition ratios were only slightly affected by the assumption of non-uniform or uniform ventilation conditions.
Discussion
At present, five-lobe lung deposition models comprise the symmetric single-path model of Yeh and Schum (Citation1980), the asymmetric multiple-path particle deposition (MPPD) model of Asgharian et al. (Citation2001), and the present stochastic, asymmetric five-lobe version of the IDEAL model (Koblinger and Hofmann Citation1985, Citation1990). Note that the bronchial airway geometries of all three models are based on the morphometric measurements of Raabe et al. (Citation1976).
In the Yeh and Schum (Citation1980) model, bronchial airway dimensions were computed as arithmetic means of the actually measured data, while in the stochastic model, all measured bronchial airway parameters in each generation were statistically analyzed in terms of frequency distributions and correlations among several parameters (Koblinger and Hofmann Citation1985). For the completion of the bronchiolar region of the lung, two different strategies were applied. In the Yeh and Schum (Citation1980) model, arithmetic means of all airway parameters in each generation of the measured lung fraction were calculated and these dimensions were assumed to be representative of the missing fraction. However, the difficulty to measure such tiny airways may have led to a preference of the larger paths and hence these dimensions may be biased toward larger airway dimensions. In contrast, the statistical distributions and parameter correlations in the stochastic lung model, derived from all measured bronchiolar airways in each generation, were assumed to be the same as in the missing fraction, although their absolute values will be different. These different analyses of the same morphometric data lead to several structural and dimensional differences between the two models. For example, measured bronchial airways are forced into a system of 15 symmetric airway generations (Yeh and Schum Citation1980), while bronchial airway generations in the stochastic, asymmetric lung model (Koblinger and Hofmann Citation1985) range from 11 to 21 along different paths.
For comparison, the bronchial airway structure of the asymmetric multiple-path lung model of Asgharian et al. (Citation2001) is composed of 50 stochastically generated multiple path realizations of the stochastic lung model (Hofmann et al. Citation2002). While the total volume is the same in all lungs, the number of conducting airways varies among the 50 geometries. The smallest number of airways is the zero percentile and the largest the 100 percentile. In the MPPD model, 10 lungs were finally picked among these percentiles to represent the variation in the 50 generated geometries.
There are also notable differences in the acinar airway structures of the three models. In the Yeh and Schum (Citation1980) model, airway diameters and lengths were not derived from direct measurements, but utilized general anatomical data of the acinar region, such as the number of alveoli or total alveolar volume, and assuming dichotomous branching . As a consequence, acinar airways in each lobe are described by a symmetric structure with nine airway generations, though differing in diameter and length between the lobes. For comparison, the stochastic model of the acinar airways is based primarily on the morphometric analysis of several acini of the human alveolar region (Haefeli-Bleuer and Weibel Citation1988). Consistent with the bronchial airway model, the stochastic acinar airway geometry is described by lognormal diameter and length distributions and a variable number of acinar airway generations, ranging from 6 to 12.
In the MPPD model (Asgharian et al. Citation2001), the bronchial tree is supplemented by attaching identical acini to each terminal bronchiole, based on the symmetric acinar structure of the typical-path model of Yeh and Schum (Citation1980). In addition to these structural differences, there are also volumetric differences, as the MPPD model is based on a constant lung volume, while the random selection of airway parameters in the stochastic lung model automatically leads to corresponding variations in lung volume.
The relevant morphometric parameters affecting particle deposition are lobar volume and lobar surface area. While deposition fractions are proportional to lobar volume, deposition densities, or surface doses are inversely proportional to lobar surface area. Since the lobes with larger volumes have also larger surface areas, the higher deposition fractions in the larger lobes are partly compensated by their larger surface areas. This effect reduces the significant inhomogeneity of the initial deposition pattern among the different lobes, thus leading to a more uniform distribution of deposition densities or surface doses.
The flow distribution among the lobes in the stochastic, asymmetric lung model is proportional to lobar volume and the flow distribution within individual lobes depends on the alveolar volume supported by each asymmetrically branching airway. Superposed on the morphometry-related inhomogeneous ventilation is the asymmetry and asynchrony of lung ventilation, which further enhances the inhomogeneity of the flow pattern. Intra-lobar distributions of deposition fractions and surface deposition densities demonstrate that the non-uniform lung morphometry, i.e. differences in airway structure and linear dimensions among the five lobes, is the dominating effect, while the additional effect of ventilation inhomogeneity produces only minor modifications.
As a result of the asymmetric, stochastic nature of the airway system and the non-uniform ventilation pattern, distributions of lobar deposition fractions are based on a wide range of deposition fractions in individual airways. Starting with distributions of deposition fractions in individual bronchial and acinar airway generations, which can be approximated by lognormal distributions (Hofmann Citation2000, Citation2011), distributions of lobar deposition fractions result from the superposition of lognormal distributions in lobar airways. In further consequence, deposition in individual lobes exhibit a wide range of values, which can be approximated again by lognormal distributions. While the assessment of health effects, e.g. lung cancer, is commonly related to average deposition fractions, the observed variability of lobar deposition fractions questions the applicability of average values for risk assessment purposes.
A practical application of the lobar deposition calculations presented in this study is the derivation of lobe-specific deposition weighting factors, which are defined as the ratios of the lobar deposition fractions with the average deposition fractions for the whole lung. These lobe-specific deposition weighting factors can be used to convert average deposition fractions derived from symmetric airway generation or bronchial compartment models, which do not allow the calculation of lobar deposition fractions, to lobe-specific deposition fractions.
At present, model simulations of lobar deposition fractions cannot be validated directly by comparison with experimental data. However, the studies of Bennett et al. (Citation1985) and Möller et al. (Citation2009) allow an indirect comparison with specific combinations of lobes, i.e. upper vs. lower (U/L) lobes or right vs. left (L/R) lobes. Unfortunately, the applicability of the study of Bennett et al. (Citation1985) is somewhat limited by the lack of an unambiguous correlation between the apical and basal areas of the right lung in the gamma camera images and the two-dimensional projection of upper, middle, and lower lobes, while the definition of left and right lobes in the study of Möller et al. (Citation2009) in the gamma camera images allow an unequivocal validation.
Non-uniform and uniform lobar ventilation patterns differ by their relative distributions of the inhaled airflow among upper and lower lobes and thus affect deposition among upper and lower lobes in either the right or left lung. While the analysis of the experimental bolus dispersion data of Brand et al. (Citation1997) required the assumption of a non-uniform lung ventilation (Hofmann et al. Citation2008), the considerable inter-subject variations of U/L ratios reported by Bennett et al. (Citation1985) suggest that some individuals may have a more uniform lobar ventilation than predicted by the non-uniform lobar ventilation model. However, the extent of non-uniform lobar ventilation does not affect L/R ratios.
Results of L/R simulations for 100 nm aerosol boli inhaled toward the end of inhalation confirmed the experimental finding of Möller et al. (Citation2009) that the right lung is less able to expand at the end of a breath because of the restrictive position of the liver (Möller et al. Citation2009). Comparisons with experimental data for shallow bolus inhalation in nonsmokers and smokers indicated a blockage time at about 3.5 s for an inhalation time of 4 s. While this partial blockage does not affect total deposition fractions for continuous inhalation conditions, it leads to a more uniform deposition among the right and left lobes.
Reported bronchial cancers are preferentially caused by inhalation of cigarette smoke, with the majority of tumors occurring in the upper bronchial airway generations, say above about generation 9. Since inhaled cigarette smoke aerosols can be characterized by a number size distribution with a median diameter of 163 nm (GSD = 1.44) (Ingebrethsen et al. Citation2011), the bronchial deposition densities for 200 nm particles plotted in may illustrate their distribution among the five lobes. For example, bronchial deposition densities in the upper bronchial airways are higher in the right lobes than in the left lobes, consistent with the observations of Parkash (Citation1977), Sahmoun et al. (Citation2005), and Kudo et al. (Citation2012). Likewise, bronchial deposition densities in the upper lobes are higher than those in the lower lobes, and highest in the RU lobe, as observed by Parkash (Citation1977) and Kudo et al. (Citation2012). Although only very scarce information is currently available on the lobar site-specificity of bronchial carcinomas, the lobar upper bronchial deposition densities presented in this study are consistent with the limited pathological information.
Acknowledgments
The stay of Dr. Majid Hussain at the University of Salzburg was supported by the Ernst Mach-Nachbetreuungsstipendium (EZA) ICM-2017-08043 from the Austrian Agency for International Cooperation in Education and Research (OEAD), and Centre for International Cooperation & Mobility (ICM).
Disclosure statement
No potential conflict of interest was reported by the author(s).
Additional information
Funding
References
- Altshuler B, Palmes ED, Yarmus L, Nelson N. 1959. Intrapulmonary mixing of gases studied with aerosols. J Appl Physiol. 14:321–327.
- Asgharian B, Hofmann W, Bergmann R. 2001. Particle deposition in a multiple-path model of the human lung. Aerosol Sci Technol. 34(4):332–339.
- Asgharian B, Price OT, Hofmann W. 2006. Prediction of particle deposition in the human lung using realistic models of lung ventilation. J Aerosol Sci. 37(10):1209–1221.
- Balásházy I, Hofmann W, Farkas A, Madas BG. 2008. Three-dimensional model for aerosol transport and deposition in expanding and contracting alveoli. Inhal Toxicol. 20(6):611–621.
- Bennett WD, Messina MS, Smaldone GC. 1985. Effect of exercise on deposition and subsequent retention of inhaled particles. J Appl Physiol (1985). 59(4):1046–1054.
- Bennett WD, Scheuch G, Zeman KL, Brown JS, Kim C, Heyder J, Stahlhofen W. 1998. Bronchial airway deposition and retention of particles of inhaled boluses: effect of anatomic dead space. J Appl Physiol. 85(2):685–694.
- Bennett WD, Scheuch G, Zeman KL, Brown JS, Kim C, Heyder J, Stahlhofen W. 1999. Bronchial airway deposition and retention of particles of inhaled boluses: effect of lung volume. J Appl Physiol. 86(1):168–173.
- Brand P, Rieger C, Schulz H, Beinert T, Heyder J. 1997. Aerosol bolus dispersion in healthy subjects. Eur Respir J. 10(2):460–467.
- Cai FS, Yu CP. 1988. Inertial and interceptional deposition of spherical particles and fibers in a bifurcating airway. J Aerosol Sci. 19(6):679–688.
- Chan TL, Lippmann M. 1980. Experimental measurements and empirical modelling of the regional deposition of inhaled particles in humans. Am Ind Hyg Assoc J. 41(6):399–409.
- Chang YH, Yu, CP. 1999. A model of ventilation distribution in the human lung. Aerosol Sci Technol. 30(3):309–319.
- Cheng KH, Cheng YS, Yeh HC, Guilmette RA, Simpson SQ, Yang YS, Swift DL. 1996. In vivo measurements of nasal airway dimensions and ultrafine aerosol deposition in the human nasal and oral airways. J Aerosol Sci. 27(5):785–801.
- Choi JI, Kim CS. 2007. Mathematical analysis of particle deposition in human lungs: an improved single path transport model. Inhal Toxicol. 19(11):925–939.
- Cohen BS, Asgharian B. 1990. Deposition of ultrafine particles in the upper airways: an empirical analysis. J Aerosol Sci. 21(6):789–797.
- De Backer JW, Vos WG, Vinchurkar SC, Claes R, Drollmann A, Wulfrank D, Parizel PM, Germonpré PD, Backer W. 2010. Validation of computational fluid dynamics in CT-based airway models with SPECT/CT. Radiology. 257(3):854–862.
- Gerrity T, Garrard C, Yeates D. 1981. Theoretic analysis of sites of aerosol deposition in the human lung. Chest. 80(6):898–901.
- Haefeli- Bleuer B, Weibel ER. 1988. Morphometry of the human pulmonary acinus. Anat Rec. 220(4):401–414.
- Hansen JE, Ampaya EP. 1975. Human air space shapes, sizes, areas and volumes. J Appl Physiol. 38(6):990–995.
- Heyder J, Gebhart J, Rudolf G, Schiller CF, Stahlhofen W. 1986. Deposition of particles in the human respiratory tract in the size range 0.005 to 15 µm. J Aerosol Sci. 17(5):811–825.
- Hofmann W. 2000. Stochastic dose estimation for inhaled particles. Stoch Envir Res Risk Ass. 14:181–193.
- Hofmann W. 2011. Modelling inhaled particle deposition in the human lung – a review. J Aerosol Sci. 42(10):693–724.
- Hofmann W, Asgharian B, Winkler-Heil R. 2002. Modeling intersubject variability of particle deposition in human lungs. J Aerosol Sci. 33(2):219–235.
- Hofmann W, Balásházy I, Heistracher T. 2001. The relationship between secondary flows and particle deposition patterns in airway bifurcations. Aerosol Sci Technol. 35(6):958–968.
- Hofmann W, Bergmann R, Koblinger L. 1999. Characterization of local particle deposition patterns in human and rat lungs by different morphometric parameters. J Aerosol Sci. 30(5):651–667.
- Hofmann W, Koblinger L. 1990. Monte Carlo modeling of aerosol deposition in human lungs. Part II: deposition fractions and their sensitivity to parameter variations. J Aerosol Sci. 21(5):675–688.
- Hofmann W, Koblinger L. 1992. Monte Carlo modeling of aerosol deposition in human lungs. Part III: comparison with experimental data. J Aerosol Sci. 23(1):51–63.
- Hofmann W, Pawlak E, Sturm R. 2008. Semi-empirical stochastic model of aerosol bolus dispersion in the human lung. Inhal Toxicol. 20(12):1059–1073.
- Hofmann W, Bolt L, Sturm R, Fleming JS, Conway JH. 2005. Simulation of three-dimensional particle deposition patterns in human lungs and comparison with experimental SPECT data. Aerosol Sci Technol. 39(8):771–781.
- Hofmann W, Winkler-Heil R, Balásházy I. 2006. The effect of morphological variability on surface deposition densities of inhaled particles in human bronchial and acinar airways. Inhal Toxicol. 18(10):809–819.
- Hofmann W, Winkler-Heil R, Morawska L, Moustafa M. 2009. Deposition of combustion aerosols in the human respiratory tract: comparison of theoretical predictions with experimental data considering nonspherical shape. Inhal Toxicol. 21(14):1154–1164.
- Horsfield K, Dart G, Olson DE, Filley GF, Cumming G. 1979. Models of the human bronchial tree. J Appl Physiol. 31:207–217.
- Ingebrethsen BJ, Alderman SL, Ademe B. 2011. Coagulation of mainstream cigarette smoke in the mouth during puffing and inhalation. Aerosol Sci Technol. 45(12):1422–1428.
- Ingham DB. 1975. Diffusion of aerosols from a stream flowing through a cylindrical tube. J Aerosol Sci. 6(2):125–132.
- International Commission on Radiological Protection (ICRP). 1994. Human respiratory tract model for radiological protection. ICRP Publication 66. Oxford: Elsevier Science.
- Koblinger L, Hofmann W. 1985. Analysis of human lung morphometric data for stochastic aerosol deposition calculations. Phys Med Biol. 30(6):541–556.
- Koblinger L, Hofmann W. 1990. Monte Carlo modeling of aerosol deposition in human lungs. Part I: simulation of particle transport in a stochastic lung structure. J Aerosol Sci. 21(5):661–674.
- Kudo Y, Saji H, Shimada Y, Nomura M, Usuda J, Kajiwara N, Ohira T, Ikeda N. 2012. Do tumours located in the left lower lobe have worse outcomes in lymph node-positive non-small cell lung cancer than tumours in other lobes. Eur J Cardiothorac Surg. 42(3):414–419.
- Möller W, Meyer G, Scheuch G, Kreyling WG, Bennett WD. 2009. Left-to-right asymmetry of aerosol deposition after shallow bolus inhalation depends on lung ventilation. J Aerosol Med Pulm Drug Del. 22:333–339.
- Parkash O. 1977. Lung cancer. A statistical study based on autopsy data from 1928 to 1972. Respir. 34(5):295–304.
- Phillips CG, Kaye SR. 1997. On the asymmetry of bifurcations in the bronchial tree. Respir Physiol. 107(1):85–98.
- Pichelstorfer L, Winkler-Heil R, Hofmann W. 2013. Lagrangian/Eulerian model of coagulation and deposition of inhaled particles in the human lung. J Aerosol Sci. 64:125–142.
- Raabe OG, Yeh HC, Schum GM, Phalen R. 1976. Tracheobronchial geometry: human, dog, rat, hamster. Lovelace foundation report LF-53. Albuquerque, New Mexico: Lovelace Foundation.
- Sahmoun AE, Case LD, Santoro TJ, Schwartz GG. 2005. Anatomical distribution of small cell lung cancer: effects of lobe and gender on brain metastasis and survical. Anticancer Res. 25:1101–1108.
- Scherer PW, Shendalman LH, Green NM, Bouhuys A. 1975. Measurement of axial diffusivities in a model of the bronchial airways. J Appl Physiol. 38(4):719–723.
- Schiller CF, Gebhart J, Heyder J, Rudolf G, Stahlhofen W. 1988. Deposition of monodisperse insoluble aerosol particles in the 0.005 to 0.2 µm size range within the human respiratory tract. Ann Occup Hyg. 32:41–49.
- Schreider JP, Raabe OG. 1981. Structure of the human respiratory acinus. Am J Anat. 162(3):221–232.
- Stahlhofen W, Rudolf G, James AC. 1989. Intercomparison of experimental regional aerosol deposition data. J Aerosol Med. 2(3):285–308.
- Subramaniam RP, Asgharian B, Freijer JI, Miller FJ, Anjilvel S. 2003. Analysis of lobar differences in particle deposition in the human lung. Inhal Toxicol. 15(1):1–21.
- Tippe A, Tsuda A. 2000. Recirculating flow in an expanding alveolar model: experimental evidence of flow-induced mixing of aerosols in the pulmonary acinus. J Aerosol Sci. 31(8):979–986.
- Tsuda A, Henry FS, Butler JP. 1995. Chaotic mixing of alveolated duct flow in rhythmically expanding pulmonary acinus. J Appl Physiol. 79(3):1055–1063.
- Wang CS. 1975. Gravitational deposition of particles from laminar flows in inclined channels. J Aerosol Sci. 6(3–4):191–204.
- Weibel ER. 1963. Morphometry of the human lung. New York (NY): Academic Press.
- Winkler-Heil R, Ferron G, Hofmann W. 2014. Calculation of hygroscopic particle deposition in the human lung. Inhal Toxicol. 26(3):193–206.
- Yeh HC, Schum GM. 1980. Models of human lung airways and their application to inhaled particle deposition. Bull Math Biol. 42(3):461–480.
Appendix
The filtering efficiency of nasal and oral passages was considered by the empirical equations derived from in-vivo measurements by Cheng et al. (Citation1996) for the diffusion regime and by Stahlhofen et al. (Citation1989) for the impaction regime for both inspiration and expiration. Deposition by Brownian motion in upper bronchial airways was determined by the empirical equation proposed by Cohen and Asgharian (Citation1990) to account for enhanced deposition in upper bronchial airways due to developing flows. In more peripheral bronchiolar and acinar airways, Ingham’s (Citation1975) equation for diffusion under parabolic flow conditions was applied, while for expiratory flow a uniform flow profile due to secondary flows was assumed for all airways (Ingham Citation1975). Deposition by inertial impaction in bronchial airways was calculated according to Cai and Yu (Citation1988), assuming a uniform profile in upper bronchial airways, a parabolic profile in distal bronchiolar and acinar airways, and again a uniform profile upon expiration. In the trachea, the effect of the laryngeal jet was considered by the empirical equation proposed by Chan and Lippmann (Citation1980). Finally, deposition by sedimentation in tubular airways was computed by the equation provided by Wang (Citation1975).
For deposition by diffusion and sedimentation of inhaled particles in spherical alveoli, the equations proposed by Koblinger and Hofmann (Citation1990) were applied. Assuming that the most likely shape of an alveolus is that of a ¾ truncated sphere (Hansen and Ampaya Citation1975), an effective alveolar diameter was adopted for the deposition calculations (Hofmann and Koblinger Citation1990). To account for the random spatial orientation of alveoli relative to gravity, sedimentation efficiencies were divided by an approximate factor of 2 (Balásházy et al. Citation2008). Likewise, diffusional deposition efficiencies were reduced to relate computed deposition in spherical vessels to that in a truncated sphere (Choi and Kim Citation2007).