
 ?Mathematical formulae have been encoded as MathML and are displayed in this HTML version using MathJax in order to improve their display. Uncheck the box to turn MathJax off. This feature requires Javascript. Click on a formula to zoom.
ABSTRACT
Creatinine and intravenously infused Cr-EDTA complex were compared as markers for urinary volume estimation in cattle fed diets containing different concentrate levels. Ten Nellore heifers were used in a two-period crossover design and fed with two diets of divergent maize silage to concentrate ratios (90:10 and 50:50). The urinary marker concentrations were strongly and positively associated with each other, and both correlated strongly and negatively with total urine volume. Creatinine excretion and chromium recovery did not vary according to diets, but chromium recovery exhibited a lower variance among animals. The evaluation of urine spot samples showed that sampling time affects both markers, with the lowest urinary concentrations obtained when samples were taken early in the morning. Both creatinine and the Cr-EDTA complex produce similar estimates of urine volume. However, despite the greater precision of the estimates obtained with chromium, the values obtained with creatinine exhibited less bias and are, therefore, more accurate.
Introduction
In studies of ruminants, the total urine output is used to estimate microbial synthesis in the rumen and to quantify excretion of nitrogen (Hennessy & Nolan, Citation1988; Chen & Gomes, Citation1992; Menezes et al., Citation2016). Experimentally, the urine volume can be quantified by either total collection or using markers. Total urine collection is a laborious procedure and difficult to perform in production animals, especially grazing animals. Moreover, procedures for total urine collection can cause discomfort to the animals due to the use of probes or collecting funnels, which may affect their feeding and urination behaviour. Thus, the utilization of internal or external markers associated with spot sampling could be a more feasible and practical alternative to total urine collection.
The most used internal marker for urine volume is creatinine, a metabolite formed in the muscle from the breakdown of the phosphocreatine molecule through a non-enzymatic water removal (Nelson & Cox, Citation2013). This reaction occurs daily at relatively constant rates (approximately 2% of the total muscle creatine; González & Scheffer, Citation2003), indicating that creatinine excretion is proportional to the body mass and associated with animal body weight (Chizzotti et al., Citation2008; Costa e Silva et al., Citation2012). Therefore, from a limited number of urine spot samples, in which creatinine concentration is measured, it is possible to estimate the urinary volume through the ratio of total excretion (obtained based on body weight) to urinary concentration. Studies in tropical and temperate climates have revealed that creatinine is an accurate marker for estimation of urinary output, and it is not affected by day of collection, sex, dietary energy, or nitrogen supplementation (Barbosa et al., Citation2006; Broderick & Reynal, Citation2009; Silva Jr et al., Citation2018, Citation2021; Tebbe & Weiss, Citation2018; Lee et al., Citation2019).
The primary external marker options are intravenous infusion of either lithium salts (Bowen et al., Citation2009) or chromium complex with ethylenediaminetetraacetic acid (Cr-EDTA; Downes & McDonald, Citation1964; Bowen et al., Citation2009). Nonetheless, the estimation of the urinary volume from intravenous administration of external markers requires knowledge about marker recovery in the urine and the nychthemeral variation of its excretion.
Lithium sulphate, when used as a marker of urinary volume, tends to exhibit a low recovery in the urine, which is also influenced by diet quality. This low recovery seems to be associated with its transfer from plasma to the rumen via saliva, causing a significant lithium loss in faeces (Bowen et al., Citation2009). Thereby, lithium may be qualified as an ineffective marker for urinary volume due to its high and variable bias in urinary recovery.
Studies using the Cr-EDTA complex as an intravenous marker showed recoveries higher than 0.90 g/g of infused chromium, which was considered constant among animals in both sheep (Downes & McDonald, Citation1964) and cattle (Bowen et al., Citation2009). Incomplete recovery of infused chromium seems to be associated with its fecal excretion, which may represent 2–5% of the infused marker (Bowen et al., Citation2009), or with the possible binding of chromium to albumin (Fogh-Andersen, Citation1980). Moreover, urine spot sampling at short intervals (every 2–3 h) should be used due to the high nychthemeral variation of urinary chromium concentration (Bowen et al., Citation2009). Such a sampling procedure may be a disadvantage compared to the use of creatinine for urinary volume estimation. On the other hand, using an intravenous catheter for infusing the marker and the requirement for a peristaltic pump coupled to the animals may cause discomfort and be a constraint for experimental management, especially with grazing animals. Therefore, although Cr-EDTA may have potential as a marker of urinary volume, essential details require clarification, such as its use in different diets or a group of animals with significant body weight (BW) variation, and issues associated with a likely chromium toxicity. Although the chromium associated with Cr-EDTA complex is Cr(III) (Hall & Van Soest, Citation2020), which is considered of low toxicity (NRC, Citation1997), it has been suggested that chromium be replaced as a marker in digestion and metabolism studies (Myers et al., Citation2004).
The use of creatinine presents additional advantages over metallic external markers. Its concentration is usually evaluated by a simple, inexpensive, and routine laboratory analysis. Metallic external markers, however, such as chromium, require expensive and more complex instrumental techniques, such as atomic absorption spectrophotometry.
To our knowledge, there are no studies comparing creatinine and Cr-EDTA as markers for urinary volume estimation that consider its accuracy, precision, and sensitivity. Therefore, we hypothesized that creatinine and the Cr-EDTA complex have similar accuracy, precision, and sensitivity as markers for urinary volume estimation in cattle. The objective of this study was to compare creatinine and intravenously infused Cr-EDTA complex as markers for urinary volume estimation in cattle consuming diets with different concentrate levels.
Material and methods
This experiment was conducted at the Department of Animal Science, Universidade Federal de Viçosa, Minas Gerais, Brazil.
Animal, diets, and management
Ten Nellore heifers, averaging 392 ± 7 kg BW, were included in the study. The heifers were housed in individual stalls (2 × 5 m) with concrete floors and equipped with individual feeders and water dispensers. Heifers had ad libitum access to a commercial macro/micro mineral mixture (80 and 60 g/kg of phosphorus and sodium, respectively).
The animals were fed on two maize silage-based diets balanced to provide 120 g of crude protein (CP)/kg of dry matter (DM) at different forage-to-concentrate ratios (90:10 and 50:50, on a DM basis). In both diets, the concentrate mixtures were composed of soybean meal and ground maize grains (). The predicted dietary contents of rumen degradable crude protein and digestible energy were 709 g/kg CP and 11.88 MJ/kg DM, and 615 g/kg CP and 13.64 MJ/kg DM for the 90:10 and 50:50 diets, respectively (Valadares Filho et al., Citation2018). Animals were offered their diets for ad libitum intake at 06:00 and 18:00 h, allowing 100 g/kg in orts.
Table 1. Chemical composition of the maize silage and concentrate mixtures.
The experiment was conducted using a crossover design (Cochran & Cox, Citation1957), with ten animals, two diets, and two experimental periods. The periods lasted 26 d each, and the first 14 d were allocated for adapting animals to the experimental diets (Machado et al., Citation2016). Measurements were performed from d 15 to d 26 within each period. For the first period, half of the animals were assigned to each diet. The diets were then switched among animals in the second experimental period, so all animals were evaluated with both experimental diets during the experiment. Animals were weighed at the beginning and end of each experimental period in order to estimate the average BW.
Sample collections
On d 10 of each experimental period, heifers were fitted with temporary central venous catheters (multi-lumen central venous catheter, 14G × 20 cm, Intra Special Catheters GmbH, Rehlingen-Siersburg, Germany) into the jugular vein for chromium infusion. The catheter was flushed with a heparin-saline solution (200 IU/mL) to avoid clogging with clotted blood. A saline solution (NaCl, 9 g/L) was infused on d 11 from 6:00 h at 5 mL/h for 24 h using a multi programmable syringe pump (BS-9000/6 Multi-phaser, Braintree Scientific Inc, Braintree, MA, USA). This procedure aimed at calibrating the pump and adapting the animals to the continuous infusion. From 6:00 h of d 12 until 24:00 h of d 18, the Cr-EDTA solution was continuously infused at a similar rate.
The Cr-EDTA solution was prepared as described by Binnerts et al. (Citation1968). After preparation, the final pH of the solution was adjusted to 7.0 by the addition of approximately 22 g/L of sodium hydroxide (NaOH). Chromium concentration in the solution was measured according to procedures described by Rocha et al. (Citation2015). On average, 262.3 ± 0.20 and 255.1 ± 0.07 mg/d of chromium were infused in the first and second periods, respectively.
From d 15 to d 17, urine was collected quantitatively through a two-way Foley probe (number 26, Rush Amber, Kamuting, Malaysia) with a 30-mL balloon. At the free end of the probe, a polyethylene tube was attached through which the urine was conducted to a clean urine collection vessel (20 L). Vessels were held constantly on ice in Styrofoam boxes. The collections began at 6:00 h on d 15. At the end of each 24-h period, urine output was measured and mixed thoroughly, and two aliquots (50 mL) were taken and filtered through four layers of cheesecloth. The first aliquot was frozen (−20°C) for subsequent chromium analysis. The second aliquot was diluted (1:4) in an H2SO4 solution (0.036 N) before freezing for later analysis of creatinine concentration.
On d 18 of each experimental period, urine and blood spot collections were performed at 6:00, 12:00, 18:00, and 24:00 h. Urine was collected by stimulating the area below the vulva. Two aliquots were taken at each collection time as previously described for the total urine collection. Blood was collected from the jugular vein opposite the Cr-EDTA infusion using vacuum tubes with either coagulation accelerator gel (BD Vacutainer®, SST II Advance, Franklin Lakes, NJ, USA) for serum collection or coagulation inhibitor (BD Vacutainer® K2, Franklin Lakes, NJ, USA) for plasma collection. Tubes were promptly centrifuged to separate serum and plasma. On d 18 of each period, total faecal collection was performed to measure faecal chromium excretion. It started at 06:00 h, and after 24 h, the faeces were weighed and homogenized manually. An aliquot of 50 g/kg was oven-dried (55°C) and processed in a knife mill to pass through a 1-mm screen sieve.
From d 19 to d 25 of each experimental period, voluntary intake and total digestibility were quantified. The amount of diet offered from d 19 to d 24 and orts obtained from d 20 to d 25 were taken into account for voluntary intake quantification. Total faecal collection was performed at d 20, d 22, and d 24 of each period. The faeces collection procedures and sampling were the same as those previously described. Samples of diet, orts, and faeces were oven-dried and ground as previously described, pooled per animal within the experimental period, and stored for subsequent analysis.
On the day before the beginning of the experiment and at d 26 of each experimental period, a liver biopsy was performed (Herdt, Citation2013) to assess possible toxic effects of chromium. The liver samples were frozen using liquid nitrogen and kept at −80°C until the analysis.
Analyses and calculations
Samples of maize silage, concentrates, orts, and faeces were analysed for DM (dried over-night at 105°C, method G-003/1), ash (complete combustion in a muffle furnace at 600°C, method M-001/1), and CP (Kjeldahl procedure; method N-001/1) according to the standard analytical procedures of the Brazilian National Institute of Science and Technology in Animal Science (INCT-CA; Detmann et al., Citation2021). The neutral detergent fibre (NDF) contents were analysed using an autoclave method with a heat-stable α-amylase, but omitting sodium sulphite, according to procedures described by Barbosa et al. (Citation2015). The NDF contents were expressed exclusive of residual ash and protein (NDFap).
Chromium concentrations in faeces, plasma, serum, and urine samples were quantified by atomic absorption spectrophotometry (Avanta Σ, GBC Scientific, Braeside, Victoria, Australia) according to the procedures proposed by Rocha et al. (Citation2015). Urinary creatinine concentration was quantified by the enzymatic-colorimetric method (Bioclin® K067) in an autoanalyser (BS200E, Mindray, China).
After thawing, liver samples were analysed for α-ketoglutarate dehydrogenase activity. Sample preparation, reactions, and spectrophotometric evaluation were performed according to the Abcam ab185440 colorimetric method.
Chromium recovery in total urine samples (for each collection day) was calculated as the ratio of total chromium excreted to the amount infused daily. In the same samples, daily creatinine excretion was computed relative to the average BW of the animals within each experimental period.
From the average concentrations of creatinine and chromium in urine spot samples, the urinary volume was estimated by the following equations:
(1)
(1)
(2)
(2)
in which UVcr and UVcre are the urinary volumes (L/d) estimated from chromium and creatinine, respectively, D is the infused dose of chromium (mg/d), R is the urinary chromium recovery obtained by total urine collection (mg/mg), [Cr] is the average chromium concentration in urine spot samples (mg/L), BW is the average body weight (kg), E is the daily creatinine excretion obtained by total urine collection (mg/kg BW), and [Cre] is the average creatinine concentration in urine spot samples (mg/L).
The experiment was analysed using a model that included the fixed effect of diets and the random effects of animals and experimental periods. The variance components were estimated using the residual maximum likelihood method. Furthermore, variance components were standardized as a function of the mean values using the equation:
(3)
(3) in which RSD is the relative standard deviation,
is the estimate of variance component, and
is the average value of the response variable.
The following were analysed as repeated measures: urinary volumes; chromium concentration, excretion, and recovery; creatinine concentration and excretion over the days of total collection; the hepatic activity of α-ketoglutarate dehydrogenase; and the fluctuation pattern of blood chromium concentration and chromium and creatinine concentrations in the spot samples. The best structure of the (co)variance matrix was chosen based on the Akaike information criterion with correction. For all evaluated variables, the (co)variance matrixes were interpreted using a compound symmetry structure (Kaps & Lamberson, Citation2004).
The comparison between the actual urine volume (mean of the three days of total collection) and the volume predicted by both markers in spot samples (Equations 1 and 2) was performed by a simple linear regression adjustment, in which the predicted values were considered as the independent variable and the actual values as the dependent variable. In this case, we evaluated two null hypotheses: intercept equals zero, and slope equals unity. The predicted and observed values were considered similar when both null hypotheses were not rejected. Before adjusting regression models, data were adjusted for the random variation of animals and experimental periods. Additionally, the mean square of prediction error (MSPE) for both markers was quantified and decomposed, according to Bibby and Toutenburg (Citation1977).
For all statistical evaluations, significant effects were declared at P < 0.05.
Results
The voluntary intake was increased (P < 0.01) as the dietary concentrate increased (). The 50:50 diet had a higher CP digestibility (P < 0.03) and a lower fibre digestibility (P < 0.02). Despite the absence of difference between diets in organic matter (OM) digestibility, the 50:50 diet caused a greater digested OM intake (P < 0.01), implying a greater digestible energy intake.
Table 2. Voluntary intake and total digestibility in heifers fed diets with different forage-to-concentrate ratios.
The total volume of urine and the chromium and creatinine concentrations in urine were not affected by diets, collection days, or their interaction (P ≥ 0.08, ). The urinary concentrations of the markers were strongly and positively associated with each other (P < 0.01), and both correlated strongly and negatively (P < 0.01) with total urine volume (). The residual variances were very similar for urine volume and urinary concentrations of markers ((a)). However, the variation among animals was lower for marker concentrations in urine than for urinary volume. The intraclass correlations (i.e. the correlation among collection days within animal) were very similar for total urine volume and creatinine concentrations, but rather stronger for chromium concentration in urine.
Figure 1. Residual and between animals relative standard deviations and intraclass correlation (correlation between measures within animals taken on different collection days) in heifers fed diets with different forage-to-concentrate ratios. (a) – urinary excretion and urinary concentrations of creatinine and chromium; (b) – urinary creatinine excretion and urinary chromium recovery.
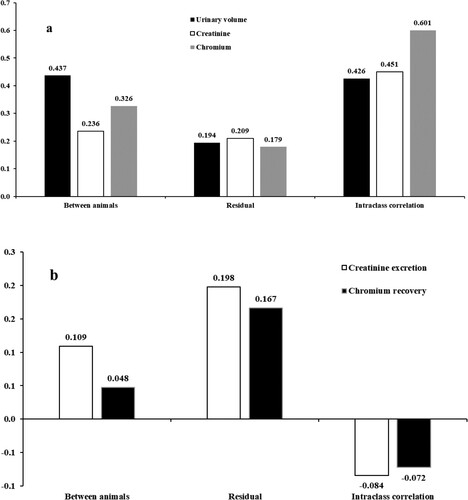
Table 3. Total urinary volume and urinary concentrations of creatinine and chromium in heifers fed diets with different forage-to-concentrate ratios according to the collection days.
Table 4. Pearson correlations between urine volume and urinary creatinine and chromium concentrations in heifers fed diets with different forage-to-concentrate ratios.
Creatinine excretion (mg/kg BW) did not vary according to diets, collection days, or their interaction (P ≥ 0.07, ). An additional analysis (data not shown) revealed that creatinine excretion as a function BW did not vary among animals (P > 0.85), averaging 18.36 ± 1.37 mg/kg BW. Urinary chromium recovery was also not affected by diets, collection days, or their interaction (P ≥ 0.71), averaging 1.37 ± 0.08 mg/mg. The residual variance was similar for creatinine excretion and chromium recovery ((b)). However, chromium recovery exhibited a lower variance among animals. The intraclass correlations for these variables were weak and close to zero.
Table 5. Creatinine excretion and urinary chromium recovery in heifers fed diets with different forage-to-concentrate ratios according to the collection days.
The evaluation of spot samples showed the influence of neither diets (P ≥ 0.46) nor the interaction between diets and time of collection (P ≥ 0.07) on the urinary concentrations of both markers (). However, the sampling time did affect (P < 0.01) both markers. Similarly in both markers, the highest and lowest urinary concentrations were obtained (P < 0.05) when samples were taken at 24:00 and 6:00 h, respectively.
Table 6. Urinary concentrations of creatinine and chromium in heifers fed diets with different forage-to-concentrate ratios according to the time of urine collection (spot samples).
The plasma and serum chromium concentrations were not affected by diets, collection times, or their interaction (P ≥ 0.32). On average, we found more chromium in serum than plasma ().
Table 7. Serum and plasma chromium concentrations in heifers fed diets with different forage-to-concentrate ratios according to blood collection times.
Both creatinine and chromium produced accurate estimates of urinary volume (P ≥ 0.33, and ). However, the estimates of intercept and slope were closer to the parametrical values (Equation 4) for creatinine than chromium. Creatinine also exhibited lower mean prediction error, MSPE, and mean and systematic biases than chromium. Most of the MSPE for creatinine was composed of random errors (73.2%). However, in absolute values, chromium presented lower random variation than creatinine.
Figure 2. Relationship between predicted and observed values of urinary volumes in heifers fed diets with different forage-to-concentrate ratios [the continuous lines represent the equality (Y = X); the dashed lines represent least square straight lines. Data were adjusted for the random effects of animals and experimental periods. For details on the adjusted equations, please see . (a), creatinine; (b), chromium.
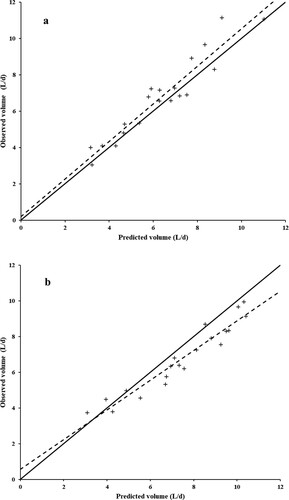
Table 8. Evaluation statistics of the estimated values of urinary volume (L/d) from spot samples in heifers fed diets with different roughage concentrate ratios as a function of the creatinine and chromium markers.
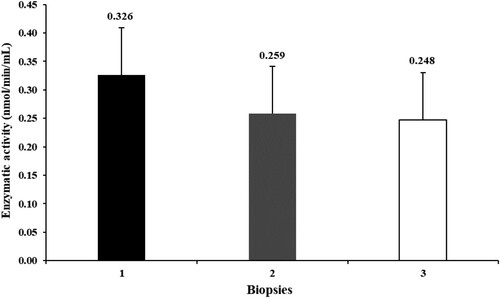
The activity of hepatic α-ketoglutarate dehydrogenase did not vary throughout the experiment (P > 0.76, ).
Figure 3. Activity of the α-ketoglutarate dehydrogenase in the liver of heifers fed diets with different forage-to-concentrate ratios in different biopsies during the experiment (1, beginning of the experiment; 2, end of the first experimental period; 3, end of the second experimental period; P = 0.76).
Discussion
As expected, the voluntary intake increased when we increased the dietary concentrate. The simultaneous impact of diets on digestibility and voluntary intake caused differences regarding energy intake between diets. Thus, the diets evaluated created distinct scenarios of energy feeding and could represent the feeding of cattle under different production conditions.
All variables evaluated as repeated measures over time provided a better fit of the model to the data using a compound symmetry structure for interpretation of the (co)variance matrix. In this sense, the main characteristics of this matrix structure should be highlighted: a homogeneity of residual variance between the different measures, and the presence of a constant intraclass correlation (Kaps & Lamberson, Citation2004). The first characteristic is beneficial in terms of experimental procedures as a heterogeneous variability between collection days would be undesirable and could compromise either the establishment of sampling protocols or the accuracy of measurements. In the second case, the constancy in the intraclass correlation directly represents constancy in the correlation between the measurements within the same animal, which can also be desirable in guaranteeing the establishment of accurate sampling protocols.
To be considered suitable as a marker, any substance, molecule, or compound must demonstrate sensitivity to the natural variation of the response variable being measured. Hence, considering that amounts of chromium infused and muscle creatinine production are constant within a day, any increase in urinary volume should lead to greater dilution of the marker in the total amount of produced urine. This pattern was verified in the present study since the urinary concentrations of chromium and creatinine were strongly and negatively correlated with urinary volume.
However, to assure the sensitivity and precision of the estimates, the markers must be able to account for the natural variability between animals, while concurrently maintaining the residual variance at similar levels to that obtained with the total urinary collection. In this context, both markers showed lesser variability between animals compared to the total collection. This result directly represents a loss in the ability to discriminate animals, which may be undesirable in terms of discrimination power under different experimental conditions (e.g. diets or genetic groups). It seems to be justified by the fact that the correlations between urinary concentrations of markers and urinary volume are strong, but not perfect (i.e. r = −1). The strongest intraclass correlation for chromium compared to total urine volume and urinary creatinine concentration results from the fact that chromium is an external marker, with total control of the amount infused, whereas urine volume and creatinine production result from biological processes, with a greater number of interferences or variations not subject to experimental control.
Similar to our findings, other authors observed no effects in the daily excretion of creatinine (mg/kg BW) between different diets and collections days (Albin & Clanton, Citation1966; Barbosa et al., Citation2006; Silva Jr et al., Citation2018, Citation2021). However, despite no variation in creatinine excretion relative to animals’ BW, the average estimate obtained (18.36 mg/kg BW) was substantially lower than other values obtained in the tropics (Chizzotti et al., Citation2006; Rennó et al., Citation2008; Silva Jr et al., Citation2018, Citation2021). A probable explanation for this low creatinine excretion could be associated with compensatory growth in our experimental animals. Despite being fed low- or moderate-concentrate diets and having a low average intake compared to production animals (average of 15.1 and 18.5 g DM/kg BW for 90:10 and 50:50 diets, respectively), our animals had an average gain of 42.2 ± 5.4 kg during the experimental period. That pattern suggests that animals probably were underfed before the experiment, even though they had a good body condition score at the beginning of the experiment. Any feeding management that restricts the growth rate of young animals, even slightly, can lead to a later period of compensatory growth, supporting our hypothesis. When animals are underfed, the renal creatinine clearance may change (Keenan & Allardyce, Citation1986), which implies a decreased blood creatinine concentration during the period of compensatory gain (Hornick et al., Citation1998). Thus, with a lowered blood creatinine concentration, it would be possible to obtain reduced urinary excretion of creatinine during the periods when the compensatory gain occurs.
The constant recovery of urinary chromium between diets and collection days would enable the use of chromium as a marker for urinary volume estimation. However, the average urinary chromium recovery obtained in this study was 1.37 mg/mg, which differs from the values obtained by Downes and McDonald (Citation1964) and Bowen et al. (Citation2009), who reported in sheep and cattle, respectively, urinary chromium recoveries close to 0.9 mg/mg. Bowen et al. (Citation2009) reported that a portion of the chromium not recovered in the urine was eliminated in the animals’ faeces (2–5%). However, we did not detect any chromium in faeces (data not shown).
Recovery estimates above 1.0 indicate more urinary chromium than that infused in blood, which may seem contradictory at first. Several authors reported the possibility of tubular reabsorption of the infused chromium (Heath et al., Citation1968; Bröchner-Mortensen et al., Citation1969; Ditzel et al., Citation1972). However, at medium- to long-term, the reabsorption rate becomes inherent to urine clearance dynamics and chromium recovering rate will tend towards 1.0. The most likely cause of the chromium recovery observed in this study is an interaction between the matrix of samples and atomic absorption. Matrix interferences may increase or decrease the signal and occur because the physicochemical characteristics of the sample matrix (viscosity, burn speed, surface tension) may differ substantially from the calibration curve standards and, or because of the difference on concentration of dissolved salts, acids, and bases (Izário Filho et al., Citation2012). The Cr-EDTA is a simple solution and its chromium contents were close to the expected concentration described by Binnerts et al. (Citation1968). Therefore, the high observed chromium recovery only could be caused by an overestimated chromium content in urine samples. Cattle urine presents several minerals, including many cations (Early et al., Citation1998). Some cationic interferences, such those from Ca, Mg, and Cu, may increase absorption and overestimate chromium contents (Yanagisawa et al., Citation1970). The absence of those elements in standard solutions and Cr-EDTA seems be responsible for the interaction between chromium quantification and matrices, causing the high chromium recovery observed herein.
The daily excretion of creatinine and the recovery of chromium are the base values for the estimation of urinary volume based on urine spot sampling (Equations 1 and 2). Evaluation of the variability of both characteristics showed similar precision for both markers since it produces a similar pattern of residual variation. However, in terms of variability between animals, there was less sensitivity for chromium than creatinine. The intraclass correlations for both markers were weak and close to zero, which is consistent with the fact that both the amount of chromium infused and the amount of creatinine produced in muscle tissue were constant among collection days.
In contrast, we detected a variation in the marker concentrations among urine spot samples taken at different sampling times. This within-day variation in urinary creatinine concentration was previously verified by several authors (De Groot & Aafjes, Citation1960; Kertz et al., Citation1970: George et al., Citation2006; Lee et al., Citation2019). The main reason for this variation seems to be associated with the fluctuations in the urinary volume released throughout the day, which exerts differences in the dilution pattern of creatinine and chromium retained in the bladder. Notably, there was no variation in the blood chromium throughout the day, which supports that the amount of circulating chromium for renal filtration was stable within a given day. The same pattern should logically have occurred for creatinine. Therefore, it seems unlikely that blood fluctuations of the marker concentrations caused fluctuations in urinary concentration. Shingfield and Offer (Citation1998) and Misselbrook et al. (Citation2016) found greater urinary volume at the first morning urination, which may be related to higher water consumption during the night (Shingfield & Offer, Citation1998) or to the retention of urine during this period, since it is the period when the animals are resting. Considering a constant production of creatinine throughout the day (De Groot & Aafjes, Citation1960) and the constant infusion of chromium, there would be likely a greatest urinary dilution of the markers in the morning, as we found in this study.
Despite the variation in the urinary creatinine concentration, the relationship between purine derivatives and creatinine tends to be constant throughout the day (Silva Jr et al., Citation2018, Citation2021), which would not compromise the estimation of microbial protein synthesis. However, estimates of urinary volume can be compromised due to the fluctuation in the concentration of markers, which makes it difficult to establish an adequate spot sampling protocol (Lee et al., Citation2019). The number of sampling points in this work should not be considered sufficient for an adequate study of sampling protocols. Thus, to verify the accuracy and precision of urinary volume estimates, we decided to use the average urinary concentration of all spot samples obtained. For this procedure, we used the mean values of excretion of creatinine and recovery of urinary chromium obtained by total urine collection as the parameters R and E in the equations (1) and (2), respectively.
Considering the statistical hypotheses (Equation 4), both chromium and creatinine estimated the urinary volume accurately. However, a more refined investigation of the estimated urine volumes by using the decomposition of the MSPE indicated lower biases and, consequently, greater accuracy for the use of creatinine as a marker of urinary volume. The lower accuracy constituted the main limitation of chromium: the mean and systematic biases accounted for 53.3 and 14.9%, respectively, of the MSPE. An inherent limitation of creatinine compared to chromium was its lower precision, since its random errors, in absolute terms, were much greater than those observed for chromium. There are two possible causes of this pattern. First, as noted earlier, the chromium dosage was fixed, as it is an external marker, whereas there is no experimental control over creatinine production in the muscle. Second, as reported by other authors, there may be variation in creatinine production per unit of BW among animals (Shingfield & Offer, Citation1998; Lee et al., Citation2019). Differences in body composition between animals may be responsible for this greater random variation since the production of creatinine is not proportional to weight but to muscle mass (Costa e Silva et al., Citation2014).
It has been suggested that chromium be replaced as a marker in studies of digestion due to its probable toxic and carcinogenic effects (Myers et al., Citation2004). Although the chromium used as a marker in this study was Cr (III), considered of low toxicity (NRC, Citation1997), its possible toxic effects were evaluated. An excess of chromium in its most toxic forms [Cr (V) or Cr (VI)] can reduce mitochondrial oxygen consumption by inhibiting the α-ketoglutarate dehydrogenase enzyme, which supplies the respiratory chain with NADH (Ryberg & Alexander, Citation1990). However, the liver assessment did not reveal any variation in α-ketoglutarate dehydrogenase activity throughout the experiment. Our findings agree with the descriptions of Stacy and Thorburn (Citation1966), who did not report hepatic or renal changes after intravenous injection of the Cr-EDTA complex in rats.
Conclusions
Both creatinine and the Cr-EDTA complex produce similar estimates of urine volume to those obtained from the total collection of urine in cattle. However, despite the greater precision of the estimates obtained with chromium, the values obtained with creatinine exhibit less bias and are, therefore, more accurate. Based on this, considering the high cost and difficulties in the experimental management, creatinine is a more suitable marker to estimate urine volume in cattle when compared with Cr-EDTA.
Ethical standards
All practices involving the use of animals were approved by the Ethics Committee on the Use of Production Animals of the Universidade Federal de Viçosa (Protocol no. 112/2018).
Disclosure statement
No potential conflict of interest was reported by the author(s).
Additional information
Funding
References
- Albin, R. C. & Clanton, C. (1966). Factors contributing to the variation in urinary creatinine and creatinine-nitrogen ratios in beef cattle. Journal of Animal Science, 25, 107–112.
- Barbosa, A. M., Valadares, R. F. D., Valadares Filho, S. C., Véras, R. M. L., Leão, M. I., Detmann, E., Paulino, M. F., Marcondes, M. I. & Souza, M. A. (2006). Effect of urinary collection days, concentrate levels and protein sources on creatinine, urea and purine derivatives excretions and microbial protein synthesis in Nellore cattle. Revista Brasileira de Zootecnia, 35, 870–877.
- Barbosa, M. M., Detmann, E., Rocha, G. C., Franco, M. O. & Valadares Filho, S. C. (2015). Evaluation of laboratory procedures to quantify the neutral detergent fiber content in forage, concentrate, and ruminant feces. Journal of AOAC International, 98, 883–889.
- Bibby, J. & Toutenburg, H. (1977). Prediction and Improved Estimation in Linear Models (New York: John Wiley & Sons).
- Binnerts, W. T., Vant Klooster, A. T. & Frens, A. M. (1968). Soluble chromium indicator measured by atomic absorption in digestion experiments. Veterinary Records, 82, 470.
- Bowen, M. K., Poppi, D. P. & McLennan, S. R. (2009). Recovery of intravenously infused chromium EDTA and lithium sulphate in the urine of cattle and their use as markers to measure urine volume. Animal, 3, 548–556.
- Bröchner-Mortensen, J., Giese, J. & Rossing, N. (1969). Renal inulin clearance versus total plasma clearance of 51Cr-EDTA. Scandinavian Journal of Clinical and Laboratory Investigation, 23, 301–305.
- Broderick, G. A. & Reynal, S. M. (2009). Effect of source of rumen-degraded protein on production and ruminal metabolism in lactating dairy cows. Journal of Dairy Science, 92, 2822–2834.
- Chen, X. B. & Gomes, M. J. (1992). Estimation of Microbial Protein Supply to Sheep and Cattle Based on Urinary Excretion of Purine Derivatives-An Overview of the Technical Details (Aberdeen: Rowett Research Institute).
- Chizzotti, M. L., Valadares Filho, S. C., Valadares, R. F. D., Chizzotti, F. H. M., Campos, J. M. S., Marcondes, M. I. & Fonseca, M. A. (2006). Intake, digestibility and urinary excretion of urea and purine derivatives in heifers with different body weights. Revista Brasileira de Zootecnia, 35, 1813–1821.
- Chizzotti, M. L., Valadares Filho, S. C., Valadares, R. F. D., Chizzotti, F. H. M. & Tedeschi, L. O. (2008). Determination of creatinine excretion and evaluation of spot urine sampling in Holstein cattle. Livestock Science, 113, 218–225.
- Cochran, W. G. & Cox, G. M. (1957). Experimental Designs. 2nd ed. (Bombay: Asia Publishing House).
- Costa e Silva, L. F., Valadares Filho, S. C., Chizzotti, M. L., Rotta, P. P., Prados, L. F., Valadares, R. F. D., Zanetti, D. & Braga, J. M. S. (2012). Creatinine excretion and relationship with body weight of Nellore cattle. Revista Brasileira de Zootecnia, 41, 807–810.
- Costa e Silva, L. F., Valadares Filho, S. C., Chizzotti, M. L., Rotta, P. P., Zanetti, D., Valadares, R. D. F. & Detmann, E. (2014). Models to predict muscle tissue and crude protein in beef cattle. Livestock Science, 160, 186–193.
- De Groot, T. & Aafjes, J. H. (1960). On the constancy of creatinine excretion in the urine of the dairy cow. British Veterinary Journal, 116, 409–418.
- Detmann, E., Costa e Silva, L. F., Rocha, G. C., Palma, M. N. N. & Rodrigues, J. P. P. (2021). Métodos para análise de alimentos (Visconde do Rio Branco, Brazil: Suprema).
- Ditzel, J., Vestergaard, P. & Brinkløv, M. (1972). Glomerular filtration rate determined by 51Cr-EDTA-complex: A practical method based upon the plasma disappearance curve determined from four plasma samples. Scandinavian Journal of Urology and Nephrology, 6, 166–170.
- Downes, A. M. & McDonald, I. W. (1964). The chromium-51 complex of ethylenediamine tetraacetic acid as a soluble rumen marker. British Journal of Nutrition, 18, 153–162.
- Early, M. S. B., Cameron, K. C. & Fraser, P. M. (1998). The fate of potassium, calcium, and magnesium in simulated urine patches on irrigated dairy pasture soil. New Zealand Journal of Agricultural Research, 41, 117–124.
- Fogh-Andersen, N. (1980). Binding of the chromium-ethylenediaminetetraacetic acid complex (Cr-EDTA) to human albumin. Scandinavian Journal of Clinical and Laboratory Investigation, 40, 805–808.
- George, S. K., Dipu, M. T., Mehra, U. R., Verma, A. K. & Singh, P. (2006). Influence of level of feed intake on concentration of purine derivatives in urinary spot samples and microbial nitrogen supply in crossbred bulls. Asian-Australasian Journal of Animal Sciences, 19, 1291–1297.
- González, F. H. D. & Scheffer, J. F. S. (2003). Perfil sanguíneo: ferramenta de análise clínica metabólica e nutricional. In F. H. D. González & R. Campos (eds.) Anais do I Simpósio de Patologia Clínica Veterinária da Região Sul do Brasil (Porto Alegre, Brazil: UFRGS), pp. 73–89.
- Hall, M. B. & Van Soest, P. J. (2020). Cobalt (III)-EDTA dissociates and chromium (III)-EDTA is slightly more stable under in vitro reducing conditions comparable to those in the rumen. Journal of Dairy Science, 103, 10152–10160.
- Heath, D., Knapp, M. & Walker, W. C. (1968). Comparison between inulin and 51Cr-labelled edetic acid for the measurement of glomerular filtration-rate. The Lancet, 292, 1110–1112.
- Hennessy, D. W. & Nolan, J. V. (1988). Nitrogen kinetics in cattle fed a mature subtropical grass hay with and without protein meal supplementation. Australian Journal of Agricultural Research, 39, 1135–1150.
- Herdt, T. H. (2013). Liver Biopsy Procedure in Cattle (Lansing: Diagnostic Center for Population e Animal Health).
- Hornick, J. L., Van Eenaeme, C., Diez, M., Minet, V. & Istasse, L. (1998). Different periods of feed restriction before compensatory growth in Belgian Blue bulls: II. Plasma metabolites and hormones. Journal of Animal Science, 76, 260–271.
- Izário Filho, H. J., Salazar, R. F. S., Capri, M. R., Capri Neto, A., Alcântara, M. A. K. & Peixoto, A. L. C. (2012). State-of-the-art and trends in atomic absorption spectrometry. In M. A. Farrukh (ed.) Atomic Absorption Spectroscopy (Rijeka: In Tech),. pp. 13–36.
- Kaps, M. & Lamberson, W. (2004). Biostatistics for Animal Science (Wallingford: CABI Publishing).
- Keenan, D. M. & Allardyce, C. J. (1986). Changes in plasma creatinine levels of sheep during submaintenance feeding. Australian Veterinary Journal, 63, 29–30.
- Kertz, A. F., Prewitt, L. R., Lane, A. G. & Campbell, J. R. (1970). Effect of dietary protein intake on creatinine excretion and the creatinine-nitrogen ratio in bovine urine. Journal of Animal Science, 30, 278–282.
- Lee, C., Morris, D. L. & Dieter, P. A. (2019). Validating and optimizing spot sampling of urine to estimate urine output with creatinine as a marker in dairy cows. Journal of Dairy Science, 102, 236–245.
- Machado, M. G., Detmann, E., Mantovani, H. C., Valadares Filho, S. C., Bento, C. B., Marcondes, M. I. & Assunção, A. S. (2016). Evaluation of the length of adaptation period for changeover and crossover nutritional experiments with cattle fed tropical forage-based diets. Animal Feed Science and Technology, 222, 132–148.
- Menezes, A. C. B., Valadares Filho, S. C., Costa e Silva, L. F., Pacheco, M. V. C., Pereira, J. M. V., Rotta, P. P., Zanetti, D., Detmann, E., Silva, F. A. S., Godoi, L. A. & Rennó, L. N. (2016). Does a reduction in dietary crude protein content affect performance, nutrient requirements, nitrogen losses, and methane emissions in finishing Nellore bulls? Agriculture, Ecosystems & Environment, 223, 239–249.
- Misselbrook, T., Fleming, H., Camp, V., Umstatter, C., Duthie, C. A., Nicoll, L. & Waterhouse, T. (2016). Automated monitoring of urination events from grazing cattle. Agriculture, Ecosystems & Environment, 230, 191–198.
- Myers, W. D., Ludden, P. A., Nayigihugu, V. & Hess, B. W. (2004). A procedure for the preparation and quantitative analysis of samples for titanium dioxide. Journal of Animal Science, 82, 179–183.
- National Research Council (NRC). (1997). The Role of Chromium in Animal Nutrition (Washington, DC: National Academies Press).
- Nelson, D. L. & Cox, M. M. (2013). Lehninger: Principles of Biochemistry. 6th ed. (New York: McMillan).
- Rennó, L. N., Valadares Filho, S. C., Paulino, M. F., Leão, M. I., Valadares, R. F. D., Rennó, F. P. & Paixão, M. L. (2008). Urea levels in diet for steers of four genetic groups: Ruminal parameters, plasma urea, urea and creatinine excretions. Revista Brasileira de Zootecnia, 37, 556–562.
- Rocha, G. C., Palma, M. N. N., Detmann, E. & Valadares Filho, S. C. (2015). Evaluation of acid digestion techniques to estimate chromium contents in cattle feces. Pesquisa Agropecuária Brasileira, 50, 92–95.
- Ryberg, D. & Alexander, J. (1990). Mechanisms of chromium toxicity in mitochondria. Chemico-Biological Interactions, 75, 141–151.
- Shingfield, K. J. & Offer, N. W. (1998). Evaluation of the spot urine sampling technique to assess urinary purine derivative excretion in lactating dairy cows. Animal Science, 66, 557–568.
- Silva Jr, J. M., Rennó, L. N., Valadares Filho, S. C., Paulino, M. F., Detmann, E., Menezes, G. C. C., Martins, T. S., Paula, R. M., Rodrigues, J. P. P. & Marcondes, M. I. (2018). Evaluation of collection days and times to estimate urinary excretion of purine derivatives and nitrogen compounds in grazing Nellore cattle. Livestock Science, 217, 85–91.
- Silva Jr, J. M., Rodrigues, J. P. P., Valadares Filho, S. C., Detmann, E., Paulino, M. F. & Rennó, L. N. (2021). Estimating purine derivatives and nitrogen compound excretion using total urine collection or spot urine samples in grazing heifers. Journal of Animal Physiology and Animal Nutrition, 105, 861–873.
- Stacy, B. D. & Thorburn, G. D. (1966). Chromium-51 ethylenediaminetetraacetate for estimation of glomerular filtration rate. Science, 152, 1076–1077.
- Tebbe, A. W. & Weiss, W. P. (2018). Evaluation of creatinine as a urine marker and factors affecting urinary excretion of magnesium by dairy cows. Journal of Dairy Science, 101, 5020–5032.
- Valadares Filho, S. C., Lopes, S. A., Silva, B. C., Chizzotti, M. L. & Bissarro, L. Z. (2018). CQBAL 4.0. Brazilian tables of feed compostion for ruminantes. Available at www.cqbal.com.br
- Yanagisawa, M., Suzuki, M. & Takeushi, T. (1970). Cationic interferences in the atomic absorption spectrophotometry of chromium. Analytica Chimica Acta, 52, 386–389.