
Abstract
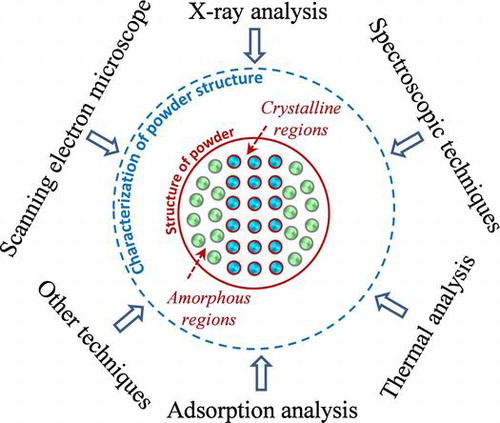
Food powders can exist in amorphous, crystalline or mixed structure depending on the order of molecular arrangement in the powder particle matrices. In food production, the structure of powders has a greatly effect on their stability, functionality, and applicability. The undesirable structure of powders can be accidentally formed during production. Therefore, characterization of powder structure as well as quantification of amorphous–crystalline proportions presenting in the powders are essential to control the quality of products during storage and further processing. For these purposes, many analytical techniques with large differences in the degree of selectivity and sensitivity have been developed. In this review, differences in the structure of food powders are described with a focus being placed on applications of amorphous powders. Essentially, applicability of common analytical techniques including X-ray, microscopic, vapor adsorption, thermal, and spectroscopic approaches for quantitative and qualitative structural characterization of food powders is also discussed.
The common techniques to quantitatively and qualitatively characterize the structure (amorphous and crystallize) of food powders.
I. Introduction
Food powders are dry and bulk solid materials containing very fine discreet particles with different size which ranges from nanometers to millimeters. Many commercial food products are found in powder forms such as flours, starches, sugars, salts, instant coffee, or powdered milks. Typically, food powders are produced either from solid materials through crushing, grinding, milling, pulverization, granulation, and mixing; or from liquid, paste, and slurry materials via dehydration (spray-, freeze-, drum-, and belt-drying) and crystallization of supersaturated solution.Citation1) The production method determines the type of the molecular arrangement in the powders, either in amorphous, crystalline, or mixed structure. Amorphous structure is formed as the molecules are randomly aligned while crystalline one is produced as the molecules are packed into a particular order.Citation2) For some products such as icing sugars produced by the grinding of granular sugars, coexistence of amorphous and crystalline phases, known as mixed structure, is also found.Citation3) The structure of powders greatly affects their stability and functionality in food production and further use. Generally, some commercial food powders exist in stable crystalline structure (such as sugars and salt) and presence of amorphous phase in the powders will have a high impact on properties and stability of the whole powders. Due to thermodynamically non-equilibrium state of amorphous phase, it can experience physically unwanted changes during handling, storage, and processing provided that an appropriate prevention procedure is applied. Many desirable properties of food powders are obtained through an alteration of their structure from crystalline to amorphous and vice versa.Citation1) As a result, an understanding of the structure and the quantification of amorphous/crystalline fractions in food powders are essential to control the quality of powder products during production and storage.
Owing to the differences on molecular mobility and molecular arrangement between amorphous and crystalline powders, many approaches to quantitatively and qualitatively investigate on their structure have been developed. The common techniques include X-ray diffraction, scanning electron microscope, polarized light microscope, thermal analysis (differential scanning calorimetry and thermogravimetry), gravimetric vapor sorption, inverse gas chromatography, nuclear magnetic resonance, Fourier transform infrared spectroscopy, Raman spectroscopy, solution calorimetry, true density, thermally stimulated current spectrometry, dynamic mechanical analysis, or dissolution analysis.Citation2) Different approaches are sensitive to different properties of food powders, and thus they respond differently to the same sample. Some of them (e.g. X-ray diffraction, spectroscopic techniques or true density) are known as bulk analytical techniques because they measure the average degree of molecular order of the whole sample. As amorphous faction can be a very small part of the total signal, it will be difficult for these techniques to detect with high confidence. Thus, their detection limits are typically higher than 10% of disorder in the powder. Other techniques such as water vapor adsorption which is based on a higher state of energy associated with the amorphous state, can measure the amounts of disorder as low as 1%.Citation4) Johari et al.Citation5) reported that X-ray diffraction was impossible to differentiate amorphous from microcrystalline solids, but two-step DSC scanning allowed to distinguish them. Similarly, it was reported that DSC failed to detect glass transition temperature (Tg) of beta-cyclodextrin (β-CD), hydroxypropyl-β-CD and their complex powders while thermally stimulated current technique was applicable.Citation6) Moreover, amorphous regions and/or amounts in the powders produced by different methods might be significantly dissimilar.Citation7) Therefore, the selection of appropriate analytical technique should be done to measure different parameters of materials which are most sensitive to a given analytical technique. In most cases, a combination of several techniques for accurate investigation on the structure of powders is preferred. Many comprehensive review papers have been reported on the utilization of these techniques for characterization and quantification of amorphous (crystalline) content in pharmaceutical compounds,Citation2, 4, 8–10) but there are no such papers for food powders.
In this review, the differences between structures of food powders and their significance on applications to food production and processing are discussed. Moreover, common analytical techniques for quantitative and qualitative characterizations of food powders in terms of identification of amorphous (crystalline) food powders, determination of important physical properties of amorphous powders (Tg, critical relative humidity (RH), or critical moisture content (MC)) and quantification of amounts of amorphous (crystalline) phase existing in the powders are also described.
II. The structure of food powders
The molecular arrangement determines the structure of food powders, either in crystalline, amorphous or mixed structure. Crystalline powders such as salts, sugars or organic acids are characterized by a long range order of molecular arrangement and a tightly packed structure. They are non-hygroscopic, free flowing, and interact with other external molecules (water, gas or volatile compounds) primarily on their surface or defects in crystals by reversibly weak hydrogen bonds.Citation11) Generally, crystalline powders are produced by crystallization of solutes from supercooled melt or supersaturation solution accomplished by removal of the solvent through evaporation and/or by cooling, or solid crystallization of amorphous powders at high MC, RH, and temperature.Citation1) On the contrary, amorphous powders have no long-range order arrangement and molecules are randomly packed to form an open and porous structure. This structure allows a significant amount of external molecules (water, gas or volatiles) to be occupied in such arrangement, giving them an ability to adsorb easily a greater amount of external molecules than crystalline counterpart at the same conditions.Citation11–13) Amorphous materials can be produced by solution-based (quenching of a melt and dehydration by spray-, drum-, or freeze-drying) and solid-based methods (milling and dehydration of crystalline hydrates).Citation2) They are unstable (thermodynamically non-equilibrium state) and tend to experience structural relaxation or crystallization to achieve a stable state of crystalline structure.Citation14) The phase transformation of amorphous powders is greatly affected by MC of powders as well as RH and temperature in which powders are exposed.Citation15)
Mixed structure of food powders is a coexistence of amorphous and crystalline structural regions in powders. There are few examples of many powder production processes in which the mixed structural powder can be formed. For example, in spray drying of powders, dried particles deposited on the drying chamber walls could possess a mixed structure because prolong exposure to high temperature and humidity in the drying chamber wall or in some cold zones where the local humidity could be very high possibly causes partially crystallization. This has been reported while spray drying of alpha-cyclodextrinCitation16) and lactose solutionsCitation17) in which deposited powders on the drier wall showed some degree of crystallinity. An addition of drying aids (high molecular weight substances such as maltodextrin powders) to change drying behavior of powders containing low molecular weight substances (glucose, fructose, lactose or organic acids) can create the mixed structural powders.Citation1) In milling (grinding) of powders, some microcrystalline structure can remain as only the mechanical force has been reported not to completely disrupt all the crystalline structure.Citation18) A typical example is the milling of granule sugars to produce icing sugar.Citation3)
The differences in molecular arrangement and properties between amorphous and crystalline food powders are summarized in Fig. Citation19) and Table .
Fig. 1. An illustration of molecular arrangement in crystalline, amorphous and mixed structural powders (Adapted from Bhandari and RoosCitation19)).
Table 1. Differences about structure and properties of amorphous and crystalline food powders.
III. Emerging applications of amorphous powders in food production
Production of amorphous products is inherent property of many processes. Freeze-, spray-, and drum-drying of a solution, or milling of solid materials can produce a partially or completely disordered structure powders.Citation2) Beside undesirable physical properties and changes (stickiness, lumping, caking, agglomerating, or crystallization) of amorphous powders or products containing amorphous components during storage and production,Citation14) amorphous powders are required and have numerous advantages as compared to crystalline ones in many food applications. A typical example is icing sugar (also known as powdered sugar or confectionery sugar) produced by milling of crystal sugars into very fine particles. Due to presence of large proportion of amorphous regions and very fine particles, icing sugar dissolves into water much more easily and quickly than crystal sugars. This property makes it become a preferred choice for food applications in which a quick dissolving sugar is required such as in preparation of fruits, milkshakes or any cold beverages, or for those in which the smoothness is required such as icing, frosting, and other cake decorations in bakery production or fondant.Citation20, 21) In production of chocolate and chocolate components which are subsequently used to fill/coat the confectionery products (peanut butter), the use of amorphous sugars instead of crystalline ones offers numerous advantages such as reduction of production cost, decrease of product calories and minimization of oil and/or water migration. It was reported that the use of amorphous starch derivative (e.g. corn syrup solid DE 42) to replace partially or wholly the crystalline sucrose allowed to produce chocolate and/or chocolate components having a desired texture, viscosity, moisture level, and/or Tg.Citation22)
Another example to demonstrate the importance of the production of amorphous materials are silica (silicon dioxide) powders. The differences in molecular structure of silica lead to a significant dissimilarity in toxicity and consequently applications. Unlike crystalline silica powders which are primarily used in civil engineering and construction industries and are a main cause for seriously pulmonary diseases for humans if they are exposed and/or inhaled, amorphous silica powders have been approved as a food additive (E551).Citation23) Moreover, current studies have been demonstrated that it is safe to use amorphous silica for food applications.Citation24–27) As a result, amorphous silica has already been applied in food products for many years. It is mainly used as an anticaking agent to maintain flow properties in powdered products, a dispersion agent to prevent the clumping of dried powders in liquids, a carrier for fragrances or flavors in food, suspending agent to stabilize emulsions, or thickening agent to control viscosity or dough mixing.Citation25, 27)
In encapsulation of volatile compounds, flavors and oils into biological materials using dehydration techniques (e.g. freeze drying or spray drying), the formed matrices inevitably exist in amorphous structure.Citation28) As mentioned above, the amorphous matrices are metastable and experience various time-dependent alterations in the physical properties if storage conditions (RH and temperature) are not appropriately controlled. When an amorphous systems containing encapsulated components collapses and/or crystallizes, the protective action of the solid matrices is lost, resulting in an increase of deteriorate reaction rates (e.g. release and oxidation of encapsulated oils) and an decrease in stability of solid matrices.Citation29) For this regard, many studies have been reported for different types of amorphous complexes prepared via encapsulation of volatile compounds, flavors, and oils into biological materials.Citation30–34) For such amorphous complexes, delay, and/or inhibition of crystallization are essential to increase the stability and range of applications. Crystallization of amorphous solid matrices can be avoided if they are kept either at temperature below Tg of solid matrices, or in airtight containers in which RH is controlled below their critical level of crystallization. Moreover, an incorporation of high molecular weight substances (polymers, sugars or salts) having a high Tg value into amorphous complexes during production can also delay the crystallization rate due to alteration of overall Tg of solid systems.Citation29)
Recently, an innovative encapsulation technique known as solid encapsulation using amorphous powders has been reported.Citation12, 13, 35) In this technique, a direct mixing of core (gas or volatile components) and amorphous solid materials is performed, by which a 100% yield can be obtained and procedure of encapsulation is much simpler. This technique has been successfully investigated for encapsulation of hydrophobic gases (C2H4 and CO2) and tea tree oil using amorphous cyclodextrin (CD) powder produced by spray drying of CD solution, aiming to food applications. CD powders typically including α-, β- and γ-CDs contain truncated-cone shaped molecules with hydrophobic cavity at the centre which can interact (host) with external hydrophobic compounds (guest molecule) such as volatiles, flavor oils, gases, vitamins, and pigments.Citation36) The complexation is formed as the result of molecular entrapment in the cavity due to size compatibility between encapsulated molecules and CD cavity. α-CD molecule with the smallest cavity (0.47–0.53 nm in diameter) is the most suitable solid matrix to form complexes with hydrophobic organic molecules having less than five carbon atoms especially gas molecules while β- and γ-CDs with a larger cavity dimeter (0.60-0.65 nm and 0.75-0.83 nm, respectively) can form complex with larger molecules such as volatiles, flavor oils, or pigments.Citation37)
In amorphous structure, molecules are not ordered, relatively porous. Therefore, in solid encapsulation of a gas such as CO2, amorphous α-CD powder showed many advantages in terms of encapsulation ratio at low pressure and short time as compared to crystalline one. At 0.4 MPa and 4 h, the former can encapsulate about 0.60 mol CO2/mol α-CD while the latter entrapped only 0.05 mol CO2/mol α-CD. Moreover, at the same encapsulation conditions, time required to reach a nearly equilibrium of encapsulation capacity was about 8 h for amorphous powder and more than 48 h for crystalline powder.Citation13) Similar results for C2H4 gas encapsulated into α-CD powders have been also reported. The C2H4 encapsulation ratio of crystalline α-CD powder was extremely low (less than 0.014 mol C2H4/mol α-CD at 1.5 MPa in 48 h) while that of amorphous counterpart was 0.45–0.87 mol C2H4/mol α-CD at the similar conditions.Citation12) However, inclusion complexes obtained by solid encapsulation method are not stable and the encapsulated gas is quickly lost during depressurization. This is because complex powder produced by this solid method still exists in amorphous structure. In order to stabilize these amorphous complexes, water was added to induce crystallization of amorphous complexes during complexation, by which encapsulation capacity and stability of complexes were significantly improved. Encapsulation of gas has been known for some time and there are a few important researches being reported, but it is still in infant stage in terms of development and application. Gas complexed in an edible and biocompatible form would be an attraction in food and agricultural industries.Citation38)
Tea tree oil (TTO) encapsulation of amorphous β-CD powder has been also investigated by direct complexation of TTO with amorphous β-CD powder with a ratio of 90.5:9.5 (104.9 mg of TTO/g β-CD), followed by recrystallization of the complex through an addition of water or ethanol.Citation39) The results showed that at 17% MC (on a wet basis, w.b.) or at 1:2 and 1:3 TTO: ethanol ratios, amorphous β-CD powder complexed up to 94.3–99.63 mg of TTO/g β-CD. This capacity was significantly higher than that of complex produced by direct mixing of crystalline β-CD powder with TTO (<60 mg TTO/g β-CD). This is because a large proportion of the TTO was only adsorbed on the surface of crystalline β-CD powder due to its highly packed structure. The overall description for the direct complexing technique using amorphous CD powders, following by recrystallization of amorphous complex is shown in Fig. . The types of complex crystals are formed depending on the nature of encapsulated guests. Smaller molecules such as gas (C2H4 or CO2) can form structural cage-type complex, while essential oils can from structural channel-type complex.Citation40, 41)
Fig. 2 Sketch of solid encapsulation using amorphous cyclodextrin powders.
IV. Solid-state techniques to characterize the structure of food powders
For characterization and quantification of amorphous (crystalline) content in material solids, a wide range of solid-state techniques (such as X-ray diffraction, thermal analyses, gravimetric techniques, spectroscopic techniques, true density measurement, dynamic mechanical analysis, and dissolution testing, etc.) have been applied, especially in pharmaceutical research and production. Because of an increasing usage of amorphous drugs as an approach to improve the performance of dosage forms, numerous studies and excellent review papers about the use of these techniques for drug characterization have been reported.Citation2, 4, 8–10) However, only few such papers have been reported for food powders. The main reasons are probably because the majority of food powders are complex (multi-phase, multi-component, and multi-scale) systems which make their characterization much more difficult. Nonetheless, due to great similarities in the structure between pharmaceutical solids and food powders, these solid-state methods can also be applied to qualitative and quantitative investigate of the structure of food powders. In the following sections, characteristics and applications of common solid-state analytical techniques for identification (differentiation) of amorphous and crystalline food powders, determination of important physical properties of amorphous powders (Tg, critical RH or critical MC), and quantification of amorphous (crystalline) content in the powders are described. The fundamental backgrounds about these techniques have been reported elsewhere and thus are intentionally omitted here. The common techniques described in this review include X-ray diffraction, scanning electron microscope, differential scanning calorimetry, adsorption techniques (gravimetric vapor sorption and inverse gas chromatography) and spectroscopy approaches (13C solid state nuclear magnetic resonance, Fourier transform infrared spectroscopy, Raman spectroscopy and terahertz pulsed spectroscopy).
IV.I. X-ray analyses
Among various X-ray diffraction (XRD) techniques, structural information on food powders such as crystal structure, crystalline state and crystallinity/amorphicity is commonly resolved using XRD. This is a non- destructive method that has been extensively applied in many fields owing to its accuracy, sensitivity, and relevance.Citation42) Primary components of X-ray diffractometers include a source of X-rays, a monochromator, a detector and a sample cell. Crystal lattice typically consists of repeating atomic planes which are apart from their adjacent planes by a d distance (d-spacings). When the incoming X-rays strike the powdered sample, they get diffracted from the series of atomic planes present in the materials according to Bragg’s law (nλ = 2d sinθ, in which n is an integer number refers to the order of reflection, λ is the incident wavelength of X-ray beam, d corresponds to the distance between the atomic planes and θ represents the reflection angle of the incident X-ray). Constructive interference of the diffracted X-ray beam is detected using a photographic film or an electronic counter.Citation43) Differences in the molecular arrangement between amorphous and crystalline powders result in dissimilarities on the X-ray patterns. When X-ray light hits lattice planes of crystalline materials, it scatters only in certain directions and gives high intensity narrow peaks whereas the random orientation of atoms of amorphous materials makes incident X-ray light to be scattered in random directions and causes broad peaks. This characteristic of X-ray spectral lines allows confirming amorphous–crystalline forms in various food powders (Fig. (a)). Analyses of diffractograms of pure amorphous, crystalline alpha-cyclodextrin (α-CD) and their complexes with carbon dioxide (CO2) showed that diffractograms of CO2 complexes with crystalline α-CD exhibited many sharp peaks, indicating their crystalline structure. Those of CO2 complexes with amorphous α-CD powder having 5.51% MC (w.b.) remained in the amorphous form as reflected by presence of two broad peaks in their XRD patterns. The complexed powders prepared from amorphous α-CD powder became crystallized when the moisture contents increased to 13, 15, and 17% w.b.Citation13, 35, 40) Similar approach was used to examine amorphous and crystalline states of lactose upon co-spray drying with polyethylene glycol 4000,Citation44) mango powder produced by various drying methodsCitation45) and spray-dried soy sauce powder with addition of crystalline carbohydratesCitation46) to name a few.
Fig. 3. XRD (a) and SEM (b) of amorphous and crystalline α-cyclodextrin powders (adapted from Ho et al.Citation16)).
Interpretation on the degree of long-range order can be undertaken by analyzing positions, intensities, and areas of X-ray diffracted peaks in diffractogram. For instance, crystals of alpha-lactose monohydrate in spray-dried dairy powder exhibit representative peaks at 2θ = 12.5°, 16.4°, 20.0°, and 20.1° while those of anhydrous beta-lactose are of 10.5°, 20.9°, and 21.0°.Citation47) Relative crystallinity of food powder can also be semi-quantified based on the height/intensity of the characteristic peak when the curves are symmetrical. In previous study performed on spray-drying of lactose solution having various concentrations of lactic acid, it was found that crystallinity of the lactose powders was increased with an increase of intensity of the characteristic peak (2θ = 20.1°) as lactic acid concentrations added to the lactose solutions prior to spray drying increased.Citation48) Using the crystalline maximum peak in the main signal region as 100% crystallinity, relative crystallinity of lactose powders spray dried at different drying conditions was quantified based on comparative scans.Citation49)
Conversion of XRD patterns into d-spacings allows identification of unknown matter.Citation43) However, studies on diffractograms of food powders typically use comparative scans to examine variation between investigated samples and their reference counterpart(s). Investigation on simple mixture of curcumin and β-CD showed that its diffractogram was the sum of both components. Preparation of the curcumin- β-CD complex with co-precipitation method induced generation of new solid crystalline phases. This was evident by disappearance of some of the curcumin XRD peaks along with occurrence of new and weak spectra in XRD pattern of the co-precipitated curcumin- β-CD complex.Citation50)
IV.II. Scanning electron microscope (SEM) analyses
Visualization of microstructure of food powders can be undertaken by variety of microscopic techniques such as light microscopy, transmission electron microscopy, scanning electron microscopy, and confocal laser scanning microscopy. Among the imaging techniques, conventional SEM is a convenient and useful approach that has been employed in microstructural analysis of various dried food samples.Citation51) SEM offers a high resolution with wide range of magnification (20 –100,000×) and great depth of field. Typically specimen needs to be coated with conductive material about 5–20 nm in thickness to withstand the extensive charge build-up under a fine beam of electrons. When the specimen is scanned under the focused electron beam, the primary electrons interact with the specimen by which various signals are produced, mainly secondary electrons. The signals were then collected and transformed into an image step by step.Citation52, 53) Due to the fact that SEM is operated in vacuum working condition, hydrated samples cannot be analyzed using SEM as vapor would be released. Fixation of sample prior to SEM observation, i.e. freezing, dehydration, and freeze-drying, is necessary to prevent sublimation of hydrated samples.Citation54, 55)
Extensive studies on food powders have employed conventional SEM in obtainment of complementary data on morphology such as size and shape of powdered particles and relation between the observed structures as well as structural phenomena based on geometric characteristics of surface. For examples, under SEM the crystalline α-CD particles showed several shapes with different sizes and many small particles and clefts on their surface, but amorphous spray-dried α-CD particles have spherical in shape, with a smoother surface, and dents and small vacuoles in the interior of the particlesCitation16) (Fig. (b)). SEM has become a powerful tool to elucidate the influences of formulations, processing conditions, and storage regimes on suprastructure and organization of dairy powders. Milk powders appear to have smooth surfaces with surface dents.Citation56, 57) The same surface characteristics were reported in high fat content milk powders along with more brilliant surfaces.Citation58, 59) Occurrence of lactose crystallization in processed milk powders can also be detected using SEM analysis, showing heavy texture on surface of the specimen as compared to untextured surface of the fresh milk powder.Citation60) This indicates the latter is of amorphous state while crystalline state is apparent on the surface of the former. With prior chemical fixation SEM has also been used to reveal the dispersion mechanism of high protein milk powder by investigating rehydrated structures of milk protein powders and their changes during storage. Significant changes in rehydration properties of the milk powder were evident in microscopic images.Citation55) There was an alteration of smooth surface of the high protein milk powder in the dried state to an aggregated particulate structure, which exhibited groups of spherical nanoparticles into small clusters, upon short-term hydration.Citation55) Since diameter of the nanoparticles was about 4–200 nm, the observed surface microstructure of the rehydrated milk powder is likely to be assembled by casein micelles (200 nm). Further examination of the microstructure of the rehydrated milk powder after long-term hydration and extended storage using SEM showed that a porous, gel-like structure of casein micelles is formed by various types of interactions between casein micelles whereby individual micelles are confined to be dispersed into surrounding aqueous phase.Citation55)
In contrast with other imaging techniques, the major drawback of conventional SEM is that many sample preparation steps, particularly applied for hydrated and insulating specimens, may induce artifacts and alteration of native structure of the specimen.Citation55, 61, 62) Preferably microscopic techniques would enable capabilities of characterizing microstructure of both dried and hydrated food powders in their native state across a wider range of magnifications, temperatures and pressures. Recent advances in food microstructure imaging techniques such as atomic force microscopy, variable-pressure SEM, and X-ray computed tomography are powerful addition to greater performance of imaging techniques in microstructural analysis of food powders.
IV.III. Thermal analyses
The most popular thermal technique to study the structure and phase transition, and to quantify the amorphous (crystalline) content in food powders could be differential scanning calorimetry (DSC). Several types of DSC have been reported including conventional DSC, modulated temperature DSC (MTDSC), and hyperDSC.Citation2) In conventional DSC, two configurations known as heat flux and power compensated types have been designed. In the first (heat flux) one, the differences in the amount of output temperature between sample and reference are measured when they are supplied with the same amount of heat. In power compensated DSC, differences in input energy which is required to maintain the same temperature of sample and reference are measured.Citation63, 64) Under DSC scanning, any changes in physical properties of food powders in which energies (enthalpies) are absorbed (endothermic peaks) or released (exothermic peaks) as a function of time and temperature are determined. These changes could be glass transition, structural relaxation, evaporation, crystallization, protein denaturation, gelatinization and retrogradation of starch, melting or oxidation depending on the structure and compositions of powders, and thermal scanning conditions. The energies associated with these changes (e.g. glass transition, crystallization, or melting) are calculated from the area under the peaks on the DSC curve.Citation64) In DSC, the measurement chamber is always purged with an inert gas to remove any oxygen from the atmosphere so that the oxidation of specimen during high temperature scanning is avoided. Generally, the common purge gas is helium, nitrogen or argon. Due to difference in their physical properties (molar mass or thermal conductivity), type of purge gas has a considerable effect on the results of DSC (resolution of transitions, temperature or sensitivity coefficient). It was reported that difference in temperature measured by DSC employed helium and argon as a purge gas was 2.5–3.5 °C while nitrogen was in the intermediate range.Citation65) Moreover, an alteration of the flow rate of purge gas affects temperature, enthalpy calibration and the shape of DSC peaks, and influences of variable purge rates are by far less critical for nitrogen than for helium.Citation66) Therefore, it is very important to perform the calibration DSC with the same type of purge gas and flow rate as in the subsequent experiments.
The typical curves of conventional DSC for amorphous and crystalline food powders scanned with open and closed pans are illustrated in Fig. . Under conventional DSC scanning with open pans, differences on the evaporation behavior of water/volatile components between amorphous and crystalline powders can be easily observed. Amorphous powders with porous and open structure permits water/volatile molecules to diffuse out easily, thus their DSC scans show only a big endothermic hump over a wide range of temperature. In contrast, the DSC scan of crystalline powders exhibits one or several sharp endothermic peaks due to their highly packed structure which restrict water/volatile molecules from escaping. By comparing DSC curves performed with open pans of unknown-structural powders to those of completely amorphous and/or crystalline powders at the same scanning conditions, the structure of unknown powders can quickly be determined based on the changes of DSC peaks (broadening, shifting and disappearing of particular peaks or presence of new peaks). It was reported that under DSC scan with open pans, the thermogram of amorphous α-CD powder produced by spray drying showed a big endothermic hump ranging from 40 to 170 °C, representing for water evaporation or enthalpy relaxation of amorphous α-CD. However, the DSC curves of crystalline α-CD powder was witnessed by four endothermic peaks over various temperature ranges of 48–90, 96–110, 110–160, and 220–226 °C, demonstrating for evaporation of water located at different places (on the surface, in the interstices and in the cavities) in the powders.Citation67) Similar results were also found for amorphous α-CD powder prepared by ball milling,Citation68) spray-dried amorphous β-CD powder and amorphous complex of tea tree oil and β-CD powderCitation39) and amorphous complex of CO2 gas with α-CD powder.Citation13) In these studies, the DSC curve of amorphous powders was gradually shifted to that of crystalline ones during crystallization process, by which the presence of crystalline phases caused an appearance of sharp peaks as compared to the amorphous hump. These results were highly comparable to those determined by X-ray diffraction analysis.
Fig. 4. Typical curves of conventional DSC for amorphous and crystalline powders scanned with open and closed pans.
Unlike DSC scan with the open pans which only allows for qualitative evaluation of the structure of powders, DSC scan with closed pans helps to determine the important properties of powders (glass transition temperature Tg, crystallization temperature Tc and melting temperature Tm) and to quantify the amounts of amorphous (crystalline) phase in powders. Under closed pan condition (without moisture loss), amorphous powders shows a glass transition endotherm peak which is a result of the phase transition from glassy to rubbery state, followed by a crystallization exothermic peak. The crystallized state of amorphous proportion, together with pre-existing crystalline content in the powders (as well as crystalline powders) experience a melting endothermic peak.Citation69) The fundamentals and affecting factors of phase and state transitions of food products have been well described in a book reported by Roos and Drusch.Citation70) By using DSC scan with closed pans, Tg, Tc, and Tm of many types of food powders at different conditions (heating rate, moisture content, humidity, storage temperature or powder components) have been determined, such as infant formula powders,Citation71) skim milk powders,Citation72) various anhydrous sugars and carbohydrate polymers,Citation73–75) lactose powders,Citation76) orange juice powders,Citation77) tomato pulp,Citation78) fruit powders,Citation79) cellulose powdersCitation80), and many others.
From the enthalpies associated with phase transitions measured by DSC, the percentage of crystallinity or amorphous amounts existing in the powder can be quantified. Several analytical methods have been reported and they can be performed with and without calibration curve.Citation9, 69) The calibration curve is prepared via the measurement of the heats of crystallization or enthalpies of fusion of 100% amorphous and crystalline standards, and their physical mixture. Then, crystallinity degree of an unknown sample is determined by its heat of crystallization or enthalpy change of fusion as following equation (Equation (1)) in which Xc is the percentage of crystallinity (%), ΔH is the enthalpy change of fusion of the sample (J/g), and ΔHo is enthalpy change of fusion of the 100% crystalline standard (J/g).Citation81, 82)
(1)
On the other hand, the amounts of amorphous (crystalline) in powder can be measured without the requirement of calibration curve by following equations (Equation (2)) and (Equation (3)). In these equations, ΔHf amor is enthalpy change of fusion of amorphous fraction in the unknown sample, ΔHf cryst is the enthalpy change of fusion at the melting point for the 100% crystalline sample, ΔHf is the enthalpy change of fusion of the sample, ΔHc is the enthalpy change of crystallization of the sample, and m is the sample mass.Citation83–85) These methods were applied to quantify the degree of amorphicity/crystallinity of different forms of lactose powders.Citation15, 86, 87)
(2)
(3)
The conventional DSC cannot be used to detect the presence of a small amount of amorphous (less than 10%) in highly crystalline solids.Citation81) Importantly, the complex nature of food powders and the presence of water in food powders which evaporates during DSC measurement make the interpretation of the DSC curves very difficult, even impossible, especially for cases in which the weak, broad, and overlapping transitions (e.g. degradation at relatively low temperatures and slow crystallization) are observed.Citation88)
Recently, several novel DSC approaches have been explored to improve the sensitivity, accuracy, and detection limit. They include modulated temperature DSC (MTDSC) and hyperDSC. Unlike conventional DSC which utilizes the linear heating rate program and does not allow to separate the signals into individual components, MTDSC employs a small sinusoidal temperature modulation to superimpose over the conventional linear ramp, by which any overlapping thermal events can be separately analyzed through splitting the total heat flow signal into a reversing (related to heat capacity) and a non-reversing component.Citation89) Thus, many overlapped, weak, broad, and slow thermal events of food systems (such as in maltotriose, maltohexaose, and pregelatinized waxy corn starch) which are not explained by conventional DSC can be easily interpreted by MTDSC.Citation88) For example, an endothermic signal at about 40 °C was observed on the conventional DSC curve of maltotriose powders and it was impossible to conclude whether this thermal event is a melting or a glass transition with an overlapped enthalpy relaxation. However, the MTDSC scan allowed to separate this thermal event and figured out the overlapping of glass transition at 43 °C with heat capacity of 0.58 J/(g °C) and enthalpy relaxation of maltotriose.Citation88) Therefore, MTDSC has been increasingly used to investigate various thermal phase transitions of many food powders such as sucrose,Citation90) complexes of β-lactoglobulin-vitamin D3-(lactose),Citation91) lactose, sucrose, and ascorbic acid.Citation92, 93) Moreover, MTDSC has been used to determine degree of crystallinity of lactose powder produced by spray drying at different inlet air temperatureCitation49) and that of acid whey powders produced by spray drying of a mixture of different amounts of lactic acid and lactose.Citation48) The results of the determination of degree of crystallinity by MTDSC were highly consistent to those measured by water vapor sorption and XRD.
Another advanced thermal analytical approach which can be used to study thermal events of food powders containing a very low level of amorphous phase is the hyperDSC. In hyperDSC, a very high scan rate (50–500 °C/min) of heating and cooling is used. The fast scan rates lead to a significant increase in heat flow signals, and thus a remarkable increase in sensitivity. It was reported that the hyperDSC with a heating rate 300 °C/min can quantify Tg of corn starch with different ratios of amylose and amylopectin, which was almost impossible for conventional DSC because the changes of heat capacity (heat flow signals) are too weak to be identified at low heating rates,Citation94, 95) or even measure amorphous phase in starch granules.Citation96) Moreover, the high sensitivity of hyperDSC allows identifying and measuring extremely low-energy transitions, by which it can detect and quantify an extremely low amorphous content. It was reported that the limit of detection and the limit of quantification values of hyperDSC for amorphous sucrose powders were 0.062 and 0.207%, respectivelyCitation97) and those for amorphous maltitol powders were 0.107–0.313% and 0.358–1.04%, respectively.Citation98) In addition, the hyperDSC can quantify amorphous lactose down to 1.5%.Citation99, 100) Beside extremely high sensitivity, this approach has other several advantages over other DSCs in terms of short scanning time and less amounts of samples used.Citation101)
IV.IV. Adsorption analyses
IV.IV.I. Gravimetric vapor sorption
An investigation on water adsorption of food powders allows to distinguish between amorphous and crystalline powders, to determine Tg and critical RH/MC values of amorphous powders and to quantify a very low amount of amorphous in food powders.Citation10) These properties are determined by the differences in water adsorption mechanism and amounts of adsorbed water between amorphous and crystalline powders. Typically, amorphous powders can adsorb water on the surface and in the bulk structure, thus have a higher water adsorption capacity as compared to crystalline ones which interact with water vapor only on the surface.Citation11)
Traditionally, water adsorption behavior of powders is commonly investigated by subjecting the powders to different RH environment controlled by saturated salt solutions until the weight of samples is unchanged, where the moisture equilibrium between the sample and surrounding air is established. This technique is known as static gravimetric vapor adsorption and thus requires a prolonged period of time for the samples to reach the equilibrium state (normally 3–4 weeks). A typical water adsorption isotherm of this approach is shown in Fig. . This result allows to predict changes in MC of powder with an alteration of water activity and to quantify an equilibrium moisture level of sample stored in an environment of known RH and temperature. It has been known that crystallization of amorphous powders leads to an exclusion of adsorbed water and subsequently depression of water adsorption capacity, from which critical RH/MC level of amorphous powders can be determined (Fig. ). For amorphous powders, determination of the critical RH/MC level provides essential information for preventing or initiating the crystallization process for a particular application. By using the static technique alone or in combination with others (X-ray or DSC), the critical RH/MC values of the majority of amorphous food powders have been found.Citation67, 84, 102–104) This approach is easy to perform and quite cost-effective, but it has several disadvantages such as a time-consuming process, an inherent inaccuracy due to interval removal of sample to weigh, large samples sizes, and high labor-intensive process.Citation105)
Fig. 5. Typical water adsorption isotherm of amorphous and crystalline powders determined by the gravimetric vapor sorption; (*) aw = RH/100 as the stored powders achieve a moisture equilibrium with surrounding environment.
Recently, a highly sensitive, accurate and fast means for determining the moisture sorption properties of solid materials has been introduced. This is called as dynamic vapor sorption (DVS). The DVS equipment consists of a very highly sensitive microbalance which allows to detect the mass changes lower than 1 part in 10 million and is connected to the sample and reference chambers (hemispherical quartz crucibles or metal-coated pans) at both ends, temperature/humidity probes to control RH and temperature at sample and reference chambers, and mass flow controllers. All these parts are enclosed in a temperature-controlled incubator, by which stability of instrument baseline and the generation of RH can be accurately regulated. The humidity surrounding the samples is generated by mixing saturated and dry carrier gas streams at an appropriate proportion using mass flow controllers.Citation106) This instrument measures changes of sample mass due to alteration of humidity surrounding the sample, and thus allows to study vapor sorption or desorption capacity of the samples being subjected to variable humidity by which an increase or a decrease of sample mass is recorded, respectively.Citation105) As compared to traditional static water adsorption, the DVS has many advantages as shown in Table .
Table 2. A comparison on static and dynamic water adsorption techniques.
In the DVS, the vapor sorption isotherms are obtained by measuring the mass changes of sample, which is exposed to a series of step changes in RH, as a function of time. At each step change of RH, samples must be allowed to achieve the gravimetric equilibrium state prior to processing to the next RH level. The amounts of amorphous phase present in powders can be quantified from vapor sorption isotherms by several approaches known as equilibrium moisture uptake, water uptake, and residual weight methods. They have been extensively discussed and compared in a review by Sheokand et al. Citation106). All analyze require the calibration curve of known amorphous contents and are established on the fact that amorphous form adsorbs more water than crystalline one. It has been reported that the DVS possibly can quantify very low amorphous content in highly crystalline powders; as low as 0.7%,Citation107) 0.1%Citation108) and even 0.05%Citation109) of amorphous amounts in lactose powders; or 0.2% amorphous content in pharmaceutical solids.Citation110) However, DSV has a potential of misleading the determination of a very low amorphous content because direct comparison of partially amorphous particles to pure amorphous system might be result in a significantly different outcome (molecular mobility) as compared to wholly crystalline system.Citation111) Also the sensitivity of the measurement should be below the error limit of the method. Therefore, a special care for selection of calibrant and a combination with other techniques (e.g. near infrared spectroscopy or isothermal microcalorimetry) could help to confirm the reliability of results.
Moreover, the DVS is also used to investigate the phase transitions (collapse and/or recrystallization) induced by water adsorption of amorphous powders over a wide range of RH and temperature.Citation4, 112–115)
IV.IV.II. Inverse gas chromatography
Inverse gas chromatography (IGC) has been widely used in pharmaceutical research to study changes in behavior of powders during production of drugs via measurement of their surface properties using gas or vapor adsorption.Citation116) The presence of very small amounts of amorphous phase causes a large change in the behavior of the materials. This method is based on the fact that amorphous powders have a higher surface energy than crystalline forms.Citation117) Although almost no research on structural characterization of food powders using IGC has been done possibly because of its cost-effectiveness as compared to other techniques for the same purpose, it has a high potential to apply for distinguishing amorphous and crystalline food powders, and for determination of Tg of amorphous ones.
A typical IGC consists of an oven to control temperature and RH, a column in which powders are packed, solute reservoir, inert gas carrier source, mass flow controller to regulate the flow rate of the mixture of gas carrier and solute passing through the column, a detector to measure the retention time of solutes, and a computer acting as the processor and controller. In order to analyze the powders which are packed inside the column, a very low concentration of known gas or vapor of volatiles (termed as probe molecules) is injected through the column by an inert carrier gas (helium, argon or nitrogen). The nature of interactions between powders and probe gas molecules affects the speed of probe to pass through the column. From retention time of the probe measured by an appropriate detector, many properties of powders related to molecular mobility including surface energy and Tg can be determined.Citation118) These properties have a major influence on stickiness, floatability and stability of food powders.
In a study by Planinšek and Buckton,Citation119) it was reported that amorphous materials showed markedly higher retention time of probes than (micro-) crystalline ones. This is because of high surface energy of amorphous powder resulting in the higher degree of interaction to the probes. A similar result was also found for lactose powders in which surface energy of spray-dried (100% amorphous) and ball-milled (1% amorphous) lactose powders were 37.1 and 41.6 mJ m−2, respectively, being significantly higher than that of pure crystalline form (31.2 mJ m−2). However, surface energy of a physical mixture of 1% amorphous and 99% crystalline lactose particles was 31.5 mJ m−2, which is quite similar to that of crystalline. A comparison of surface energy of these lactose powders indicated that the surface energy is not correlated with amount of amorphous content, but it reflects differences in the orientations and spacing between the surface molecules. The highest surface energy of ball-milled lactose powder (1% amorphous) could be because its surface is highly amorphous while amorphous parts in the physical mixture are thoroughly distributed in the bulk of powders.Citation117) These studies have been demonstrated that IGC could not be used for quantification of amorphous amounts in the powders. However, IGC can identify the presence a very small amounts of amorphous phase on the powder surface which is not detected by other techniques such as DSC or XRDCitation7) and determine the changes of surface energy of powders as a function of RH and temperature.Citation120, 121) Moreover, based on deviation between retention volumes of the probes calculated from the maximum height and the centre of the retention mass, Tg at the particle surfaceCitation122) and a series of transitions (initial mobility, Tg, collapse and crystallization) that occur in amorphous powders kept at high RH levelCitation123) can be determined by using IGC.
IV.V. Spectroscopic analyses
Typically, spectroscopic techniques include nuclear magnetic resonance (NMR) and infrared (IR) approaches (Fourier transform infrared spectroscopy, Raman spectroscopy and terahertz pulsed spectroscopy). The data obtained from these techniques normally is a spectrum which is a plot of the response of interest as a function of wavelength (frequency) for IR approaches and chemical shift for NMR technique, from which the material properties can be characterized. NMR analysis provides information about molecular structure (e.g. bond angles, internuclear distances or orientation of nuclei) of a variety of solid systems through exploiting effects of an external magnetic field on the magnetic properties of a certain atomic nuclei such as 13C or 1H. Under NMR, different functional groups or even identical functional groups with different neighboring substituents produce obviously distinguishable spectra.Citation124) The IR methods probe the individual atomic bonds within a molecule and vibrational modes produced by oscillations of these atomic bonds using an infrared radiation source to provide information about the material characteristics.Citation125) The IR radiation energy absorbed by the samples is converted to vibrational or rotational energy, and functional groups in the samples vibrate in different ways such as stretching (symmetric or asymmetric) or bending (scissoring, rocking, wagging or twisting) depending on their nature. Therefore, similar to NMR spectrum, an IR spectrum is unique for each substance.
Different spectroscopic techniques employ IR radiation with different frequency and thus sensibility of these techniques to the molecular vibrations is dissimilar. As shown in Fig. , the electromagnetic radiation is appropriate for the low energy transitions involved in the NMR method is radio waves (f ≈ 105–109 Hz) which have the lowest energy among radiations in the electromagnetic spectra. At a higher frequency (f ≈ 109–1011 Hz), the microwave radiation provide information about molecular rotations while the far-IR region (known as a terahertz region with f ≈ 1011–1013 Hz) is about vibrations of low-energy bonds, hydrogen-bonding or crystalline phonon. The mid-IR region (f = 1013 – 1.3 × 10¹⁴ Hz) induces the intramolecular vibrations which can be utilized to investigate the molecular structure. Above frequency of 1.3 × 10¹⁴ Hz which is called as near-IR region (NIR spectroscopy), spectral features are mainly due to combination and overtone bands.Citation125)
Fig. 6. The electromagnetic radiation region applied in various spectroscopic techniques (Adapted from TadayCitation125).
IV.V.I. Solid state nuclear magnetic resonance (ssNMR)
The ssNMR is a non-destructive analytical technique which is used to probe the nature and characteristics of molecular structure for a wide range of applications (e.g. structural interpretation, molecular characterization, determination of chemical compositions or investigation on reaction kinetics) in numerous fields (material sciences, organic, and inorganic chemistry, food industries, pharmaceutical production, crystal engineering, and polymer industries) due to highly predominance of solid materials in these areas. For this regards, many outstanding review papers or books have been reported for the last few years.Citation124, 126–132) In these reports, the fundamental principles, characteristics and applications of ssNMR spectroscopy have been well described, and therefore these have purposely been avoided here.
Due to the presence of a stable carbon isotope of 13C in almost all biological materials such as food powders and its ability to behave as a little magnet (the other isotopes of carbon, such as 12C does not possess this property), 13C ssNMR spectroscopy becomes a powerful technique to investigate the structure of food products via interpretation of the position and number of chemical shifts on the NMR spectra. The origin of chemical shifts is the results of the resonance of 13C nuclei relative to the standard under the influences of an external magnetic field. The resonance frequency of 13C nuclei is highly dependent on the surrounding electron environment and the atoms attached to them.Citation124, 131) 13C ssNMR is very sensitive to slightly conformational alterations of molecules which are greatly affected by their arrangement in the solid materials.Citation2) Therefore, 13C ssNMR can be used to investigate on the crystallographic structure and symmetry of solid materials. In this part, attempts are made to describe the applicability of 13C ssNMR spectroscopy to distinguish amorphous and crystalline food powders and to quantify the amorphous phase in highly crystalline powders. In order to increase the sensitivity of 13C ssNMR and enhance the resolution of the NMR spectra, it is typically equipped with the proton decoupling and magic angle spinning (MAS) and cross-polarization (CP), which is termed as 13C CP/MAS-ssNMR (hereafter 13C NMR is used).
Generally, the 13C nuclei of solid materials with different crystallographic structure and symmetry exhibit different chemical shifts on the NMR spectra. Crystalline powders yield a much better NMR spectral resolution than amorphous counterparts. This is because of the extremely sensitivity of ssNMR to the crystallographic structure and molecular symmetry of materials in which 13C chemical shifts of crystalline powders are easily reproducible to about 0.1 ppm while those of amorphous powders are only reliable to the nearest ∼1 ppm. For each 13C atom, the NMR spectra of amorphous ones show broad peaks while those of crystalline powders display sharp, splitting or even overlapped peaks.Citation131) Such differences on the number and position of the peaks on the NMR spectra of purely amorphous and crystalline forms of the same material have been reported for many food powders such as starches,Citation129, 133–135) lactose,Citation136) alpha-cyclodextrin,Citation67) cellulose,Citation137) dietary fiber powdersCitation138) or trehalose.Citation139) An example of 13C NMR spectra of amorphous and crystalline α-CD powders were shown in Fig. (a).Citation16) The 13C NMR spectral features of mixed structural powders can be encountered by a combination of the spectral features observed from model crystalline and amorphous materials. This information allows predicting the structure of a particular type of powder.
Fig. 7. Differences between amorphous and crystalline powder under various analytical techniques: (a) 13C NMR of amorphous and crystalline α-CD powders (adapted from Ho et al. Citation16)); (b) Raman spectroscopy of amorphous and crystalline lactose powders (adapted from Murphy et al. Citation146); (c) FTIR spectra of amorphous and crystalline sucrose (adapted from Mathlouthi and CholliCitation160); and (d) Absorption coefficient (0.5–4 THz) of amorphous and crystalline glucose (Adapted from Walther et al. Citation168)).
The quantitative estimation of amorphous (crystalline) fraction in the food powders using the 13C NMR spectra can be performed either by (1) spectral integration of the intensity of particular peaks, (2) spectral subtraction or (3) spin-lattice relaxation time (T1) determination. The first analytical approach has been reported for determination of crystalline index of microcrystalline cellulose. The crystalline index is calculated by dividing the intensity of the crystalline C4 peak to the sum of the crystalline and amorphous C4 peak intensities. In one of the examples on the 13C NMR spectra of cellulose, the crystalline peak was at 86–93 ppm and the amorphous peak was at 80–86 ppm.Citation140) Moreover, this approach has successfully been applied for the estimation of amorphous content in lactose powders basing on a typical 13C NMR peak of amorphous phase at the chemical shift of 93–96 ppm. This peak was only observed on the 13C NMR spectra of lactose powder containing amorphous phase and increased its intensity with an increase of amorphous amounts in the lactose powder. The amorphous percentage estimated by 13C NMR was very high comparable to that determined by microcalorimetry, and both methods can detect as low as 0.5% amorphous lactose in a mixture.Citation136)
In the spectral subtraction approach, the amount of crystalline in a certain solid material is calculated by deducting digitally the 13C NMR spectrum of the material to that of 100% amorphous solid, followed by determination of a ratio of the area contributed by crystalline to the total area of the subtracted 13C NMR spectrum. This method is quite simple and can determine any level of crystallinity in cellulose. As compared to the spectral integration approach, this method gives a higher crystallinity index of cellulose due to differences in the measurement principle between two approaches.Citation137) However, these types of analysis are limited when two spectra are overlapped and cannot be deconvoluted or too small to be subtracted.Citation135) In these cases, the quantification of amorphous content via the measurement of T1 of 13C, which expresses differences of molecular mobility in amorphous and crystalline regions is applicable. It was reported that this approach allowed to determine amorphous fraction in powder mixtures of ball-milled trehalose and the results were quite similar to those quantified by DSC method.Citation139)
IV.V.II. Fourier transform infrared spectroscopy (FTIR) and Raman spectroscopy (RS)
Both FTIR and Raman approaches are non-destructive and vibrational methods which are complementary to each other to provide information about the vibrational modes of atoms in molecules which are highly dependent on molecular conformation, molecular environment, molecular packing conditions and interactions between molecules. Therefore, the vibrational spectrum of a molecule is a unique physical property and characteristic of the molecule. Although FTIR is different to Raman in principle operation and characteristics (as shown in Table Citation141)), both of them have a similar function. They can be used to identify functional groups in organic compounds or unknown samples by either a comparison of the spectra of unknown and reference samples or an elucidation of the unknown spectrum basing on the positions and intensity of spectral peaks if reference spectrum is unavailable. The ways to interpret the spectra obtained from FTIR and Raman analyses for many inorganic and organic compounds have been well described in many books.Citation142–144)
Table 3. Differences between Fourier transform infrared and Raman spectroscopyCitation141).
IV.V.II.I. Raman spectroscopy (RS).
Ability of Raman spectroscopy to probe molecular and crystal lattice vibrations makes it an remarkable method to identify possible powder anomers formed during production.Citation17, 145) It was reported that the Raman spectra of different lactose anomeric and crystalline forms were defined and marked difference. On the Raman spectra, crystalline lactose expressed many sharp and splitting peaks while amorphous lactose showed broad peaks with a very low intensityCitation146) (Fig. (b)). Moreover, it was found that α-lactose powder was different to β-lactose about spectral characteristics of peaks at wavelengths of around 1100 and 350 cm−1. At a wavelength of about 1100 cm−1, a doublet peak for β-lactose but a single peak for α-lactose were found, while at a wavelength of around 350 cm−1, a sharp peak for α-lactose, and a broaden peak for β-lactose was observed.Citation147, 148) Similar results were also described for two different crystalline forms (A- and B-forms) of an active pharmaceutical compound in which Raman spectra showed only a sharp peak at 1716 cm−1 (A-form) and 1724 cm−1 (B-form), and the intensities of these peaks were proportional to the relative amounts of A- and B-form in the mixtures.Citation149) For the similar purpose, Raman spectroscopy was also reported to be an effective approach to detect mineral fortification or adulteration of calcite in whole and skim milk powders. Calcite is a crystalline mineral and is used to increase the calcium content in milk powders. The spectrum of calcite has two sharp peaks at wavelength of 285 and 1087 cm−1, and these peaks were clearly observed on the spectra of milk powders containing calcite whereas there were no such peaks witnessed on the Raman spectrum of milk powders.Citation150)
For the quantitative analysis of amorphous (crystalline) amounts in solid materials, Taylor and ZografiCitation151) reported that Raman spectroscopy can detect down to 1% amorphous indomethacin content in the mixtures by using a correlation curve over a range from 0 to 100% crystallinity. The correlation curve was constructed from the mixture of different proportion of amorphous and crystalline materials, and a peak intensity ratio of 1698 cm−1 (crystalline) to 1680 cm−1 (amorphous). For food powders, the complexities of powder components and limitations of Raman spectroscopy (fluorescence interference from the sample, absorbance of the reaction mixture or effects of orientation of the sample) might lead to inaccurately quantitative analysis. However, a combination of Raman spectroscopy with other techniques (NIR, FTIR or chemometric methods such as partial least square regression) is a promising approach to improve the precision and sensitivity of analysis.Citation152) It was reported that degree of crystallinity of lactose in permeate powder can be quantified by using partial least squares regression on Raman spectrum data.Citation153) The use of deuterium substitution of exchangeable protons to enhance the detection level of Raman spectroscopy to the amorphous lactose phase also allowed to detect and quantify about 1.7 and 5.1%, respectively, amorphous content in the lactose mixture.Citation154) In addition, different degree of amorphicity of spray-dried lactose measured by Raman spectroscopy was found to have a very high agreement with that determined by other techniques (XRD, StepScan DSC, isothermal microcalorimetry, solution calorimetry or gravimetric moisture sorption).Citation155)
IV.V.II.II. Fourier transform infrared spectroscopy (FTIR)
The FTIR technique employs mid-infrared radiation in the spectral region of 4000–400 cm−1 to induce vibrational transitions of molecules. Under infrared radiation, amorphous and crystalline phases of the same material show significant differences on the FTIR spectra in terms of number of peaks and peak intensity due to their differences in molecular structure and conformation. Thus, FTIR has been intensively applied in various fields especially in pharmaceutical research to characterize solid compounds as well as to quantify amorphous (crystalline) content in these systems through the measurement of the intensity of a peak, characteristic of the crystalline state with reference to a peak that is independent of the crystal state of the substance.Citation2) For this regard, many excellent reviews have been published, typically describing the use of FTIR for characterization techniques for pharmaceutical compounds.Citation156–159)
In food production, FTIR approach has primarily been utilized to distinguish between amorphous and crystalline food powders, and several studies have been reported. Mathlouthi et al. Citation160) have stated that the number of sharp peaks observed on the FTIR spectra of sucrose powder was directly related to crystallinity of powder (Fig. (c)). The FTIR spectrum of 100% crystalline sucrose powder exhibited many sharp peaks while only a few such peaks were observed on the FTIR spectrum of partial crystalline freeze-dried one and only broad peaks were witnessed on that of 100% amorphous quenched-melt sucrose powder. A similar finding was also reported for calcium carbonate powdersCitation161) in which the FTIR spectra, especially vibrational frequencies of carbonate ion, of amorphous state was very dissimilar to those of crystalline one. Ho et al. Citation67) have characterized spray-dried amorphous and crystalline α-CD powders using FTIR and have found that the number of peaks on the FTIR spectrum of crystalline α-CD powder was quite similar to those of spray-dried amorphous counterpart. Both phases were characterized by a broad band at 3000–3600 cm−1 (symmetric and antisymmetric O–H stretching mode), a strong and complex band at 900–1180 cm−1 (stretching of C–O bonds), a band at 1156 cm−1 (antisymmetric stretching of the C–O–C glycosidic bridge), and bands at 1025 and 1078 cm−1 (coupled stretching of C–O and C–C). The differences between amorphous and crystalline α-CD powders were the intensity of these bands in which those of amorphous α-CD powder have much higher intensity than those of crystalline α-CD one. Listiohadi et al. Citation162) have shown that the FTIR spectrum of amorphous lactose powder was distinguished from that of crystalline lactose in terms of number of peaks and less defined peaks of the amorphous lactose spectrum. The sharp peaks at 1260, 900 and 875 cm−1 on the FTIR spectrum could allow to differentiate the amorphous and crystalline lactose powders. Ciolacu et al. Citation163) has demonstrated that changes in the structure of cellulose powders from crystalline to amorphous phase resulted in an reduction of peak intensity or even disappearance of peaks characteristic of the crystalline phase on the FTIR spectra. Moreover, FTIR has also been found to be extremely useful to study the state and phase transitions of food powders as well as changes in starch structure on a molecular level (short-range order) such as starch chain conformation, helicity, crystallinity, and retrogradation processes. In a study by Ottenhof et al., Citation164) it was reported that the FTIR technique was very sensitive to phase transformations of freeze-dried amorphous sucrose and lactose powders subjected to over a range of temperature and moisture content. As the powders experienced phase changes from glassy to rubbery states, there were a small shift in wave number and changes in peak intensity while crystallization and melting of the powders resulted in a noticeable increase in spectral resolution and a spectral broadening, respectively. van et al. Citation165) developed the FTIR-based method for quantitative determination of potato starch short-range structure through measuring the intensify of absorption bands at 1047 cm−1 (which is sensitive to the amount of ordered or crystalline starch) and 1022 cm−1 (which is characteristic of amorphous starch). The changes in intensity of these bands (1047 and 1022 cm−1) was found to have first-order relationship with the amount of crystalline potato starch.
IV.V.III. Terahertz pulsed spectroscopy (TPS)
As described above, on the electromagnetic spectrum, terahertz radiation falls between the IR and microwave regions with a frequency of 0.1–3.0 THz. The advantages of this technique as compared to other vibrational approaches include possibility to perform the measurement at high temperature due to its insensibility to thermal interference, low energy densities of THz beam which does not induce any sample degradation, a rapid-scan mode which allows to investigate dynamic systems, and a non-destructive technique.Citation166) It can probe many low-energy vibrations including lattice vibrations, hydrogen bonding vibrations, torsion vibrations and rotation of gas molecules. Detection of these vibrational modes provides essential information to characterize solid-state materials.Citation166) These vibrational modes are changed because of an alteration of molecular arrangement or packing in solid matrices, thus the TPS of different structural forms of the same solid material will be significantly different.Citation167)
In a study by Walther et al. Citation168) in which dielectric properties at 10 and 300 K of glucose, fructose and sucrose sugar powders in both structural forms of amorphous and polycrystalline were investigated using TPS (0.5–4.0 THz). The results showed that for all sugars and temperature levels investigated, the adsorption profiles (absorption coefficient and index of refraction) of polycrystalline powders showed the sharp spectral features while those of amorphous powders displayed monotonously increasing absorption at high frequencies without exhibiting any sharp peaks (Fig. (d)). It was explained that the sharp spectral peaks of polycrystalline sugar powders associated to intermolecular vibrational modes of long-range order were primarily affected by noncovalent bonds between the molecules whereas the adsorption profiles of amorphous powders were the results of dielectric relaxation. Similar results were also reported for many crystalline and amorphous pharmaceutical compounds in which the TPS sharp peaks are only observed on the spectra of crystalline ones.Citation166) Moreover, due to very high sensitive to intermolecular interactions of terahertz radiation, TPS allows to differentiate two crystalline forms of solid materials, even when the crystalline structures of polymorphs are very similar.Citation169) The differences on the TPS spectra of many solid materials including food powders which exist in different structure forms or with different amounts of amorphous fraction were well summarized and presented in a review paper compiled by Shen.Citation170)
Although the terahertz spectra of amorphous materials do not display any distinct spectral features, a close analysis on subtle changes on the spectra attained at different temperatures permits to investigate on Tg and crystallization behavior of amorphous solids.Citation171) Moreover, quantitative analysis of the presence of residual crystallinity in amorphous solid materials can be performed from the peaks on the terahertz spectra of crystalline solids. It was found that the results estimated by DSC and TPS for residual crystallinity degree of lactose powders during ball milling was highly comparable.Citation172) Limit of detection of TPS for crystallinity was reported to be as low as around 1%.Citation167) However, it has several shortcomings which can prevent it from being widely used. They are the very expensive instrument and devitrification of amorphous powders which can be triggered during sample preparation.Citation168)
IV.VI. Other techniques
Other approaches which have been occasionally used in pharmacy to quantify amount of amorphous phase in drugs are based on true density and dissolution analyses.Citation10, 81, 173–175) These techniques have a relatively low precision and reliability for studying the low level of disorder in solid materials. The reasons might be because of high dependence of these properties (density and dissolution) on other factors of solid materials such as particle size, surface area, degree of powder compaction or moisture content, rather than molecular alignment order. This makes them difficult to be accurately measured. For those methods, further investigation on the experimental setup to facilitate quick and accurate quantification of disorder percentage of solid materials is required.
True density of powders is a ratio of the mass of particles and their volume excluding any open and closed pores (e.g. true volume). True volume can be determined by gas or liquid (in which the powder is not soluble) displacement pycnometry.Citation176) Generally, crystalline powders have a higher true density than amorphous ones due to short distance and high order of molecular arrangement in the lattices of crystalline powders resulting in a smaller true volume compared to that of amorphous powders.Citation177) An increase of disorder in crystal lattice leads to an increase of true volume, subsequently a decrease of true density. Therefore, determination of true density can provide an insight of the order state of powders provided that true densities of completely amorphous and crystalline standards are known. Percentage of disorder (amorphous) of a certain powder can be calculated from its true density (ρ) and true density of pure amorphous and crystalline samples (denoted as ρa and ρc, respectively) by using equation (Equation (4)) and a calibration curve which is established from completely crystalline and amorphous samples and their known physical mixtures. This technique has been successfully applied to estimate the amorphous amounts in milled sucrose powder as amorphous proportion in the powder is more than 10%.Citation81) However, due to small differences in true density of pure amorphous and crystalline samples, the large standard deviations associated with such measurements are observed.(4)
For dissolution test, degree of amorphous phase in a particular sample is estimated from differences in dissolution ability of amorphous and crystalline samples. Amorphous powders have a higher molecular mobility and consequently have a higher free energy and dissolution rate as compared to the equivalent crystalline counterparts. Similar to true density approach, the dissolution test also requires a standard curve and a similar measurement is then made on the sample to assign the corresponding percentage of disorder. This approach has been reported to quantify degree of crystallinity in solid dispersions.Citation175) However, an inherent risk of devitrification in the dissolution fluid might lead to failure application of dissolution test for structural characterization of the solid materials.Citation178)
V. Conclusions
The order of molecular arrangement determines the structure of food powders (amorphous, crystalline, or mixed structure), and their properties and functionalities in food application. In this review, the different structural forms of food powders and emerging applications of amorphous ones in food production were described. Unlike crystalline powders which exist in thermodynamically equilibrium state, the powders containing partially or completely amorphous phases are usually unstable and tend to experience many undesirable phase transitions during storage and production. However, because of unique properties such as open and porous structure, high surface energy or high ability to interact with external molecules, amorphous powders have received a lot of attention for food applications. To determine the degree of amorphous/crystalline structure in food powders many solid-state characterization techniques are employed. They include X-ray diffraction analysis, microscopic techniques (SEM), thermal approaches (conventional DSC, MTDSC, or hyperDSC), vapor adsorption methods (gravimetric vapour sorption or IGC), spectroscopic techniques (13C ssNMR, FTIR or Raman spectroscopy), true density measurement or dissolution test. These approaches also allow screening the food powders with different structure, determining critical physical properties (Tg, crystallization temperature or critical MC) of amorphous powders. Each characterizing technique is different in the operating principle and differently sensitive to different properties of powders, thus a combination of various complementary techniques will be an effective tool to investigate on the structure of food powders. The main characteristics of various analytical techniques for qualitative and quantitative investigation on the structure of food powders are shown in Table .
Table 4. A comparison of various analytical techniques for qualitative and quantitative investigation on the structure of food powders (Adapted from Shah et al. Citation9) and Sheokand et al. Citation106).
Author contributions
All authors, T.M.H., T.T., and B.R.B. confirmed that they have contributed into the development of the content of manuscript, drafting the manuscript, revision of the manuscript and final approval of manuscript.
Disclosure statement
No potential conflict of interest was reported by the authors.
Acknowledgment
The authors acknowledge for the use of facilities in School of Agriculture and Food Sciences (SAFS) at The University of Queensland. Thao M. Ho also acknowledges financial support from Australia Awards Scholarships.
References
- Bhandari BR. Introduction to food powders. In: Bhandari BR, Bansal N, Zhang M, Schuck P, Editors. Handbook of food powders: processes and properties. Cambridge: Woodhead Publishing Limited; 2013. p. 1–15.
- Einfalt T, Planinsek O, Hrovat K. Methods of amorphization and investigation of the amorphous state. Acta Pharma. 2013;63(3):305–334.
- Beckett ST. Industrial chocolate manufacture and use. 2nd ed. New Delhi: Wiley; 1994.10.1007/978-1-4615-2111-2
- Buckton G, Darcy P. Assessment of disorder in crystalline powders – a review of analytical techniques and their application. Int J Pharm. 1999;179(2):141–158.10.1016/S0378-5173(98)00335-4
- Johari GP, Ram S, Astl G, et al. Characterizing amorphous and microcrystalline solids by calorimetry. J Non-Cryst Solids. 1990;116(2–3):282–285.10.1016/0022-3093(90)90703-O
- Li J, Guo Y, Zografi G. The solid‐state stability of amorphous quinapril in the presence of β‐cyclodextrins. J Pharm Sci. 2002;91(1):229–243.10.1002/jps.10014
- Burnett DJ, Khoo J, Naderi M, Heng JYY, Wang GD, Thielmann F. Effect of processing route on the surface properties of amorphous indomethacin measured by inverse gas chromatography. AAPS Pharm Sci Tech. 2012;13(4):1511–1517.10.1208/s12249-012-9881-5
- Yu L. Amorphous pharmaceutical solids: preparation, characterization and stabilization. Adv Drug Delivery Rev. 2001;48(1):27–42.10.1016/S0169-409X(01)00098-9
- Shah B, Kakumanu VK, Bansal AK. Analytical techniques for quantification of amorphous/crystalline phases in pharmaceutical solids. J Pharm Sci. 2006;95(8):1641–1665.10.1002/jps.20644
- Hancock BC, Zografi G. Characteristics and significance of the amorphous state in pharmaceutical systems. J Pharm Sci. 1997;86(1):1–12.10.1021/js9601896
- Zografi G. States of water associated with solids. Drug Dev Ind Pharm. 1988;14(14):1905–1926.10.3109/03639048809151997
- Ho BT. Production of ethylene powder by encapsulation of ethylene gas into α-cyclodextrin and its application for the ripening of fruit. PhD Thesis, School of Agriculture and Food Sciences, The University of Queensland, Brisbane. 2013.
- Ho TM, Howes T, Bhandari BR. Encapsulation of CO2 into amorphous and crystalline α-cyclodextrin powders and the characterization of the complexes formed. Food Chem. 2015;187:407–415.10.1016/j.foodchem.2015.04.094
- Bhandari BR, Howes T. Implication of glass transition for the drying and stability of dried foods. J Food Eng. 1999;40(1–2):71–79.10.1016/S0260-8774(99)00039-4
- Roos Y, Karel MA. Crystallization of amorphous lactose. J Food Sci. 1992;57(3):775–777.10.1111/jfds.1992.57.issue-3
- Ho TM, Howes T, Bhandari BR. Characterization of crystalline and spray-dried amorphous α-cyclodextrin powders. Powder Technol. 2015;284:585–594.10.1016/j.powtec.2015.06.027
- Islam MIU, Langrish TAG. An investigation into lactose crystallization under high temperature conditions during spray drying. Food Res Int. 2010;43(1):46–56.10.1016/j.foodres.2009.08.010
- Craig DQ, Royall PG, Kett VL, Hopton ML. The relevance of the amorphous state to pharmaceutical dosage forms: glassy drugs and freeze dried systems. Int J Pharm. 1999;179(2):179–207.10.1016/S0378-5173(98)00338-X
- Bhandari B, Roos YH. Food materials science and engineering: an overview. In: Bhandari B, Roos YH, Editors. Food materials science and engineering. Oxford: Wiley-Blackwell; 2012. p. 1–23.10.1002/9781118373903
- Chen JC, Chou C-C. Cane sugar handbook: a manual for cane sugar manufacturers and their chemists. 12th ed. New York (NY): Wiley; 1993.
- Asadi M. Beet-sugar handbook. Hoboken (NJ): Wiley; 2006.10.1002/0471790990
- Hanselmann W. Chocolate products containing amorphous solids and methods of producing same. US Patent: US8617635 B2. 2013.
- Merget R, Bauer T, Küpper H, et al. Health hazards due to the inhalation of amorphous silica. Arch Toxicol. 2002;75(11–12):625–634.10.1007/s002040100266
- Yang YX, Song ZM, Cheng B, et al. Evaluation of the toxicity of food additive silica nanoparticles on gastrointestinal cells. J Appl Toxicol. 2014;34(4):424–435.10.1002/jat.2962
- Villota R, Hawkes JG, Cochrane H. Food applications and the toxicological and nutritional implications of amorphous silicon dioxide. Crit Rev Food Sci Nutr. 1986;23(4):289–321.10.1080/10408398609527428
- McLaughlin JK, Chow WH, Levy LS. Amorphous silica: a review of health effects from inhalation exposure with particular reference to cancer. J Toxicol Environ Health. 1997;50(6):553–566.10.1080/15287399709532054
- Dekkers S, Krystek P, Peters RJB, et al. Presence and risks of nanosilica in food products. Nanotoxicology. 2011;5(3):393–405.10.3109/17435390.2010.519836
- Gharsallaoui A, Roudaut G, Chambin O, et al. Applications of spray-drying in microencapsulation of food ingredients: an overview. Food Res Int. 2007;40(9):1107–1121.10.1016/j.foodres.2007.07.004
- Buera P, Schebor C, Elizalde B. Effects of carbohydrate crystallization on stability of dehydrated foods and ingredient formulations. J Food Eng. 2005;67(1-2):157–165.10.1016/j.jfoodeng.2004.05.052
- Shimada Y, Roos YH, Karel M. Oxidation of methyl linoleate encapsulated in amorphous lactose-based food model. J Agric Food Chem. 1991;39(4):637–641.10.1021/jf00004a001
- Drusch S, Serfert Y, Van Den Heuvel A, et al. Physicochemical characterization and oxidative stability of fish oil encapsulated in an amorphous matrix containing trehalose. Food Res Int. 2006;39(7):807–815.10.1016/j.foodres.2006.03.003
- Ferreira CD, da Conceicao EJL, Machado BAS, et al. Physicochemical characterization and oxidative stability of microencapsulated crude palm oil by spray drying. Food Bioprocess Technol. 2016;9(1):124–136.10.1007/s11947-015-1603-z
- Fäldt P, Bergenståhl B. Fat encapsulation in spray-dried food powders. J Am Oil Chem Soc. 1995;72(2):171–176.10.1007/BF02638895
- Carolina BC, Carolina S, Zamora MC, et al. Glass transition temperatures and some physical and sensory changes in stored spray-dried encapsulated flavors. Food Sci Technol. 2007;40(10):1792–1797.
- Ho TM, Howes T, Bhandari BR. Encapsulation of CO2 into amorphous alpha-cyclodextrin powder at different moisture contents – Part 1: encapsulation capacity and stability of inclusion complexes. Food Chem. 2016;203:348–355.10.1016/j.foodchem.2016.02.076
- Del Valle EMM. Cyclodextrins and their uses: a review. Process Biochem. 2004;39(9):1033–1046.10.1016/S0032-9592(03)00258-9
- Hedges AR, Shieh WJ, Sikorski CT. Use of cyclodextrins for encapsulation in the use and treatment of food products. In: Risch SJ, Reineccius GA, editors. Encapsulation and controlled release of food ingredients. Vol. 590, ACS Symposium Series. Washington, DC: American Chemical Society; 1995. p. 60–71.
- Ho TM, Howes T, Bhandari BR. Encapsulation of gases in powder solid matrices and their applications: a review. Powder Technol. 2014;259:87–108.10.1016/j.powtec.2014.03.054
- Shrestha M, Ho TM, Bhandari BR. Encapsulation of tea tree oil by amorphous beta-cyclodextrin powder. Food Chem. 2016;221:1474–1483.
- Ho TM, Howes T, Jack KS, Bhandari BR. Encapsulation of CO2 into amorphous alpha-cyclodextrin powder at different moisture contents - Part 2: Characterization of complexed powders and determination of crystalline structure. Food Chem. 2016;206:92–101.10.1016/j.foodchem.2016.03.044
- Caira MR. On the isostructurality of cyclodextrin inclusion complexes and its practical utility. Revue Roumaine de Chimie. 2001;46(4):371–386.
- Das R, Ali ME, Abd SB. Hamid, current applications of X-ray powder diffraction – a review. Rev Adv Mater Sci. 2014;38(2):95–109.
- Pecharsky VK, Zavalij PY. Fundamentals of powder diffraction and structural characterization of materials. 2nd ed. New York (NY): Springer Science+Business Media LLC.; 2009.
- Chidavaenzi OC, Buckton G, Koosha F. The effect of co-spray drying with polyethylene glycol 4000 on the crystallinity and physical form of lactose. Int J Pharm. 2001;216(1–2):43–49.10.1016/S0378-5173(00)00693-1
- Caparino OA, Tang J, Nindo CI, et al. Effect of drying methods on the physical properties and microstructures of mango (Philippine ‘Carabao’ var.) powder. J Food Eng. 2012;111(1):135–148.10.1016/j.jfoodeng.2012.01.010
- Wang W, Zhou WB. Characterisation of spray dried soy sauce powders made by adding crystalline carbohydrates to drying carrier. Food Chem. 2015;168:417–422.10.1016/j.foodchem.2014.07.065
- Haque K, Roos YH. Crystallization and X-ray diffraction of spray-dried and freeze-dried amorphous lactose. Carbohydr Res. 2005;340(2):293–301.10.1016/j.carres.2004.11.026
- Saffari M, Langrish T. Effect of lactic acid in-process crystallization of lactose/protein powders during spray drying. J Food Eng. 2014;137:88–94.10.1016/j.jfoodeng.2014.04.002
- Chiou D, Langrish TAG, Braham R. The effect of temperature on the crystallinity of lactose powders produced by spray drying. J Food Eng. 2008;86(2):288–293.10.1016/j.jfoodeng.2007.10.005
- Mangolim CS, Moriwaki C, Nogueira AC, et al. Curcumin-beta-cyclodextrin inclusion complex: stability, solubility, characterisation by FT-IR, FT-Raman, X-ray diffraction and photoacoustic spectroscopy, and food application. Food Chem. 2014;153:361–370.10.1016/j.foodchem.2013.12.067
- Bai Y, Rahman MS, Perera CO, et al. Structural changes in apple rings during convection air-drying with controlled temperature and humidity. J Agric Food Chem. 2002;50(11):3179–3185.10.1021/jf011354s
- Falcone PM, Baiano A, Conte A, et al. Imaging techniques for the study of food microstructure: a review. Adv Food Nutr Res. 2006;51:206–263.
- Kaláb M, Allan-Wojtas P, Miller SS. Microscopy and other imaging techniques in food structure-analysis. Trends Food Sci Technol. 1995;6(6):177–186.10.1016/S0924-2244(00)89052-4
- Bache IC, Donald AM. The structure of the gluten network in dough: a study using environmental scanning electron microscopy. J Cereal Sci. 1998;28(2):127–133.10.1006/jcrs.1997.0176
- Mimouni A, Deeth HC, Whittaker AK, et al. Investigation of the microstructure of milk protein concentrate powders during rehydration: alterations during storage. J Dairy Sci. 2010;93(2):463–472.10.3168/jds.2009-2369
- Gaiani C, Ehrhardt JJ, Scher J, et al. Surface composition of dairy powders observed by X-ray photoelectron spectroscopy and effects on their rehydration properties. Colloids Surf B-Biointerfaces. 2006;49(1):71–78.10.1016/j.colsurfb.2006.02.015
- Kim EHJ, Chen XD, Pearce D. Surface characterization of four industrial spray-dried dairy powders in relation to chemical composition, structure and wetting property. Colloids Surf B-Biointerfaces. 2002;26(3):197–212.10.1016/S0927-7765(01)00334-4
- Marabi A, Mayor G, Burbidge A, et al. Assessing dissolution kinetics of powders by a single particle approach. Chem Eng J. 2008;139(1):118–127.10.1016/j.cej.2007.07.081
- Marabi A, Mayor G, Raemy A, et al. Solution calorimetry: a novel perspective into the dissolution process of food powders. Food Res Int. 2007;40(10):1286–1298.10.1016/j.foodres.2007.08.007
- Yazdanpanah N, Langrish TAG. Egg-shell like structure in dried milk powders. Food Res Int. 2011;44(1):39–45.10.1016/j.foodres.2010.11.019
- Hermansson AM, Buchheim W. Characterization of protein gels by scanning and transmission electron microscopy A methodology study of soy protein gels. J Colloid Interface Sci. 1981;81(2):519–530.10.1016/0021-9797(81)90433-1
- Karlsson A, Ipsen R, Ardö Y. Observations of casein micelles in skim milk concentrate by transmission electron microscopy. LWT-Food Sci Technol. 2007;40(6):1102–1107.10.1016/j.lwt.2006.05.012
- Clas SD, Dalton CR, Hancock BC. Differential scanning calorimetry: applications in drug development. Pharm Sci Technol Today. 1999;2(8):311–320.10.1016/S1461-5347(99)00181-9
- Lukas K, LeMaire PK. Differential scanning calorimetry: fundamental overview. Resonance. 2009;14(8):807–817.10.1007/s12045-009-0076-7
- Luisi M, Wilthan B, Pottlacher G. Influence of purge gas and spacers on uncertainty of high-temperature heat flux DSC measurements. J Therm Anal Calorim. 2015;119(3):2329–2334.10.1007/s10973-014-4329-7
- Lever T. Optimizing DSC experiments. In: Craig DQ, Reading M, Editors. Thermal analysis of pharmaceuticals. Florida: CRC press; 2006. p. 23–51.
- Ho TM, Howes T, Bhandari BR. Characterization of crystalline and spray-dried amorphous α-cyclodextrin powders. Powder Technol. 2015;284:585–594.10.1016/j.powtec.2015.06.027
- Kaminski K, Adrjanowicz K, Kaminska E, et al. Impact of water on molecular dynamics of amorphous α-, β-, and γ-cyclodextrins studied by dielectric spectroscopy. Phys Rev E. 2012;86: (3)031506-1–031506-9.
- Gill P, Moghadam TT, Ranjbar B. Differential scanning calorimetry techniques: applications in biology and nanoscience. J Biomol Tech. 2010;21(4):167–193.
- Roos YH, Drusch S. Phase transitions in foods. 2nd ed. Oxford: Academic Press; 2015.
- Chuy LE, Labuza TP. Caking and stickiness of dairy-based food powders as related to glass transition. J Food Sci. 1994;59(1):43–46.10.1111/jfds.1994.59.issue-1
- Jouppila K, Roos Y. Glass transitions and crystallization in milk powders. J Dairy Sci. 1994;77(10):2907–2915.10.3168/jds.S0022-0302(94)77231-3
- Roos Y. Melting and glass transitions of low molecular weight carbohydrates. Carbohydr Res. 1993;238(C):p. 39–48.10.1016/0008-6215(93)87004-C
- Roos Y, Karel M. Water and molecular weight effects on glass transitions in amorphous carbohydrates and carbohydrate solutions. J Food Sci. 1991;56(6):1676–1681.10.1111/jfds.1991.56.issue-6
- Foster KD, Bronlund JE, Paterson AHJ. Glass transition related cohesion of amorphous sugar powders. J Food Eng. 2006;77(4):997–1006.10.1016/j.jfoodeng.2005.08.028
- Lloyd RJ, Dong Chen X, Hargreaves JB. Glass transition and caking of spray-dried lactose. Int J Food Sci Technol. 1996;31(4):305–311.10.1046/j.1365-2621.1996.00352.x
- Shrestha AK, Ua-arak T, Adhikari BP, et al. Glass transition behavior of spray dried orange juice powder measured by differential scanning calorimetry (DSC) and thermal mechanical compression test (TMCT). Int J Food Prop. 2007;10(3):661–673.10.1080/10942910601109218
- Goula AM, Karapantsios TD, Achilias DS, et al. Water sorption isotherms and glass transition temperature of spray dried tomato pulp. J Food Eng. 2008;85(1):73–83.10.1016/j.jfoodeng.2007.07.015
- Jaya S, Das H. Glass transition and sticky point temperatures and stability/mobility diagram of fruit powders. Food Bioprocess Technol. 2009;2(1):89–95.10.1007/s11947-007-0047-5
- Szcześniak L, Rachocki A, Tritt-Goc J. Glass transition temperature and thermal decomposition of cellulose powder. Cellulose. 2008;15(3):445–451.10.1007/s10570-007-9192-2
- Saleki-Gerhardt A, Ahlneck C, Zografi G. Assessment of disorder in crystalline solids. Int J Pharm. 1994;101(3):237–247.10.1016/0378-5173(94)90219-4
- Vitez IM. Utilization of DSC for pharmaceutical crystal form quantitation. J Therm Anal Calorim. 2004;78(1):33–45.10.1023/B:JTAN.0000042151.60566.0f
- Van den Mooter G, Wuyts M, Blaton N, et al. Physical stabilisation of amorphous ketoconazole in solid dispersions with polyvinylpyrrolidone K25. Eur J Pharm Sci. 2001;12(3):261–269.10.1016/S0928-0987(00)00173-1
- Bronlund J, Paterson T. Moisture sorption isotherms for crystalline, amorphous and predominantly crystalline lactose powders. Int Dairy J. 2004;14(3):247–254.10.1016/S0958-6946(03)00176-6
- Phillips EM. An approach to estimate the amorphous content of pharmaceutical powders using calorimetry with no calibration standards. Int J Pharm. 1997;149(2):267–271.10.1016/S0378-5173(96)04812-0
- Gombás Á, Szabó-Révész P, Kata M, et al. Quantitative determination of crystallinity of α-lactose monohydrate by DSC. J Therm Anal Calorim. 2002;68(2):503–510.10.1023/A:1016039819247
- Fix I, Steffens KJ. Quantifying low amorphous or crystalline amounts of alpha‐lactose‐monohydrate using x‐ray powder diffraction, near‐infrared spectroscopy, and differential scanning calorimetry. Drug Dev Ind Pharm. 2004;30(5):513–523.10.1081/DDC-120037482
- De Meuter P, Rahier H, Van Mele B. The use of modulated temperature differential scanning calorimetry for the characterisation of food systems. Int J Pharm. 1999;192(1):77–84.10.1016/S0378-5173(99)00274-4
- Coleman NJ, Craig DQM. Modulated temperature differential scanning calorimetry: A novel approach to pharmaceutical thermal analysis. Int J Pharm. 1996;135(1–2):13–29.10.1016/0378-5173(95)04463-9
- Magoń A, Wurm A, Schick C, et al. Heat capacity and transition behavior of sucrose by standard, fast scanning and temperature-modulated calorimetry. Thermochim Acta. 2014;589:183–196.
- Górska A, Ostrowska-Ligęza E, Szulc K, et al. A differential scanning calorimetric study of β-lactoglobulin and vitamin D3 complexes. J Therm Anal Calorim. 2012;110(1):473–477.10.1007/s10973-012-2322-6
- Islam M, Sherrell R, Langrish T. An investigation of the relationship between glass transition temperatures and the crystallinity of spray-dried powders. Drying Technol. 2010;28(3):361–368.10.1080/07373931003641586
- Imtiaz-Ul-Islam M, Langrish TAG. Comparing the crystallization of sucrose and lactose in spray dryers. Food Bioprod Process. 2009;87(2):87–95.10.1016/j.fbp.2008.09.003
- Liu P, Yu L, Liu H, Chen L, Li L. Glass transition temperature of starch studied by a high-speed DSC. Carbohydr Polym. 2009;77(2):250–253.10.1016/j.carbpol.2008.12.027
- Liu P, Yu L, Wang X, et al. Glass transition temperature of starches with different amylose/amylopectin ratios. J Cereal Sci. 2010;51(3):388–391.10.1016/j.jcs.2010.02.007
- Du X, MacNaughtan B, Mitchell JR. Quantification of amorphous content in starch granules. Food Chem. 2011;127(1):188–191.10.1016/j.foodchem.2011.01.022
- Lappalainen M, Pitkänen I, Harjunen P. Quantification of low levels of amorphous content in sucrose by hyperDSC. Int J Pharm. 2006;307(2):150–155.10.1016/j.ijpharm.2005.09.029
- Hurtta M, Pitkänen I. Quantification of low levels of amorphous content in maltitol. Thermochim Acta. 2004;419(1–2):19–29.10.1016/j.tca.2004.01.024
- Gabbott P, Clarke P, Mann T, et al. A high-sensitivity, high-speed DSC technique: measurement of amorphous lactose. Am Lab. 2003;35(16):17–23.
- Saunders M, Podluii K, Shergill S, et al. The potential of high speed DSC (Hyper-DSC) for the detection and quantification of small amounts of amorphous content in predominantly crystalline samples. Int J Pharm. 2004;274(1–2):35–40.10.1016/j.ijpharm.2004.01.018
- Saklatvala R, Saunders M, Fitzpatrick S, et al. A comparison of high speed differential scanning calorimetry (Hyper-DSC) and modulated differential scanning calorimetry to detect the glass transition of polyvinylpyrrolidone: the effect of water content and detection sensitivity in powder mixtures (a model formulation). J Drug Del Sci Technol. 2005;15(4):257–260.10.1016/S1773-2247(05)50046-7
- Teunou E, Fitzpatrick J. Effect of relative humidity and temperature on food powder flowability. J Food Eng. 1999;42(2):109–116.10.1016/S0260-8774(99)00087-4
- Jouppila K, Kansikas J, Roos YH. Crystallization and X-ray diffraction of crystals formed in water-plasticized amorphous lactose. Biotechnol Prog. 1998;14(2):347–350.10.1021/bp980010s
- Roos YH. Importance of glass transition and water activity to spray drying and stability of dairy powders. Le Lait. 2002;82(4):475–484.10.1051/lait:2002025
- Levoguer CL, Williams DR. The characterisation of pharmaceutical materials by dynamic vapour sorption. Dyn Vapour Sorption. Application Note. 1999;101:1–5.
- Sheokand S, Modi SR, Bansal AK. Dynamic vapor sorption as a tool for characterization and quantification of amorphous content in predominantly crystalline materials. J Pharm Sci. 2014;103(11):3364–3376.10.1002/jps.24160
- Hogan SE, Buckton G. The application of near infrared spectroscopy and dynamic vapor sorption to quantify low amorphous contents of crystalline lactose. Pharm Res. 2001;18(1):112–116.10.1023/A:1011091113734
- Vollenbroek J, Hebbink GA, Ziffels S, et al. Determination of low levels of amorphous content in inhalation grade lactose by moisture sorption isotherms. Int J Pharm. 2010;395(1–2):62–70.10.1016/j.ijpharm.2010.04.035
- Buckton G, Darcy P. The use of gravimetric studies to assess the degree of crystallinity of predominantly crystalline powders. Int J Pharm. 1995;123(2):265–271.10.1016/0378-5173(95)00083-U
- Mackin L, Zanon R, Park JM, et al. Quantification of low levels (<10%) of amorphous content in micronised active batches using dynamic vapour sorption and isothermal microcalorimetry. Int J Pharm. 2002;231(2):227–236.10.1016/S0378-5173(01)00881-X
- Craig DQC, Kett, VL, Murphy, J. R., et al. The measurement of small quantities of amorphous material-should we be considering the rigid amorphous fraction? Pharm Res. 2001;18(8):1081–1082.10.1023/A:1010999615450
- Burnett DJ, Thielmann F, Booth J. Determining the critical relative humidity for moisture-induced phase transitions. Int J Pharm. 2004;287(1–2):123–133.10.1016/j.ijpharm.2004.09.009
- Buckton G, Darcy P. Water mobility in amorphous lactose below and close to the glass transition temperature. Int J Pharm. 1996;136(1–2):141–146.10.1016/0378-5173(96)04503-6
- Hunter NE, Frampton CS, Craig DQ, et al. The use of dynamic vapour sorption methods for the characterisation of water uptake in amorphous trehalose. Carbohydr Res. 2010;345(13):1938–1944.10.1016/j.carres.2010.06.011
- Yu X, Kappes S, Bello-Perez LA, Schmidt S. Investigating the moisture sorption behavior of amorphous sucrose using a dynamic humidity generating instrument. J Food Sci. 2008;73(1):E25–E35.
- Grimsey IM, Feeley JC, York P. Analysis of the surface energy of pharmaceutical powders by inverse gas chromatography. J Pharm Sci. 2002;91(2):571–583.10.1002/jps.10060
- Newell HE, Buckton G, Butler DA, et al. The use of inverse phase gas chromatography to measure the surface energy of crystalline, amorphous, and recently milled lactose. Pharm Res. 2001;18(5):662–666.10.1023/A:1011089511959
- Mohammadi-Jam S, Waters KE. Inverse gas chromatography applications: a review. Adv Colloid Interface Sci. 2014;212:21–44.10.1016/j.cis.2014.07.002
- Planinšek O, Buckton G. Inverse gas chromatography: considerations about appropriate use for amorphous and crystalline powders. J Pharm Sci. 2003;92(6):1286–1294.10.1002/jps.10394
- Newell HE, Buckton G, Butler DA, et al. The use of inverse phase gas chromatography to study the change of surface energy of amorphous lactose as a function of relative humidity and the processes of collapse and crystallisation. J Pharm Sci. 2001;217(1–2):45–56.10.1016/S0378-5173(01)00589-0
- Das S, Larson I, Young P, et al. Understanding lactose behaviour during storage by monitoring surface energy change using inverse gas chromatography. Dairy Sci Technol. 2010;90(2–3):271–285.10.1051/dst/2009051
- Buckton G, Ambarkhane A, Pincott K. The use of inverse phase gas chromatography to study the glass transition temperature of a powder surface. Pharm Res. 2004;21(9):1554–1557.10.1023/B:PHAM.0000041447.15874.f7
- Ambarkhane AV, Pincott K, Buckton G. The use of inverse gas chromatography and gravimetric vapour sorption to study transitions in amorphous lactose. Int J Pharm. 2005;294(1–2):129–135.10.1016/j.ijpharm.2005.01.034
- Laws DD, Bitter H-ML, Jerschow A. Solid-state NMR spectroscopic methods in chemistry. Angew Chem Int Ed. 2002;41(17):3096–3129.10.1002/1521-3773(20020902)41:17<>1.0.CO;2-C
- Taday PF. Applications of terahertz spectroscopy to pharmaceutical sciences. Phil Trans R Soc London A. 1815;2004(362):351–364.
- Saitão H, Ando I, Naito A. Solid state NMR spectroscopy for biopolymers: principles and applications. Dordrecht: Springer; 2006.
- Dybowski C, Bai S, Bramer SV. Solid-state nuclear magnetic resonance. Anal Chem. 2002;74(12):2713–2718.10.1021/ac0201981
- Tishmack PA, Bugay DE, Byrn SR. Solid-state nuclear magnetic resonance spectroscopy-pharmaceutical applications. J Pharm Sci. 2003;92(3):441–474.10.1002/jps.10307
- Bertocchi F, Paci M. Applications of high-resolution solid-state NMR spectroscopy in food science. J Agric Food Chem. 2008;56(20):9317–9327.10.1021/jf8019776
- Geppi M, Mollica G, Borsacchi S, et al. Solid-state NMR studies of pharmaceutical systems. Appl Spectro Rev. 2008;43(3):202–302.10.1080/05704920801944338
- Xu Y, Southern SA, Szell PM, et al. The role of solid-state nuclear magnetic resonance in crystal engineering. Cryst Eng Comm. 2016;18:5236–5252.
- Berendt RT, Sperger DM, Munson EJ, et al. Solid-state NMR spectroscopy in pharmaceutical research and analysis. TrAC Trends Anal Chem. 2006;25(10):977–984.10.1016/j.trac.2006.07.006
- Gidley MJ, Bociek SM. Molecular organization in starches: a carbon 13CP/MAS NMR study. J Am Chem Soc. 1985;107(24):7040–7044.10.1021/ja00310a047
- Atichokudomchai N, Varavinit S, Chinachoti P. A study of ordered structure in acid-modified tapioca starch by 13C CP/MAS solid-state NMR. Carbohydr Polym. 2004;58(4):383–389.10.1016/j.carbpol.2004.07.017
- Paris M, Bizot H, Emery J, et al. Crystallinity and structuring role of water in native and recrystallized starches by 13C CP-MAS NMR spectroscopy. Carbohydr Polym. 1999;39(4):327–339.10.1016/S0144-8617(99)00022-3
- Gustafsson C, Lennholm H, Iversen T, et al. Comparison of solid-state NMR and isothermal microcalorimetry in the assessment of the amorphous component of lactose. Int J Pharm. 1998;174(1–2):243–252.10.1016/S0378-5173(98)00272-5
- Park S, Johnson DK, Ishizawa CI, et al. Measuring the crystallinity index of cellulose by solid state 13C nuclear magnetic resonance. Cellulose. 2009;16(4):641–647.10.1007/s10570-009-9321-1
- Wawer I, Wolniak M, Paradowska K. Solid state NMR study of dietary fiber powders from aronia, bilberry, black currant and apple. Solid State Nucl Magn Reson. 2006;30(2):106–113.10.1016/j.ssnmr.2006.05.001
- Lefort R, De Gusseme A, Willart J-F, et al. Solid state NMR and DSC methods for quantifying the amorphous content in solid dosage forms: an application to ball-milling of trehalose. Int J Pharm. 2004;280(1–2):209–219.10.1016/j.ijpharm.2004.05.012
- Ek R, Alderborn G, Nyström C. Particle analysis of microcrystalline cellulose: Differentiation between individual particles and their agglomerates. Int J Pharm. 1994;111(1):43–50.10.1016/0378-5173(94)90400-6
- Larkin P. Infrared and Raman spectroscopy; principles and spectral interpretation. Oxford: Elsevier; 2011.
- Schrader B. Infrared and Raman spectroscopy: methods and applications. Weinheim:Wiley; 2008.
- Gremlich H-U, Yan B. Infrared and Raman spectroscopy of biological materials. New York (NY): Marcel Dekker Inc.; 2000.
- Coates J. Interpretation of infrared spectra, a practical approach. In: Meyers RA, Editor. Encyclopedia of analytical chemistry. Chichester: Wiley; 2000. p. 10815–10837.
- Smith GD, Clark RJH. Raman microscopy in archaeological science. J Arch Sci. 2004;31(8):1137–1160.10.1016/j.jas.2004.02.008
- Murphy BM, Prescott SW, Larson I. Measurement of lactose crystallinity using Raman spectroscopy. J Pharm Biomed Anal. 2005;38(1):186–190.10.1016/j.jpba.2004.12.013
- Susi H, Ard JS. Laser-raman spectra of lactose. Carbohydr Res. 1974;37(2):351–354.10.1016/S0008-6215(00)82924-9
- Kirk JH, Dann SE, Blatchford CG. Lactose: a definitive guide to polymorph determination. Int J Pharm. 2007;334(1–2):103–114.10.1016/j.ijpharm.2006.10.026
- Langkilde FW, Sjöblom J, Tekenbergs-Hjelte L, et al. Quantitative FT-Raman analysis of two crystal forms of a pharmaceutical compound. J Pharm Biomed Anal. 1997;15(6):687–696.10.1016/S0731-7085(96)01906-1
- McGoverin CM, Clark ASS, Holroyd SE, et al. Raman spectroscopic quantification of milk powder constituents. Anal Chim Acta. 2010;673(1):26–32.10.1016/j.aca.2010.05.014
- Taylor LS, Zografi G. The quantitative analysis of crystallinity using FT-Raman spectroscopy. Pharm Res. 1998;15(5):755–761.10.1023/A:1011979221685
- Yang DT, Ying YB. Applications of Raman spectroscopy in agricultural products and food analysis: a review. Appl Spectrosc Rev. 2011;46(7):539–560.10.1080/05704928.2011.593216
- Nørgaard L, Hahn M, Knudsen L, et al. Multivariate near-infrared and Raman spectroscopic quantifications of the crystallinity of lactose in whey permeate powder. Int Dairy J. 2005;15(12):1261–1270.10.1016/j.idairyj.2004.12.009
- Whiteside PT, Luk SY, Madden-Smith CE, et al. Detection of low levels of amorphous lactose using H/D exchange and FT-Raman spectroscopy. Pharm Res. 2008;25(11):2650–2656.10.1007/s11095-008-9682-4
- Ehto V-P, Tenho M, Vähä-Heikkilä K, et al, The comparison of seven different methods to quantify the amorphous content of spray dried lactose. Powder Technol, 2006;167(2):85–93.
- Van Eerdenbrugh B, Taylor LS. Application of mid-IR spectroscopy for the characterization of pharmaceutical systems. Int J Pharm. 2011;417(1–2):3–16.10.1016/j.ijpharm.2010.12.011
- Wartewig S, Neubert RHH. Pharmaceutical applications of Mid-IR and Raman spectroscopy. Adv Drug Del Rev. 2005;57(8):1144–1170.10.1016/j.addr.2005.01.022
- Stephenson GA, Forbes RA, Reutzel-Edens SM. Characterization of the solid state: quantitative issues. Adv Drug Del Rev. 2001;48(1):67–90.10.1016/S0169-409X(01)00099-0
- Heinz A, Strachan CJ, Gordon KC, et al. Analysis of solid-state transformations of pharmaceutical compounds using vibrational spectroscopy. J Pharm Pharm. 2009;61(8):971–988.10.1211/jpp.61.08.0001
- Mathlouthi M, Cholli AL, Koenig JL. Spectroscopic study of the structure of sucrose in the amorphous state and in aqueous solution. Carbohydr Res. 1986;147(1):1–9.
- Andersen FA, Brečević L. Infrared spectra of amorphous and crystalline calcium carbonate. Acta Chem Scand. 1991;45(10):1018–1024.10.3891/acta.chem.scand.45-1018
- Listiohadi Y, Hourigan JA, Sleigh RW, et al. Thermal analysis of amorphous lactose and α-lactose monohydrate. Dairy Sci Technol. 2009;89(1):43–67.10.1051/dst:2008027
- Ciolacu D, Ciolacu F, Popa VI. Amorphous cellulose-structure and characterization. Cellul Chem Technol. 2011;45(1):13–21.
- Ottenhof M-A, MacNaughtan W, Farhat IA. FTIR study of state and phase transitions of low moisture sucrose and lactose. Carbohydr Res. 2003;338(21):2195–2202.10.1016/S0008-6215(03)00342-2
- van Soest JJ, Tournois H, de Wit D, et al. Short-range structure in (partially) crystalline potato starch determined with attenuated total reflectance Fourier-transform IR spectroscopy. Carbohydr Res. 1995;279:201–214.10.1016/0008-6215(95)00270-7
- Strachan CJ, Rades T, Newnham DA, et al. Using terahertz pulsed spectroscopy to study crystallinity of pharmaceutical materials. Chem Phys Lett. 2004;390(1–3):20–24.10.1016/j.cplett.2004.03.117
- Strachan CJ, Taday PF, Newnham DA, et al. Using terahertz pulsed spectroscopy to quantify pharmaceutical polymorphism and crystallinity. J Pharm Sci. 2005;94(4):837–846.10.1002/jps.20281
- Walther M, Fischer BM, Jepsen PU. Noncovalent intermolecular forces in polycrystalline and amorphous saccharides in the far infrared. Chem Phys. 2003;288(2–3):261–268.10.1016/S0301-0104(03)00031-4
- Taday PF, Bradley I, Arnone D, et al. Using terahertz pulse spectroscopy to study the crystalline structure of a drug: a case study of the polymorphs of ranitidine hydrochloride. J Pharm Sci. 2003;92(4):831–838.10.1002/jps.10358
- Shen YC. Terahertz pulsed spectroscopy and imaging for pharmaceutical applications: a review. Int J Pharm. 2011;417(1–2):48–60.10.1016/j.ijpharm.2011.01.012
- Zeitler JA, Taday PF, Pepper M, et al. Relaxation and crystallization of amorphous carbamazepine studied by terahertz pulsed spectroscopy. J Pharm Sci. 2007;96(10):2703–2709.10.1002/jps.20908
- Smith G, Hussain A, Bukhari NI, et al. Quantification of residual crystallinity of ball-milled, commercially available, anhydrous β-lactose by differential scanning calorimetry and terahertz spectroscopy. J Therm Anal Calorim. 2015;121(1):327–333.10.1007/s10973-015-4469-4
- Duncan-Hewitt WC, Grant DJW. True density and thermal expansivity of pharmaceutical solids - comparison of methods and assessment of crystallinity. Int J Pharm. 1986;28(1):75–84.10.1016/0378-5173(86)90149-3
- Nara S. On the relationship between specific volume and crystallinity of starch. Starch-Stärke. 1979;31(3):73–75.10.1002/(ISSN)1521-379X
- Hasegawa S, Hamaura T, Furuyama N, et al. Uniformity and physical states of troglitazone in solid dispersions determined by electron probe microanalysis and microthermal analysis. Int J Pharm. 2004;280(1–2):39–46.10.1016/j.ijpharm.2004.04.024
- Barbosa-Cánovas GV, Juliano P. Physical and chemical properties of food powders. In: Onwulata C, Editor. Encapsulated and powdered foods. Boca Raton (FL): Dekker/CRC Press; 2005. p. 39–71.10.1201/CRCFOOSCITEC
- Yang W, Owens DE, Williams RO. Pharmaceutical cryogenic technologies. In: Williams III RO, Watts AB, Miller DA, Editors. Formulating poorly water soluble drugs. New York (NY): Springer: 2012. p. 443–500.10.1007/978-1-4614-1144-4
- Savolainen M, Kogermann K, heinz A, et al. Better understanding of dissolution behaviour of amorphous drugs by in situ solid-state analysis using Raman spectroscopy. Eur J Pharm Biopharm. 2009;71(1):71–79.10.1016/j.ejpb.2008.06.001