
 ?Mathematical formulae have been encoded as MathML and are displayed in this HTML version using MathJax in order to improve their display. Uncheck the box to turn MathJax off. This feature requires Javascript. Click on a formula to zoom.
ABSTRACT
Users of the microbond test assume that a microbond resin droplet’s properties are equivalent to a macroscale specimen. However, there is currently no standardised methodology for determining the cure state of droplet specimens used in the microbond test. In this paper, we present a technique for microbond test users to better understand the properties of thermoset droplet specimens. Utilising a conventional benchtop spectrometer, a novel sample preparation technique involving curing epoxy droplets on thin-steel filaments allowed for high-throughput determination of the microbond droplet cure state. The parity between steel filament and glass fibre microbond samples was confirmed by infrared microspectroscopy. It is shown that cure schedules used in manufacturing composite parts produced microbond droplets with degrees of cure lower than that of bulk matrix specimens subjected to an identical thermal history. Testable microbond droplets could only be prepared for commercial resin systems when introducing a room temperature pre-curing time of at least 2 h. It is concluded that microbond testing should be supported by some droplet cure state characterisation methods to ensure that interfacial effects are not artefacts of droplet sample preparation.

1. Introduction
The stress-transfer capability of the fibre/matrix interface region is critical to composite material mechanical properties. Accordingly, it is essential to characterise the interface and associated level of adhesion through a robust methodology. Apparent interfacial shear strength (IFSS) is a mechanically measurable value used to define the strength of the interface. IFSS can be assessed through several micromechanical methods, such as the pull-out, fragmentation, or microbond tests [Citation1,Citation2]. The microbond test has been widely used in the current literature to characterise the adhesion between many fibre and polymer systems. However, few authors have commented on an apparent disparity in thermoset resin system curing behaviour and matrix material properties at the microscale. Microscale curing issues have been reported in the literature before the publication of the microbond testing method [Citation3]. Furthermore, they are recognised as an area requiring further investigation in the earliest critical reviews of microbond [Citation4] and micromechanical [Citation1] testing methods. However, there has been little significant effort in the interface literature to directly address the droplet curing phenomenon despite the growing usage of the microbond test. Micromechanical single-fibre testing remains one of the only available methods of directly assessing the mechanical performance of the composite interface region. However, microbond droplet properties may not reflect those of a macroscale composite sample. Accordingly, microbond test practitioners should carefully consider thermoset droplet curing behaviour. Droplet degree of cure, among other scaling effects, may affect measured values of apparent IFSS more significantly than the effect under investigation (such as the influence of size formulation or surface modification) [Citation5].
Poor curing of epoxy/meta-phenylene diamine (m-PDA) droplets has previously been attributed to a stoichiometric imbalance caused by evaporation of the curing agent during elevated temperature curing [Citation1,Citation4,Citation6–8] or adsorption of m-PDA onto the fibre surface [Citation9]. The microdroplet degree of cure was lower than that of fragmentation test specimens subjected to an identical thermal history and was independent of fibre selection (glass, carbon, aramid). Furthermore, the difference between microbond and bulk matrix glass transition temperature (Tg) depended on droplet embedded length. Droplets prepared with less volatile curing agents may achieve closer agreement between macro- and microscale material properties [Citation7]. More recently, Laurikainen et al. have reported a lower degree of cure in epoxy droplets relative to bulk matrix specimens measured using a pyrolysis gas-chromatography technique [Citation10].
Reduced droplet cure behaviour is not limited to the use of epoxy matrices. Incomplete curing of polyester microbond sample and subsequent data scatter were attributed to evaporation of 50–60% of the initial styrene content out of the droplet by Ash et al. [Citation11]. Similar hypotheses relating to the evaporation of styrene from vinyl ester specimens have also been reported [Citation12,Citation13]. Thomason et al. recently reported that using a cyanoacrylate adhesive may interfere with the curing reaction of vinyl ester droplets [Citation14]. Microdroplet curing may also be indirectly inhibited by the absence of a mould, a high microdroplet surface-to-volume ratio, or a phase separation related to a thick interphase [Citation15]. Evaporation of essential polymerisation components has also been observed in acrylic microdroplets by Charlier et al. [Citation16,Citation17].
Others have rejected evaporation hypotheses in epoxy specimens due to distinct phenomena for amine- and anhydride-cured droplets [Citation18] or based on insignificant vapour pressures [Citation12]. Instead, alternative explanations have been suggested, such as imine group formation, fibre surface moisture, anhydride hydrolysis, surface oxidation, phase separation during sample preparation, or interaction with atmospheric moisture. Charlier et al. proposed that, for both epoxy and acrylic droplets, phenomena such as auto-acceleration did not occur as they would in a bulk sample of several grams due to the extremely low amounts of reactive mixture present in the samples [Citation17].
While the current understanding of microdroplet curing behaviour is somewhat incomplete, two of the salient findings in the review of the literature are:
Poor microdroplet curing is independent of fibre selection.
Discrepancies in macro- and microscale curing behaviour and material properties are prevalent across several thermosetting matrices.
Accordingly, the curing behaviour of microbond droplet specimens should be considered by all practitioners of the microbond test. Droplet curing behaviour may be of particular concern in glass fibre/epoxy systems due to the wide range of curing agent chemistries available and the small droplet sizes (typically <200 µm) required to ensure successful debonding [Citation19]. There is no standardised methodology for determining the cure state of droplet specimens used in the microbond test. Droplet cure state evaluation by thermomechanical analysis (TMA) [Citation6,Citation7], thin-film model [Citation7,Citation18], or pyrolysis gas-chromatography [Citation10] has been utilised in previous literature. However, a higher throughput solution with less exacting sample preparation requirements is highly desirable. In this paper, we present further development of a previously reported methodology for microbond test users to better understand the properties of thermoset droplet specimens with relative ease [Citation20]. A novel sample preparation and spectroscopic method to directly characterise the cure state of thermosetting microbond samples is presented, and a relationship between the microdroplet cure state and apparent IFSS is discussed.
2. Materials and methods
2.1. Materials
To minimise the complexity of the interface, the experiments were conducted using bare (water-sized) E-glass fibres from Owens Corning (Ohio, U.S.A.). Glass fibres were of nominal tex 1200 g/km and average fibre diameter 17.5 µm.
Three different epoxy resin systems were used in this study. Two were multiple-component commercial epoxy/amine systems designed for wind turbine blade applications. In contrast, the third experimental system was based on a single resin and tetrafunctional amine curing agent. The commercial epoxy resin systems were Epotec YD-535 LV cured with Epotec TH7257 hardener at a stoichiometric ratio (amine: epoxy group ratio, r = 1) of 35 phr, and Olin Airstone 780E was cured with Olin Airstone 785 H hardener at a stoichiometric ratio of 31 phr. Both resin systems were supplied by Suzlon Energy Limited (Hengelo, Netherlands). The commercial epoxy resins were low-viscosity diglycidyl ether of bisphenol-A (DGEBA) compounds containing a reactive diluent. The commercial curing agents were multi-component diamines comprised isophorone diamine, polyoxypropylenediamine, diethylenetriamine, and a copolymer. The reference resin system was DER 332 DGEBA epoxy resin cured with a stoichiometric (14.3 phr) amount of triethylenetetramine (TETA) tetrafunctional amine curing agent, both sourced from Sigma Aldrich (Dorset, UK). This epoxy resin was used as a comparative control based on an apparent ability to cure consistently at the microscale [Citation21,Citation22].
Resin mixtures were prepared and degassed under vacuum for 10 min to remove entrapped air. Curing cycles comprised two isothermal stages with 2°C/min intermediate heating rates. Commercial resin samples were cured at 65°C for 3.5 h, followed by 75°C for 7 h. The curing cycle was selected to coincide with the schedule used to produce macroscale composite parts. Based on good droplet curing in previous investigations, reference resin samples were cured at 60°C for 1 h and then 120°C for 2 h [Citation21–23]. shows the epoxy resins, standard curing schedules, and cured bulk matrix glass transition temperatures.
Table 1. Summary of epoxy resin systems used in the investigation.
2.2. Microbond testing
IFSS was measured using an in-house designed microbond jig. The experimental setup has been previously described in detail [Citation24]. A schematic diagram of the microbond test is shown in . The basic procedure for the microbond test involves a single fibre being pulled from a restrained droplet of cured matrix while measuring the force required to detach the fibre [Citation2].
Figure 1. Photograph of microbond test set-up and schematic diagram of test specimen.
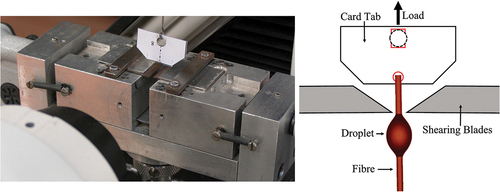
The microbond testing jig was designed around an Instron 3342 universal tensile testing machine equipped with a 10 N load cell and a microvice with adjustable shearing blades. Shearing blade horizontal movement was controlled at a resolution of 1 µm by a pair of adjustable parallel micrometers mounted on either side of the microvice. Micrographs of cured droplets were collected using a Leitz Ergolux optical microscope at 200× magnification. ImageJ software was used to measure fibre diameter (Df) and embedded length (Le). Microbond tests were performed at a crosshead speed of 0.1 mm/min, and Instron Bluehill software was used to record crosshead displacement and applied load. Successful debonding or instances of droplet plastic deformation were confirmed by in-situ observation of droplet loading using 45× magnification stereo microscopy and a live camera feed. The apparent IFSS (τapp) was calculated using EquationEquation (1).(1)
(1)
Where Fmax is the peak of the load–displacement plot generated during droplet debonding, 30 tests were performed for each condition to obtain an average IFSS value and ensure sufficient data for a reasonable statistical basis [Citation25]. Error bars shown in the results are 95% confidence limits of average apparent IFSS values.
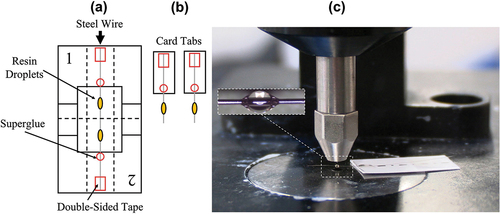
2.3. Microbond sample preparation
Individual glass fibres were isolated and aligned along the vertical axis of a card mounting template for interfacial adhesion measurements. Fibres were mounted using double-sided tape and secured with cyanoacrylate gel superglue before standing for 24 h to react fully. Resins were mixed according to the relevant directions and applied to individual fibres using a thin length of steel wire to produce droplets with embedded lengths in the 100–180 µm range [Citation22]. Specimens were then cured immediately according to the desired macroscale temperature schedule. The cure behaviour of microbond droplets was also investigated as a function of post-curing and pre-cure standing time.
2.4. Bulk matrix sample preparation
For bulk-cured matrix specimens, approximately 20 mg of the appropriately mixed resin was syringed onto a section of composite release film [Citation21]. Samples were cured according to the appropriate temperature schedule and allowed to cool overnight before being removed from the oven and separated from the release film. Glass transition temperatures of cured bulk matrix specimens were determined according to ASTM standard E1356–08 using a TA Instruments Q20 DSC. Tests were performed from −10°C to 180°C under an inert nitrogen atmosphere at 10°C/min with a purge gas flow rate of 50 mL/min. Data were analysed using TA Universal Analysis software, and Tg was estimated from the midpoint of step transitions.
2.5. Fourier-transform infrared spectroscopy
2.5.1. Benchtop FTIR
Fourier-transform infrared spectroscopy (FTIR) was used to characterise the degree of cure of microbond droplet and bulk matrix specimens subjected to identical thermal histories. Glass fibres were replaced by steel wire of diameter 50 µm from Goodfellow for microbond droplet specimen measurements using a benchtop spectrometer. Signal clarity was improved by a consistent and controllable increased droplet embedded length of around 400 µm. Spectroscopy was performed using a 4100 ExoScan FTIR fitted with a spherical diamond attenuated total reflectance (ATR) interface. An adjustable probe ensured good specimen contact with the FTIR interface. Analysis was performed in the 4000 to 650 cm−1 range with a spectral resolution of 8 cm−1 and 64 scans per sample. The FTIR microbond sample preparation methodology and experimental configuration are illustrated in .
Figure 2. Schematic illustration of FTIR microbond sample preparation.
2.5.2. Infrared microspectroscopy
Infrared microspectroscopy was used to assess the cure state of microbond droplet specimens in situ and verify that the degree of cure was comparable between glass fibre/epoxy and steel wire/epoxy specimens. IR microspectroscopy was performed using a Bruker Hyperion 3000 FTIR microscope equipped with a liquid nitrogen-cooled MCT ATR detector in the 4000 to 650 cm−1 range with a spectral resolution of 16 cm−1 and 32 scans per sample. Glass fibre/epoxy microbond droplet specimens were placed on a glass slide and accurately positioned using a viewing objective and motorised stage.
2.5.3. Characterisation of the degree of cure
As a result of the relationship between concentration and absorbance, the extent of epoxy conversion can be determined from FTIR spectra. The Beer-Lambert law relates absorbance (A), absorptivity (a), sample thickness (d), and concentration of absorbing species (c) according to EquationEquation (2)(2)
(2) [Citation26,Citation27].
A reference band is introduced to account for a non-zero baseline absorbance in experimental spectra. Using a reference band also corrects for variations in sample thickness and peak integration errors related to cure shrinkage and the initial thermosetting reaction [Citation28]. The fractional degree of epoxy conversion is expressed by EquationEquation (3).(3)
(3) Where α is the degree of epoxy conversion (degree of cure), A is the absorbance peak area, and the subscripts’ 0’ and ‘t’ denote zero (unreacted epoxy monomer) and reaction time t (cured sample). The subscripts’ epoxy’ and ‘ref’ indicate characteristic epoxy and reference peaks.
The degree of monomer conversion was characterised using the reduction of the area of the oxirane group at 915 cm−1 against the invariant peak at 1507 cm−1 (C=C stretching of the benzene ring) as an internal standard as expressed in EquationEquation (4)(4)
(4) [Citation29,Citation30]. Peaks were selected due to stronger relative signal intensities than other analytical and reference peaks. Absorbance peak areas were calculated using a baseline integration function between 927–893 cm−1 and 1526–1489 cm−1. Manual adjustments were performed to account for minor peak shifting effects between samples.
Spectra of macroscale specimens were plotted as a normalised average of ten samples. Spectra of droplet specimens were plotted as a normalised average of 30 specimens to account for inter-sample variation.
2.6. Scanning electron microscopy
Scanning electron microscopy (SEM) was used to examine the microdroplet debond region. Specimen stubs were gold-coated using an Agar sputter coater under an argon atmosphere with an operating pressure of 0.08 mbar, 30 mA current, and a 40 s coating time. Analysis was performed using a Hitachi SU 6600 scanning electron microscope with an accelerating voltage of 15.0 kV and a 10 mm working distance.
3. Results and discussion
3.1. Effect of recommended macroscale curing schedule
Epoxy resins can be expected to achieve typical apparent IFSS values of 25–35 MPa with unsized glass fibres [Citation2,Citation19,Citation22,Citation31]. Microbond testing of Epotec and Olin-epoxy resin droplets showed exceedingly low values of apparent IFSS (in the range of <1 MPa) when samples were cured according to the recommended macroscale schedule. In-situ observation during testing showed that the droplets deformed plastically under applied load, indicating incomplete cure. Measurement of IFSS was not possible in such cases, and the resulting forces recorded during the test can be attributed to frictional effects related to the crushing of the droplet and subsequent fibre pull-out from the soft semi-cured matrix as opposed to any accurate measure of adhesion. Plastic deformation is visible in SEM micrographs of post-test Epotec microbond samples in ). shows an elongated meniscus at the point of contact with the shearing blades, which is characteristic of plastic deformation during the test. In , droplets were deformed from an initial axisymmetric ellipsoid to a sphere after contact with the shearing blades.
Figure 3. SEM micrographs of plastically deformed (a,b) and successfully debonded (c,d) microbond droplets.
The dependence of the apparent IFSS obtained from the microbond test on the stoichiometry of the epoxy matrix material and droplet Tg relative to the testing temperature has been extensively reported [Citation21,Citation32,Citation33]. Commercial bulk matrices subjected to identical curing conditions showed Tg of some 79–87°C. Thus, microbond droplets of these epoxy resins should have been capable of producing testable specimens. Conversely, 332-TETA droplets appeared to cure consistently following exposure to immediate elevated temperature heating. Successful debonding of the 332-TETA droplets shown in ) was confirmed by a residual meniscus. The in-situ observation did not exhibit plastic deformation during the test, and an apparent IFSS value of around 38 MPa was measured.
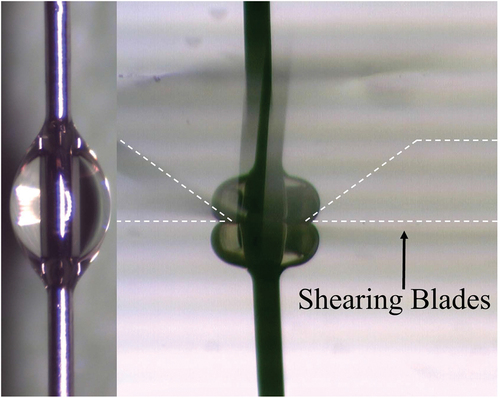
Several studies have reported a correlation between apparent droplet properties and embedded length [Citation4,Citation6]. Consequently, we performed microbond testing after commercial resins were applied to lengths of 50 µm and 125 µm diameter annealed steel wire filaments and cured according to the recommended macroscale schedule. The average droplet embedded was increased from around 120 µm to approximately 400 µm and 700 µm for 50 µm and 125 µm steel filaments, respectively. Pre-test and in-situ optical micrographs of Epotec resin droplets prepared on steel wire are shown in . Steel wire/epoxy microbond tests reflected that of glass fibre/epoxy measurements. Plastic deformation was observed in situ once the droplet met the shearing blades and load was applied. Thus, increasing the embedded length of the droplet alone is insufficient to retard droplet under-cure in these specimens. In any case, such large droplets would not be able to be debonded before glass fibre fracture occurs, assuming that the ‘true’ value of apparent IFSS for these specimens is in the region of 30 MPa [Citation19].
Figure 4. Micrograph of steel filament/epoxy microbond specimen: pre-test and in-situ.
3.2. Characterisation of microbond specimen cure state
Microbond droplet properties are often considered equivalent to a macroscale sample’s. However, methods of assessing droplet properties are rarely reported in the literature, and no standardised technique currently exists. Single droplet characterisation techniques can be further complicated by the fact that the mass of individual glass fibre/thermoset microbond droplet samples is predicted to have a typical mass in the range of 0.5–20 µg while the polymer weight of droplets on fine fibres (such as carbon) may be as low as 20–80 ng [Citation5]. Using conventional thermal analysis techniques to quantify under-cure was impossible due to insufficient signal to detect Tg or residual exotherm from single droplet specimens. Therefore, droplet spectra collected from microbond samples cured on thin lengths of 50 µm diameter steel wire were used to study epoxy group conversion.
It was essential to verify that the degree of cure values obtained from steel wire/epoxy samples were comparable to those of glass fibre/epoxy samples used for the interfacial adhesion measurements. Consequently, we performed infrared microspectroscopy on glass fibre/epoxy and steel wire/epoxy microbond droplet specimens subjected to identical curing schedules. FTIR spectra of Epotec and 332-TETA epoxy microbond droplet specimens cured on glass fibres and steel filaments are shown in , respectively.
Figure 5. Spectral comparison of glass fibre/Epotec and steel wire/Epotec epoxy droplets.
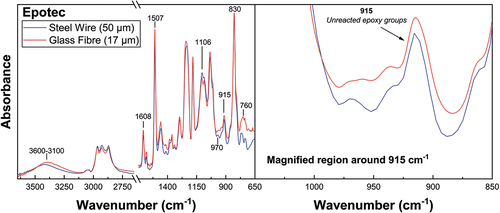
Figure 6. Spectral comparison of glass fibre/332-TETA and steel wire/332-TETA epoxy droplets.
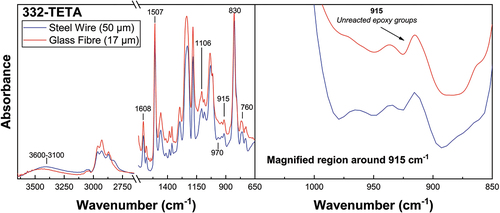
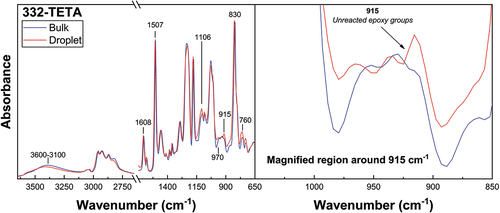
Spectra were also collected from unreacted resins, and the degree of cure was monitored by the conversion of epoxy groups into hydroxyl groups [Citation29]. In all droplet spectra, unreacted epoxy groups are evidenced by increased peak intensities corresponding to vibrations of the oxirane ring at 970, 915, and 760 cm−1 [Citation34,Citation35]. Invariant peaks at 1608 and 1507 cm−1 are attributable to the C=C and C–C stretching of the aromatic (benzene) ring [Citation28]. The peak at 830 cm−1 is assigned to the aromatic ring’s vibration and oxirane ring C-O-C [Citation36]. FTIR band assignments are summarised in .
Table 2. Epoxy/amine curing FTIR band assignments.
The degree of cure of droplets is determined using EquationEquation (4).(4)
(4) There was good agreement between spectroscopic methods in that the degree of cure values for glass fibre and steel wire epoxy droplets were 0.52 and 0.55, respectively, for Epotec specimens. Similarly, the degree of cure values for glass fibre and steel wire epoxy droplets were 0.85 and 0.87 for 332-TETA samples. Accordingly, spectra from large resin droplets cured on 50 µm steel filaments were considered as comparable models of the cure state of the much smaller droplets prepared on unsized glass fibres. This method of sample preparation enables a high-throughput method of droplet cure state assessment using a conventional benchtop spectrometer by generating sufficient signal strength to allow spectra to be collected from individual droplets without the need to employ complex thermal analysis methods involving droplet clusters [Citation6,Citation7] or alternative specimen geometries such as thin films [Citation7,Citation18].
3.3. Degree of cure at droplet and bulk matrix scales
FTIR was conducted on droplet and bulk matrix specimens subjected to identical thermal histories. The FTIR spectra of Epotec and Olin droplet and bulk matrix specimens are shown in , respectively. Spectra of microbond samples cured according to the recommended macroscale schedule were commensurate with a non-stoichiometric epoxy/amine network. Unreacted epoxy groups not present in comparable bulk matrix spectra were observed, in addition to reduced hydroxyl and secondary amine group accumulation and a weaker etherification peak. The average degree of cure value for these droplet specimens was 0.55. Conversely, cured bulk matrices subjected to an identical thermal history showed a significantly higher degree of cure values of around 0.89.
Figure 7. Spectral comparison of Epotec droplet and bulk matrix specimens cured according to the recommended macroscale schedule.
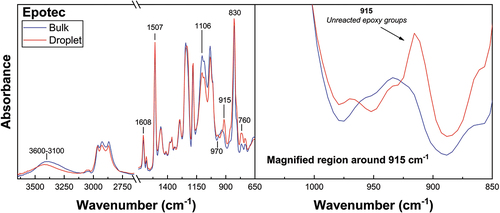
Figure 8. Spectral comparison of Olin droplet and bulk matrix specimens cured according to the recommended macroscale schedule.
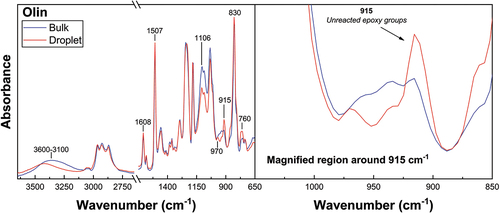
This apparent disparity in curing behaviour observed may suggest a stoichiometric imbalance due to the evaporation of components essential to the polymerisation reaction, such as the curing agent. It is possible that loss in droplet stoichiometry produced insufficient amine groups to ensure a strongly cross-linked network structure in the droplet [Citation3,Citation4,Citation7]. Poorly cross-linked droplets that show plastic deformation during testing indicate a sub-optimal microdroplet Tg. Epotec and Olin droplets appeared to have a Tg close to, or below, room temperature and hence do not have a sufficiently high modulus to transmit applied load and enable standard microbond testing to take place. A previous study of the stoichiometry of this resin system indicates a droplet Tg in the region of −2°C, a value some 90°C lower than that of the bulk matrix and suggesting a loss of up to 60% of the initial curing agent [Citation37].
FTIR spectra of 332-TETA droplet and bulk matrix specimens cured according to identical schedules are shown in . Spectra of 332-TETA microbond droplet specimens were similarly representative of an under-cured matrix formulation, indicated by unreacted epoxy groups at 915 cm−1 that were not present in the bulk matrix sample. The degree of epoxy conversion for 332-TETA droplets was 0.87, while comparable bulk specimens reached a conversion of 0.95. These results suggest that the epoxy droplet samples typically associated with the microbond test do not possess material properties similar to those of bulk matrix specimens, even in cases where good debonding is achieved and reasonable values of apparent IFSS are measured. These data correlate well with a previous stoichiometry study of the same TETA curing agent, indicating that a significant reduction in IFSS did not onset until curing agent content was reduced by more than 60% [Citation21].
Figure 9. Spectral comparison of 332-TETA droplet and bulk matrix specimens cured according to identical schedules.
It may be suggested that a critical surface-to-volume ratio exists at which some portion of the amine curing agent diffuses to the droplet’s surface and evaporates, even though vapour pressures for these systems do not indicate high volatility. In any case, spectra of microbond droplet specimens confirmed that the cure state was significantly reduced compared to bulk matrices. For a multiple-component commercial resin system, the cure state was reduced to the extent that microbond testing was impossible. In a reference epoxy system, the droplet degree of cure was lower than that of comparable bulk matrix specimens while remaining sufficiently high to promote good crosslinking and a relatively high droplet Tg. These results suggest that droplet curing behaviour, and hence droplet Tg, strongly depends on parameters such as the curing agent used and Tg at ideal stoichiometry. Accordingly, it is advised that great care be taken in curing droplet specimens to ensure that I) testable microbond samples can be produced and II) that microbond samples represent comparable macroscale matrices. Thus, using the microbond test should be complimented by some method of cure state evaluation.
3.4. Effect of sample preparation modification
The cure behaviour of these resin systems was investigated as a function of post-curing and pre-cure standing time using the steel filament FTIR method described in this paper and the microbond test.
3.4.1. Post-curing
Epotec droplets that showed plastic deformation and a low degree of cure were post-cured at 120°C for 2 h before microbond testing. An apparent IFSS value of approximately 10.5 MPa was measured for these specimens. However, clear debonding was not observed, and appreciable deformation was observed during loading. shows a representative load-extension plot generated while testing these specimens. Peak areas of load-extension plots were significantly broader than those of a well-cured sample shown in due to plastic deformation of the droplet. These results may confirm that poor droplet cure was attributable to an irreversible amine deficiency during the first cure cycle. Increased apparent IFSS after post-curing can be attributed to increased cross-linking and etherification of the off-stoichiometric droplets, allowing an overall higher degree of cure, and hence droplet Tg, to be achieved [Citation38].
Figure 10. Load–extension curves generated during microbond testing showing (a) semi-plastic behaviour and (b) good debonding.
3.4.2. Room temperature standing time
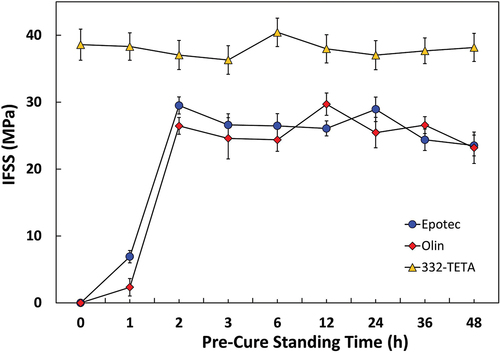
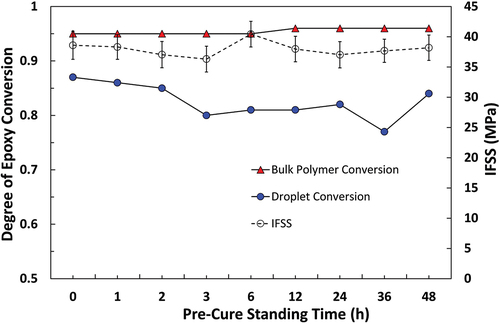
Microbond testing results following the introduction of a 0–48 h room temperature pre-curing time before the standard curing schedule are shown in . The inclusion of a room temperature pre-cure stage had a significant effect on the apparent IFSS of Epotec and Olin specimens. It was found that a 2 h room temperature standing time was sufficient to ensure good droplet curing and interfacial adhesion. Further pre-curing times of up to 48 h showed no significant improvement. Improved curing performance after a 2 h stand would indicate that the pre-cure standing time necessary to produce cured droplets is notably lower than previously reported in the literature [Citation6,Citation8]. The apparent IFSS of 332-TETA samples was independent of pre-cure standing time, and microdroplets cured consistently across the range of schedules investigated. Higher IFSS values observed for the 332-TETA data sets may be attributable to a higher cured matrix Tg.
Figure 11. Relationship between apparent IFSS and pre-cure standing time.
These results partially correlate with those of Zinck et al. [Citation18], who reported that a pre-curing time had no effect on amine-cured samples and a detrimental effect on anhydride-cured droplets. In this work, a pre-curing time did not affect droplets cured with a tetrafunctional amine. However, introducing a pre-curing time resulted in a significant increase in diamine-cured droplet properties. Differences in vapour pressure and curing agent volatility do not seem to be able to fully explain why some curing agents appear more susceptible to poor droplet curing. It would appear that the microscale curing behaviour of droplet samples is related to both the mode of polymerisation and the functionality of the curing agent used. The improved curing performance of 332-TETA droplets may be linked to more reactive hydrogen atoms than the Epotec/Olin diamine curing agents and the ability to form intermolecular bonds more quickly. Improved curing performance may also be attributable to comonomers reacting at low temperatures and preventing the vaporisation of some portion of the curing agent.
The FTIR spectra of droplet and bulk matrix samples cured immediately according to the standard schedule and with pre-cure standing times of 1, 2, and 48 h, as shown in . Epotec and Olin microbond droplet samples cured immediately and with a standing time of only 1 h showed unreacted epoxy groups at 970 and 915 cm−1 and were commensurate with spectra indicative of an off-stoichiometric matrix formulation. Conversely, spectra of bulk matrix specimens were not significantly affected by including a pre-curing time and all samples were cured similarly. For the 332-TETA microbond droplet samples, spectra were generally consistent regardless of whether a standing time was used. In all cases, however, unreacted epoxy groups were visible in droplet samples absent in the bulk matrix spectra.
Figure 12. FTIR spectra of microbond droplet specimens and bulk cured matrices after standard cure cycle and with 0–48 h pre-cure.
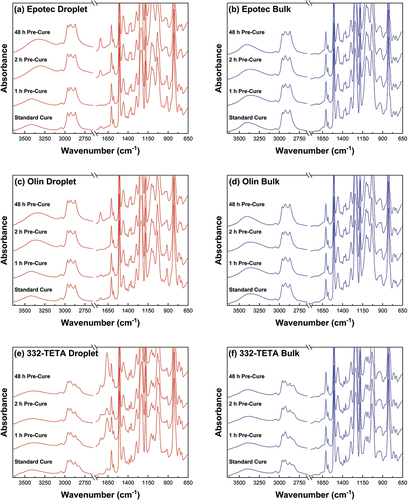
Droplet specimens showed additional peaks not present in the spectra of bulk matrix samples. A peak at 1744 cm-1 in Epotec and Olin droplets indicates the formation of a compound containing a carbonyl group. Zinck et al. observed the same band’s appearance in the spectra of thin films and similarly observed that they were not present in bulk samples [Citation18]. The formation of an imine group at 1661 cm−1 was also reported [Citation18], which was not present in the diamine-cured droplets in this work. The 332-TETA droplets, however, showed a peak attributable to imine group formation at 1663 cm−1. It is also possible that peak growth at 1663 cm−1 is attributable to an interaction with atmospheric moisture [Citation39]. As a general trend, peak intensities at 1744 cm−1 and 1663 cm−1 increased with pre-cure duration, indicating that potential imine formation and moisture interaction may occur during pre-gelation of the polymer droplet specimens.
The degree of conversion of droplet and bulk matrix specimens subjected to identical thermal histories have been plotted against apparent IFSS measured by the microbond test. Epotec, Olin, and 332-TETA resins are shown in , respectively. Quantitative analysis of unreacted epoxy groups showed that Epotec and Olin droplets cured according to the standard macroscale schedule had a degree of cure in the region of 0.55, a value commensurate with a loss of up to 60% of the initial curing agent and a sub-ambient Tg. Droplets that were allowed to pre-cure at room temperature for 2–48 h and partially react before curing had degrees of cure between 0.85 and 0.93. The degree of conversion of bulk matrix specimens was not significantly affected by the inclusion of a pre-curing time and, in all cases, cured to a higher degree than comparable droplet specimens. In the 332-TETA droplet samples, the degree of cure was reduced slightly in the 3–36 h pre-curing range. The degree of conversion was lowest (0.77) following a 36 h pre-cure and was, in fact, highest when samples were cured immediately (0.87). Despite higher apparent IFSS values that were largely invariant with pre-curing time, all 332-TETA droplet samples were cured to a lower degree than the bulk matrix specimens.
Figure 13. Comparison of apparent IFSS for the Epotec epoxy system and the degree of epoxy conversion in a microdroplet versus a bulk polymer sample with different pre-cure standing times.
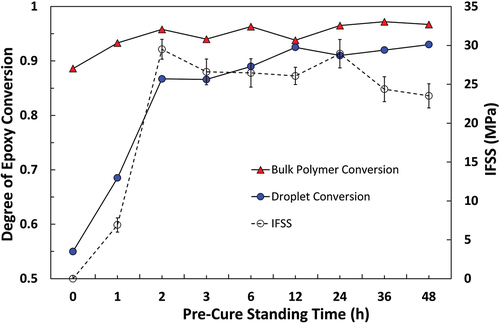
Figure 14. Comparison of apparent IFSS for the Olin epoxy system and the degree of epoxy conversion in a microdroplet versus a bulk polymer sample with different pre-cure standing times.
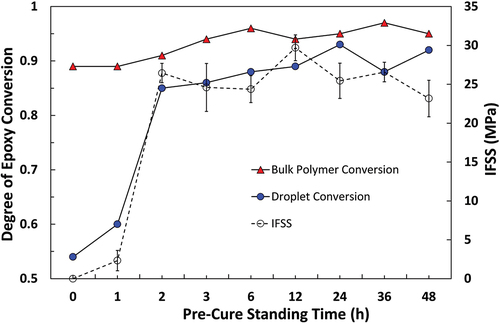
Figure 15. Comparison of apparent IFSS for the 332-TETA epoxy system and the degree of epoxy conversion in a microdroplet versus a bulk polymer sample with different pre-cure standing times.
A good correlation was shown between micromechanical and spectroscopic methods in that an increase in IFSS was commensurate with spectra, indicating droplets had higher degrees of cure. IFSS appeared to exhibit a linear relationship with microdroplet degree of cure up to the conversion of approximately 0.8, after which further increases in droplet cure state were not reflected in increased IFSS. It is possible that an upper threshold IFSS value limited by the adhesion properties and tensile strength of the unsized fibres was reached in such cases. Due to the absence of sizing on the fibres, however, it is reasonable to suggest that IFSS was largely dependent on the cure state of the droplet. Bartolomeo et al. have similarly proposed that IFSS in a cyanate ester system was primarily dictated by the degree of monomer conversion [Citation40]. IFSS values for the 332-TETA system were higher than those of Epotec and Olin samples cured to similar or higher degrees, possibly due to higher matrix Tg. However, differences in Tg alone would appear insufficient to explain IFSS values some 40% higher than those of Epotec and Olin samples. Variability in residual radial compressive stresses generated during cure shrinkage and static friction at the fibre/matrix between matrices may contribute [Citation41].
The differences in droplet curing behaviour between diamine and tetra functional amine cured specimens may indicate distinct phenomena contributing to reduced droplet cure states and ensuing thermomechanical properties being lower than those of comparable bulk matrix specimens. For Epotec and Olin droplets, diamine curing agent evaporation appeared to result in insufficient amine groups necessary to produce a strongly cross-linked network structure in the droplet. For 332-TETA droplets, the cure state may have been lowered by formation of an imine group or interaction with atmospheric moisture. Both phenomena may contribute to the depletion of active amine sites available to react with the oxirane ring and reduce droplet Tg [Citation18,Citation42]. Accordingly, it seems reasonable to suggest that the epoxy droplet samples typically associated with the microbond test do not possess material properties comparable to those of bulk matrix specimens, even with modifications to the recommended curing schedule and in cases where droplet curing behaviour appears ideal.
The ability of micromechanical testing methods to inform macroscale materials selection and processing parameters is predicated on an assumption of comparable polymer chemistry and material properties across both scales. The data presented in this study would indicate that this assumption is often invalid for thermoset systems. Hence, the determination of the droplet cure state should be considered when employing the microbond test. It should be carefully considered that the 332-TETA data would suggest that even droplets with ‘ideal’ curing behaviour may have material properties different from those of the bulk cured matrix and comparable composite parts. By extension, several matrix and curing agent combinations in the previous microbond literature that do not appear to show excessively poor droplet curing may still have unrecognised sub-optimal material properties. In such cases, the validity of the testing method may be questioned due to interfacial adhesion being assessed on an undefined system chemistry. Such a result would imply that all thermoset microbond samples may be susceptible to some form of microscale curing issue. Interfacial testing methods are often employed to measure the influence of factors such as fibre surface treatments and the application and screening of sizings. The effect of the cure state of the matrix microdroplet may mask changes in IFSS as a result of such alterations. Thus, the route taken in creating microbond samples, the potential effect of discrepancies in microscale curing and the resulting disparity between droplet and bulk matrix material properties must be carefully considered by all practitioners of the microbond test.
The novel droplet cure state characterisation method presented in this work has been used to evaluate two commercial diamine-cured resins and a reference tetrafunctional amine-cured resin. The results suggest a relationship between curing agent chemistry and the extent to which microbond droplet curing is inhibited by scaling effects. However, different fibre/matrix and matrix/curing agent combinations may present unexpected sample preparation artefacts that can significantly affect measured values of apparent IFSS. Some preliminary investigation of an extended range of curing agent chemistries has revealed that amines with a higher number of reactive hydrogen atoms and increased functionality appear to cure to a high degree and retard droplet scaling effects [Citation43]. Future works will extend the technique to examining vinyl ester and polyester microbond droplets to evaluate deviation from macroscale properties and some unexpected interactions with cyanoacrylate [Citation14]. We also foresee good scope to use the technique to explore the contribution of droplet degree of cure to data scatter in the microbond test.
4. Conclusions
This paper addresses a fundamental need for a method to characterise the cure state of microbond droplet samples directly. We investigated the curing performance of three epoxy resin systems using the microbond test and FTIR spectroscopy techniques. The following conclusions were drawn from the investigation:
The larger droplets cured on thin-steel filaments are suitable models of typical glass fibre/epoxy microbond droplet specimens and enable high-throughput determination of microbond droplet cure state using a conventional benchtop spectrometer.
Cure schedules used to manufacture composite parts produced microbond droplets with degrees of cure lower than bulk matrix specimens subjected to an identical thermal history.
For commercial epoxy resin systems, testable microbond droplets could only be produced when a room temperature pre-curing time of at least 2 h was introduced.
Distinct phenomena such as amine evaporation, imine formation, and interaction with atmospheric moisture may contribute to reduced thermoset droplet cure depending on curing agent selection.
Apparent IFSS in the microbond test depends strongly on the droplet’s degree of cure, and hence Tg.
It is concluded that microbond testing should be supported by a droplet cure state characterisation method to ensure that interfacial effects are not artefacts of droplet sample preparation.
CrediT author statement
David Bryce: Experimental Methodology Development; Investigation; Formal analysis; Visualisation; Original draft preparation; Writing and Editing
James Thomason: Conceptualization, Funding acquisition, Initial Methodology, Primary Supervision, Original draft preparation, Reviewing and Editing.
Liu Yang: Secondary Supervision; Reviewing and Editing.
Disclosure statement
The authors confirm there are no relevant financial or non-financial competing interests to report. The corresponding author discloses that this work was partially reported at the 20th European Conference on Composite Materials and the accompanying proceedings, sections of which are reproduced in accordance with CC BY-NC 4.0 license and related Publishing Agreement [20].
Additional information
Funding
References
- Herrera-Franco PJ, Drzal LT. Comparison of methods for the measurement of fibre/matrix adhesion in composites. Composites. 1992;23(1):2–26. doi: 10.1016/0010-4361(92)90282-Y
- Miller B, Muri P, Rebenfeld L. A microbond method for determination of the shear strength of a fiber/resin interface. Compos Sci Technol. 1987;28(1):17–32. doi: 10.1016/0266-3538(87)90059-5
- Järvelä P, Laitinen KW, Purola J, et al. The three-fibre method for measuring glass fibre to resin bond strength. Int J Adhes Adhes. 1983;3(2):141–147. doi: 10.1016/0143-7496(83)90119-7
- Haaksma RA, Cehelnik MJ. A critical evaluation of the use of the microbond method for determination of composite interfacial properties. Mater Res Soc Symp Proc. 1990;170:71–76. doi: 10.1557/PROC-170-71
- Thomason J. An overview of some scaling issues in the sample preparation and data interpretation of the microbond test for fibre-matrix interface characterisation. Polym Test. 2022;111:107591. doi: 10.1016/j.polymertesting.2022.107591
- Rao V, Herrera-Franco P, Ozzello AD, et al. A direct comparison of the fragmentation test and the microbond pull-out test for determining the interfacial shear strength. J Adhes. 1991;34(1–4):65–77. doi: 10.1080/00218469108026506
- Rao V, Drzal LT. Loss of curing agent during thin film (droplet) curing of thermoset material. J Adhes. 1991;22(4):245–249. doi: 10.1080/00218469108041011
- Ozzello AD, Grummon DS, Drzal LT, et al. Interfacial shear strength of ion beam modified UHMW-PE fibers in epoxy matrix composites. Material Research Society Symposium Proceedings. Materials Research Society; San Diego, California. 1989. p. 217–222. doi: 10.1557/PROC-153-217
- Liao YT, Tung IC. Properties of carbon fibre-polymer interfaces. J Mater Sci Lett. 1991;10(5):272–275. doi: 10.1007/BF00735655
- Laurikainen P, Jokinen J, Lindgren M, et al. High throughput mechanical micro-scale characterisation of composites and the utilisation of the results in finite element analysis. Proceedings of the 18th European Conference on Composite Materials; 2018 Jun 24-28; Athens, Greece: ECCM; 2018
- Ash JT, Cross WM, Kellar JJ. Estimation of the true interfacial shear strength for composite materials with the microbond test. Proceedings of the ASME 2013 International Mechanical Engineering Congrress and Exposition; 2013 Nov 15–21; San Diego, CA: ASME; 2013.
- Laurikainen P. Characterization of the aging of glass-fibre reinforced polymers [ master’s thesis]. Tampere (Fi): Tampere University of Technology; 2017.
- Bénéthuilière T, Duchet-Rumeau J, Dubost E, et al. Vinylester/Glass fiber interface: still a key component for designing new styrene-free SMC composite materials. Compos Sci Technol. 2020;190:108037. doi: 10.1016/j.compscitech.2020.108037
- Thomason JL, Jenkins PG, Xypolias G. Microbond testing of the interface in glass fibre vinylester composites. Compos Interfaces. 2021;29(6):695–709. doi: 10.1080/09276440.2021.2011593
- Dirand X, Hilaire B, Soulier JP, et al. Interfacial shear strength in glass-fiber/vinylester-resin composites. Compos Sci Technol. 1996;56(5):533–539. doi: 10.1016/0266-3538(96)00040-1
- Charlier Q, Lortie F, Gerard P, et al. Interfacial adhesion between glass fibers and acrylic-based matrices as studied by micromechanical testing. Proceedings of the 20th International Conference on Composite Materials; 2015 Jul 19–24; Copenhagen, Denmark: ICCM; 2015.
- Charlier Q, Lortie F, Gérard JF. Interfacial adhesion in glass-fiber thermoplastic composites processed from acrylic reactive systems, a multi-scale experimental analysis. Int J Adhes Adhes. 2020;98:102536. doi: 10.1016/j.ijadhadh.2019.102536
- Zinck P, Wagner HD, Salmon L, et al. Are microcomposites realistic models of the fibre/matrix interface? II. Physico-Chem Approach Polymer. 2001;42(15):6641–6650. doi: 10.1016/S0032-3861(00)00871-5
- Gao X, Jensen RE, Li W, et al. Effect of fiber surface texture created from silane blends on the strength and energy absorption of the glass fiber/epoxy interphase. J Compos Mater. 2008;42(5):513–534. doi: 10.1177/0021998307086203
- Bryce D, Thomason J, Yang L. Thermoset polymer scaling effects in the microbond mest. Proceedings of the 20th European Conference on Composite Materials. 2022 Jun 26–30; Lausane, Switzerland: ECCM; 2022.
- Thomason JL, Yang L, Bryce D, et al. An exploration of the relationship of chemical and physical parameters in the micromechanical characterisation of the apparent interfacial strength in glass fibre epoxy systems. IOP Conf Ser Mater Sci Eng. 2016;139:012048. doi: 10.1088/1757-899X/139/1/012048
- Bryce D, Thomason JL, Yang L. An investigation of fibre sizing on the interfacial strength of glass-fibre epoxy composites. Proceedings of the 18th European Conference on Composite Materials; 2018 Jun 24–28; Athens, Greece: ECCM; 2018.
- Thomason JL, Nagel U, Yang L, et al. A study of the thermal degradation of glass fibre sizings at composite processing temperatures. Compos Part A Appl Sci Manuf. 2019;121:56–63. doi: 10.1016/j.compositesa.2019.03.013
- Yang L, Thomason JL. Development and application of micromechanical techniques for characterising interfacial shear strength in fibre-thermoplastic composites. Polym Test. 2012;31(7):895–903. doi: 10.1016/j.polymertesting.2012.07.001
- Pitkethly MJ, Favre JP, Gaur U, et al. A round-robin programme on interfacial test methods. Compos Sci Technol. 1993;48(1–4):205–214. doi: 10.1016/0266-3538(93)90138-7
- Fouchal F, Knight JAG, Dickens PM. Monitoring the polymerization of a diglycidyl ether bisphenol-A/2,2′-dimethyl-4,4′-methylenebis (cyclohexylamine) matrix with a Fourier transform infrared optical fibre sensor. Proc Inst Mech Eng Part L J Mater Des Appl. 2004;218(4):331–342. doi: 10.1243/1464420042722291
- Swinehart DF. The Beer-Lambert Law. J Chem Educ. 1962;39(7):333–335. doi: 10.1021/ed039p333
- Cholake ST, Mada MR, Raman RKS, et al. Quantitative analysis of curing mechanisms of epoxy resin by mid- and near- Fourier transform infra red spectroscopy. Def Sci J. 2014;64(3):314–321. doi: 10.14429/dsj.64.7326
- Cañavate J, Colom X, Pagès P, et al. Study of the curing process of an epoxy resin by FTIR spectroscopy. Polym Plast Technol Eng. 2000;39(5):937–943. doi: 10.1081/PPT-100101414
- Karayannidou EG, Achilias DS, Sideridou ID. Cure kinetics of epoxy–amine resins used in the restoration of works of art from glass or ceramic. Eur Polym J. 2006;42(12):3311–3323. doi: 10.1016/j.eurpolymj.2006.08.025
- Gao X, Jensen RE, McKnight SH, et al. Effect of colloidal silica on the strength and energy absorption of glass fiber/epoxy interphases. Compos Part A Appl Sci Manuf. 2011;42(11):1738–1747. doi: 10.1016/j.compositesa.2011.07.029
- Minty RF, Yang L, Thomason JL. The influence of hardener-to-epoxy ratio on the interfacial strength in glass fibre reinforced epoxy composites. Compos Part A Appl Sci Manuf. 2018;112:64–70. doi: 10.1016/j.compositesa.2018.05.033
- Thomason JL, Yang L. Temperature dependence of the interfacial shear strength in glass-fibre epoxy composites. Compos Sci Technol. 2014;96:7–12. doi: 10.1016/j.compscitech.2014.03.009
- Fraga F, Burgo S, Rodrguez Nez E. Curing kinetic of the epoxy system BADGE n = 0/1,2 DCH by Fourier transform infrared spectroscopy (FTIR). J Appl Polym Sci. 2001;82(13):3366–3372. doi: 10.1002/app.2195
- Omrani A, Simon LC, Rostami AA, et al. Cure kinetics FTIR study of epoxy/nickel-imidazole system. Int J Chem Kinet. 2008;43:154–160.
- González MG, Cabanelas JC, Baselga J. Applications of FTIR on epoxy resins – identification, monitoring the curing process, phase separation and water uptake. In: Theophile T, editor. Infrared spectroscopy - materials science engineering and technology. London (UK): InTech; 2012. p. 261–284.
- Bryce D, Thomason J, Yang L. Micromechanical and spectroscopic characterisation of the curing performance of epoxy resins in the microbond test. IOP Conf Ser Mater Sci Eng. 2020;942(1):012019. doi: 10.1088/1757-899X/942/1/012019
- Vanlandingham MR, Eduljee RF, Gillespie JW. Relationships between stoichiometry, microstructure, and properties for amine-cured epoxies. J Appl Polym Sci. 2001;71(5):699–712. doi: 10.1002/(SICI)1097-4628(19990131)71:5<699:AID-APP4>3.0.CO;2-D
- Antoon MK, Starkey KM, Koenig JL. Application of Fourier transform infrared spectroscopy to quality control of the epoxy matrix. Proceedings of the Fifth Conference on Composite Materials: Testing and Design; 1979 Mar 20–22; New Orleans (LA): ASTM; 1979. p. 541–552.
- Bartolomeo P, Chailan JF, Vernet JL. Micromechanical and microscopic effects of preprocessing on interfacial shear stress of glass fiber-cyanate ester resins composite. Proceedings of the 12th International Conference on Composite Materials; 1999 Jul 7-9; Paris, France: ICCM; 1999.
- Thomason JL, Yang L, Minty RF. Are silanes the primary driver of interface strength in glass fibre composites? (exploring the relationship of the chemical and physical parameters which control composite interfacial strength). Proceedings of the 18th European Conference on Composite Materials. 2018 Jun 24-28; Athens, Greece: ECCM; 2018.
- Danieley ND, Long ER. Effects of curing on the glass transition temperature and moisture absorption of a neat epoxy resin. J Polym Sci Polym Chem Ed. 1981;19(10):2443–2449. doi: 10.1002/pol.1981.170191007
- Bryce D. Investigation of a micromechanical methodology for assessing the influence of processing variables and fibre sizing on composite interphase [ dissertation]. Glasgow (UK): University of Strathclyde; 2021.