
ABSTRACT
This case study examines how material resistance (limitations posed by the physical world) and graph interpretation intersected during a high school biology investigation using digital sensors. We use an extended episode from a small group to illustrate how, in an inquiry-based unit, measuring near the resolution limit of a sensor caused scaling issues in graphs. Qualitative videotape analysis focuses on both the students’ attempts to make sense of a perceived lack of variation in the collected data and the teacher's and classroom researchers’ misinterpretation of the students’ difficulties with graph interpretation. We suggest that these educators, though experienced, could have benefited from additional strategies to help them recognise and respond to graph interpretation issues introduced by digital representations of real-world data, and that the students could have benefited from explicit prompts to discuss the limitations of their equipment. We describe several implications for researchers, teachers, and curriculum developers interested in implementing inquiry-based biology investigations using sensor data. We argue that students should be supported to recognise that encountering unexpected results from their investigations and working to understand what these results have to say about the real world is an important and valid part of the practice of real science.
Introduction
The InquirySpace project aimed to facilitate open-ended inquiry for high school students in biology, chemistry, and physics by providing a set of activities within a web-based environment that integrated modern sensor equipment, data analysis tools, online simulations, and provided teacher professional development. The teachers incorporated these activities into their existing curricula. This study investigates the use of a pressure sensor by ninth-grade biology students and the challenges they encountered when interpreting real-time graphs of their sensor readings. One challenge stemmed from the small changes being measured. The nature of this challenge was not recognised in the moment by the teachers or researchers present.
Qualitative analysis is used to explore one student group's engagement with the ‘Mangle of Practice,’ a term referring to the challenges and complexities that arise when trying to apply theoretical concepts and knowledge to real-world situations (Pickering, Citation1995). In this particular case, the students attempted to reconcile their ideas about what they would see with the actuality of what they did see in their osmosis data. While grappling with the mangle of practice, the students encountered material resistance, which describes the way the material world appears to resist human efforts to capture data (Hardy et al., Citation2020; Manz, Citation2015; Pickering, Citation1995).
We review prior research on sensor use in three areas related to modern inquiry classrooms: sensor usage and inquiry, student interpretation of data generated by sensors, and sensor-based teaching. Our theoretical perspective is that material resistance is inherent in much inquiry-based learning and a necessary consideration for teacher noticing, which refers to in-the-moment decisions teachers make in a classroom environment (Chan et al., Citation2021; Jazby et al., Citation2023). To explore how encountering material resistance can factor into the learning experience, we investigate how issues with scaling in data graphs arose and persisted during a biology laboratory investigation. We conclude by proposing several possible ways to notice and address the conceptual and perceptual issues involved. We also discuss possible implications for future studies and curricular design.
Review of literature
Using sensors in inquiry-based science classrooms
The goal of inquiry-based instruction is to facilitate learners’ development of scientific practices, including the process of developing an investigable question, designing an experiment, collecting data, answering research questions through careful analysis, and communicating results (National Research Council, Citation2000). Bell et al. write, ‘at its heart, inquiry is an active learning process in which students answer research questions through data analysis’ (Citation2005, p. 30). In the United States, modern inquiry instruction is often viewed in connection with technology integration, including Internet research, simulations, sensors, and wearables (Cooper et al., Citation2020; Lehtinen & Viiri, Citation2017; Pedaste et al., Citation2015). The emergence of tools and technologies that enable students to conduct activities such as investigation and data gathering more quickly (Pedaste et al., Citation2015) has brought inquiry-based learning to the forefront of modern science education research. The Next Generation Science Standards (NGSS) (NGSS Lead States, Citation2013), widely used in the United States, specifies that students are expected to use laboratory tools connected to computers for observing, measuring, recording, and processing data (Appendix F). Sensors are among the technologies that teachers have used as they seek to answer the NGSS call to engage their students in analysing and interpreting data (NGSS Lead States, Citation2013, Appendix F). Sensor use in classrooms has been around for decades (Mokros & Tinker, Citation1987). Recent research on sensor use reveals that 81% of high school science classrooms in the United States have access to sensors used for collecting data (Smith, Citation2019). They may serve as a valuable aid for teachers in overcoming pedagogical challenges with collecting data during inquiry-based laboratory work (Gericke et al., Citation2023, p. 32). As the use of various types of sensors in school laboratories increases, and teachers provide more inquiry-based learning opportunities, there is a need for educators to address several new concerns related to data collected and graphed through automated means (Lee & Wilkerson, Citation2018). This also has implications for researchers, who need to keep up with emerging cognitive challenges.
Graphical representations of sensor data
Sensors are often paired with technologies that represent data in graphical form (Lee & Wilkerson, Citation2018; Tinker, Citation2002). Although sensors have been shown to have educational potential for science classrooms much in the way graphing calculators have influenced mathematics education (Metcalf & Tinker, Citation2004), researchers have cautioned that students who use sensors do not necessarily interpret graphs automatically. In a series of studies conducted in the 1980s, researchers identified several difficulties students had with interpreting graphs. For example, students seemed to have a weak interpretation of slope, sometimes conflating the representation of the graph with a drawing or mistakenly viewing graphs as ‘pictures’ of an event (Clement, Citation1989; McDermott et al., Citation1987) and these issues have not disappeared with sensor use (Mokros & Tinker, Citation1987). Metcalf and Tinker (Citation2004) noted that while students seemed to identify broad sections of a graph made with a temperature sensor, they faced challenges with reading points or intervals on an axis. More recently, Lai et al. (Citation2016) report that middle school students struggle to interpret features of graphs produced digitally, including slope and axis labels. This can be true, for instance, when sensor software autoscales (Hardy et al., Citation2020).
In spite of these challenges, researchers have reported multiple ways sensors can enhance student learning. Many posit that when sensor data are recorded and displayed in real time on a computer screen, students can collect data and immediately react to it, opening possibilities for students to quickly generate more data, construct graphs, and interpret and discuss results (Millar, Citation2005; Mokros & Tinker, Citation1987; Thornton & Sokoloff, Citation1990). Studies show that although use of real-time graphs seems to accelerate student learning of graph interpretation, students do not begin with this knowledge when they first use this technology (meta-review by Donnelly-Hermosillo et al., Citation2020). Furthermore, while the topics of measurement and graphing tend to be covered in mathematics classes, they have not been well connected to explorations in science class (Lee & Wilkerson, Citation2018; Leinhardt et al., Citation1990). Without adequate graph interpretation skills, it would be difficult for students to extract information from their sensor readings or draw formal mathematical conclusions to explain relationships in a scientific experiment.
Research on teaching with sensors
The cost of sensors has decreased substantially in the last 25 years, opening possibilities for schools to adopt these technologies (Price, Citation2017) and for researchers to evaluate curricular approaches and assessment tools. A number of best practices have emerged, including considering which experimental equipment is best to support student learning and student agency in data production, as well as to develop supportive curriculum materials and assessment tools available for teachers (Bernhard, Citation2018; Hardy et al., Citation2020; Lee & Wilkerson, Citation2018; Price, Citation2017). Lee and Wilkerson (Citation2018) caution that while sensor technologies have been an effective tool for secondary classrooms, teachers and students must be mindful of their limitations and variability, especially when interpreting data. We will suggest that educators need more efficient ways for teachers (and students) to assess graphing issues that arise in the context of classroom use of digital measurement tools, particularly when scaling issues emerge as a result of sensor resolution.
Overall, the literature on data interpretation and its importance is well established and provides important insights into specific skills gained from using sensor technologies. The automated generation of real-time graphs has been shown to give students a learning advantage in their understanding of graphs in some situations (Price, Citation2017; Zucker et al., Citation2008). However, it is still essential to understand how to identify and assist students struggling with graphing issues when the primary focus of classroom activity is on producing and comprehending data using sensors. In high school settings, students and teachers encounter difficulties in managing such finer details spontaneously. Addressing this issue can help educators identify strategies for enabling students to use inquiry-based approaches to think and act more as scientists do.
Theoretical framework
A core tenet of the InquirySpace approach is the importance of exposing students to authentic scientific experiences to support their ability to accurately interpret scientific phenomena. Researchers have argued that part of an authentic science experience involves students taking ownership of the data they collect and that using sensors to collect data can provide valuable opportunities for students to work like scientists (Hardy et al., Citation2020; Lee et al., Citation2021). Therefore, collecting data with sensors is a useful way to offer students such opportunities.
Material resistance in school science laboratories
Education researchers have shown interest in Pickering’s (Citation1995) ‘Mangle of Practice’ as school science increasingly emphasises analysis of real-world data. The mangle of practice describes how scientific practices and ideas are developed through a dance between human and material agency, with scientists developing hypotheses, procedures, and measures that are applied to material phenomena that then respond with resistance. Pickering discusses resistances that hinder a scientist's efforts to capture a phenomenon. When the results of an investigation confound theories, scientists engage in the mangle of practice to realign theories with observations by adjusting theories, instruments, or both. Manz (Citation2015) suggests that Pickering's ideas are congruent with current learning science approaches and can aid in the design and analysis of disciplinary practices and understanding in the classroom.
Students who intend to gather data from sensor readings in science classroom laboratories may face obstacles due to material resistance. The concept of material resistance, which refers to the physical world's unyielding nature when attempts are made to extract information using measuring tools, was first introduced by Pickering (Citation1995). Manz (Citation2015) further defined material resistance as ‘push back from the world’ (p. 90). Despite the potential increase in data production when using digital measuring devices, students must understand and respond to the information presented by these instruments. In the laboratory, students may need to engage in the mangle of practice to reconcile their expectations with the data they acquire. To interpret the data successfully, given the limitations of their measuring tools, students must address this issue.
Scaffolding student responses to material resistance in science instruction
Students require guidance and support from their teachers in order to handle their equipment during inquiry investigations and interpet the results to gain an understanding of natural phenomena (Bernhard, Citation2018; Wu & Krajcik, Citation2006). Our case study examines how a group of students tackled the challenge of comprehending natural phenomena as they encountered material resistance. We investigate the types of support that the students received to help them understand, interpret, and improve their experimental methods, as well as additional support that we believe would have been helpful. We also examine how the students dealt with the challenges posed by the limitations of the available equipment.
Recent developments in research on teacher noticing and improvising in science classrooms have enriched our understanding of how teachers scaffold learning (Chan et al., Citation2021; Jazby et al., Citation2023). The study of teacher noticing has its roots in mathematical education but has recently gained more attention in science education (Chan et al., Citation2021). Teacher noticing is defined broadly as the cognitive process involved during in-the-moment teaching observations and pedagogical decisions in a loud and confusing classroom environment (Jazby et al., Citation2023). In this study, the question of what the teacher and researchers chose to scaffold in the moment in an inquiry-based environment is at the heart of how to promote students’ learning to link collected data to scientific phenomena. Thus, we look not only at how students respond to a representation of their data, but how they are supported by the teacher and researchers in the moment as they work to link that representation back to the phenomenon.
In particular, we look at how the teacher and researchers noticed and supported students as those students engaged in the mangle of practice in the course of data production, struggling to align their conceptions with what their instruments were recording. In this case, student encounters with material resistance involved scaling issues when the collected data went near the resolution limit of the sensors. We focus on the following questions:
How did scaling issues manifest for the students when data collection approached the sensor's measurement capabilities?
How did the teacher and classroom researchers interpret these manifestations and attempt to provide in-the-moment scaffolding?
Methods
Case study
We found a dearth of literature on how to notice and address scale issues related to sensor-based inquiry investigations at the high school level. We, therefore, use an exploratory case study approach (Yin, Citation2018) to investigate how these processes developed in a classroom context with technologies, group work, and teacher scaffolding. We selected one group of ninth-grade biology students for in-depth analysis according to criteria described below. We examined their activity when they first encountered and reacted to real-time data collected with a pressure sensor that approached the limits of what the sensor could measure. A detailed account of classroom activity will illuminate a particular instance of struggles we observed in this biology class and the effects of the strategies that the teacher and researchers employed to attempt to support the students in addressing those struggles.
The biology curriculum context
The InquirySpace project developed three inquiry-based curriculum units designed to scaffold the development of students’ independent experimental inquiry in high school physics, chemistry, and biology. In our project's curricular framework, students iteratively moved through cycles of design, collect, analyse, and explain when investigating a phenomenon (St. Clair & Stephens, Citation2022). In each discipline, a unit of three investigations, lasting two to three weeks, was designed so that explicit scaffolds fade over the course of the investigations. The teacher introduced phenomena first to raise questions, then introduced the inquiry-based investigations. In the first two investigations of the biology sequence, students started with a simulation and then, through trial and error, learned how to design procedures with reproducible results. By the third investigation, the curriculum was more open-ended, with the teacher selecting a phenomenon and students taking charge of designing their experiments to investigate the phenomenon using sensors. In the experiments, the sensor readings were imported from our real-time data collection tool, SensorConnector, into our open-source web-based data analysis platform called the Common Online Data Analysis Platform (CODAP) (Finzer, Citation2014), which is specifically designed to support data analysis and modelling for students. CODAP is designed to import data from various sources such as sensors, simulations, text files, data files, and manual data entry. The platform facilitates data organisation and analysis through a drag-and-drop interface and linked representations across graphs and tables, supporting student exploration of and reasoning with data.
The experimental setup. This study focuses on the second investigation in biology. The objective of this investigation was to help students realise the importance of designing a suitable experimental procedure and to emphasise the need for a class consensus on a common procedure to facilitate the comparison of results. In this investigation, students used a pressure sensor connected by an air-filled tube to a single-hole cork that was placed inside a ‘well’ bored into a potato (). When water moved into the well from the surrounding potato cells, the air column was compressed and its pressure increased. When water moved out of the well and into the potato cells, the volume of the air column expanded and its pressure decreased. The sensor detected these changes over time and recorded them through the software interface running on the attached computer.
Figure 1. The experimental setup with the potato and pressure sensor [left] and an illustration of this in the module [right].
![Figure 1. The experimental setup with the potato and pressure sensor [left] and an illustration of this in the module [right].](/cms/asset/5b498f8a-03f3-4897-bffe-dc5dc5a75a55/tsed_a_2260064_f0001_oc.jpg)
To conduct the trial runs, students filled the well in the potato with water containing salt concentrations ranging from 0% to 20%. Each student group conducted multiple trials for their assigned concentration value. With pure water in the well, water should flow out of the well. In a period of 10 min, measurements should show a decrease in pressure. Measurements of the change in pressure were very small with each timed observation, near the limit of the sensor to resolve that change. The overall change observed during the 10-minute trial was typically only around 2 kilopascals (kPA). The full range of the sensor is 0–400 kPA, with a 0.03 kPA resolution, meaning that the 2 kPA change observed only accounted for 0.5% of the total range of the sensor. These Vernier brand sensors are commonly used in high schools, and the teacher had a set of them available in her classroom.
Case selection
The school. This study was carried out in a suburban high school located in California. At the school, 43% of students were eligible for free/reduced lunch; 38% were proficient or above average in Common Core Mathematics Standards. In 2019 when this study was conducted, the school's dropout rate was 6%, slightly above the state's average. Students came from diverse racial backgrounds: 25% of students were Black, 23% Filipino, 22% Hispanic, 22% Asian, 4% White, and <5% other, according to school demographics. The school schedule was organised around 58-minute periods, with a shortened period on Wednesdays. The school provided a Chromebook tablet to each student, which students carried around during the school day.
The teacher. This case study follows episodes in the classroom of Ms. T, a high school biology teacher who taught a regular biology class that was part of the high school's life sciences graduation requirement. Ms. T taught 12 years in the Philippines and 17 years in the United States. A fluent English speaker, Ms. T says that English is her second language, and that she has that in common with more than half of her students. Ms. T majored in chemistry and minored in biology in college, and her teaching credentials were in high school chemistry and biology. Ms. T was also the biology chair at her school, which meant it was her job to find curricula for her and her colleagues. One major challenge she identified in her pre-implementation interview was that both she and the school wanted their curriculum to be more NGSS-aligned and to include more inquiry and classroom technology.
Before participating in the InquirySpace project, Ms. T had not used sensors in her biology classes but had a set of Vernier sensors that she had used in her chemistry classes previously. During her pre-implementation interview, she mentioned that she wanted to do more with sensors in her biology curriculum. Over the summer, Ms. T participated in a week-long summer workshop with 13 other teachers to learn more about the InquirySpace curriculum and technology.
The class. Thirty-five of Ms. T's students participated in the study (N = 35; 17 male, 18 female). Ms. T reported that the students had no prior experience using sensors or data analysis platforms like CODAP or with inquiry-based science. The teacher reported that a number of her students had parents who had been laid off from work and students were staying in foreclosure homes or with foster parents, but many were still eager learners. Students raised their hands during class discussion and responded to ‘cold calls’ from the teacher. They also seemed comfortable with group work; however, the teacher reported that the English language learners were often shy to express themselves in her class. The classroom researchers noted that one-tenth to one-third of the students in the class engaged in behaviour such as side talk, outbursts, inappropriate cell phone use/web browsing, or unexcused absences. Ms. T taught one biology class and five regular chemistry/AP chemistry classes.
There were 16 desks in the centre of the room and 6 lab tables around the perimeter, all of which were required to accommodate the 35 students. The classroom was organised for lab and group work, but as the teacher commented, it wasn't organised ‘for my big classes.’ With one whiteboard in the classroom, students crowded near the front of the room when the teacher needed to present or write something on the board. There were four Dell desktops in the corner of the classroom, which students sometimes used if they forgot their Chromebooks or had technology issues. Classroom observers and researchers often bumped into objects or people while attempting to move around the room.
The student group. The focus group consisted of three boys and one girl. Two identified as Asian and two as Hispanic or Latino. One was new to the school this semester. Two of the students were in ninth grade; one was in eleventh grade; and one was in twelfth grade. Three scored in the median range for the pre-test and one student scored in the upper quartile; the student who scored highest appeared to be a leader in the group.
Project staff. The first author of this study (Ms. S) and another researcher (Ms. K) were present for the first and second investigations of this study (potato osmosis investigations). In addition, the project curriculum developer (Mr. R) observed during the week of the second investigation that is the focus of this study. Students were familiar with the observers and greeted them as they came into the classroom. The observers primarily focused on collecting field notes and helping with technology issues. At times the observers asked students questions about what they were working on or responded to student questions. During the week when Mr. R was present, he collected field notes and sometimes assisted with full-group discussions.
Data collection, reduction, and analysis
Every class period was videotaped and we gathered field notes to capture class activities. In addition, we collected the focus group's screencasts every day, which captured the graphs generated by the students in real time as their sensors recorded data. We had access to all the data that the students submitted through our online student portal, including student answers to questions and CODAP documents that showed data collection and analysis. We debriefed with the teacher every day after an InquirySpace lesson was taught and took notes of those meetings. In addition, we interviewed the teacher after the implementation to learn her perceptions on inquiry, experimentation, and data collection; and what she noticed and wanted to work on. outlines the timeline of the classroom implementation.
Table 1. Timeline of classroom implementation. The * represents the analysed portion of the case study. Students also took pre/post assessments (1 class day for each).
Our case selection was opportunistic. One group in the class fully consented to the video study. In total, 65 screencast videos capturing the computer screen of the focus group, the portion of whole class videos that contextualised the videos of the focus group, and the associated field notes were imported into Transana qualitative analysis software and reviewed. We then reviewed student artefacts and 40 additional field note documents. The student artefacts collected included lab notebooks and CODAP documents, which included tables and graphs.
Table 2. Instances of students asking questions about the data and how adults scaffolded student questions.
During review, we identified five whole class videos that showed the teacher scaffolding the whole class in working with data and five screencast videos that involved the focus group working with unexpected data collected from a pressure sensor. For further in-depth analysis, we selected the first two screencast videos in which the students were collecting data from the pressure sensor so that we could better understand how they asked questions about their graphs and how Ms. T and the observers responded in the moment. A researcher on the team transcribed the screencast videos verbatim and the first author reviewed the videos and transcription to improve accuracy. The first author and the researcher annotated the transcripts from the field notes. The goal at this stage was to identify (1) moments that involved a high degree of experimentation and engagement with the sensors and students’ interpretation of the graph inscriptions they saw on the computer screen and (2) what Ms. T and observers noticed and the corresponding actions taken.
We looked in the screencast videos for graphical representations of student data to help us understand how students interpreted them. This included real-time data collection in SensorConnector, as well as CODAP graphs that the students created later. During this stage, scaling issues were identified as an important theme. In some screencasts, the real-time data appeared as straight lines in SensorConnector because the change being recorded appeared too small in the default graph display. The second round of qualitative analysis also incorporated field notes as the author sought to understand how this issue manifested itself in this setting and what the teacher and classroom researchers noticed in these interactions.
The episodes of interest occurred when students were constructing the experiment, debating next steps, seeking help, engaging with the data, and engaging with classmates or their teachers. These segments generally took place during small group sessions, but there were moments where this happened in whole class discussions. During this stage of analysis, the research team met often and shared representative episodes as a check on the validity of our interpretations. We sought to understand students’ purposes within episodes to identify the challenges that appeared to be affecting them. We examined patterns across episodes, used analytical memos to describe each of these moments, and frequently consulted with other project researchers as a check on the validity of our interpretations.
Results
Day 1: orientation of phenomenon through class discussion and teacher demonstration
On Day 1, the teacher introduced the concept of osmotic pressure, but the question of how to measure the phenomenon in the upcoming sensor-based investigations was not discussed. Rather, the focus was on reviewing the vocabulary of osmosis and diffusion and making sure the students understood it.
Day 2: the appearance of the scaling issue
On Day 2, Mr. R, the curriculum developer, briefly introduced how to create a setup using the materials for experimentation: ‘You are going to test to see how water will move into cells or out of cells in a potato. So, here's a potato, right? This potato is made of cells.’ He then said that students would need to bore a hole into the potato ‘so that the hole has cells all around it’ and fill the hole with deionized water. Mr. R then demonstrated how to put a seal on the pressure sensor, connect it to the computer, set the duration of the trial to 10 min, then press ‘Run.’ The directions were intentionally under-specified in order to elicit student questions and ideas about the experimental design. One student asked how much water to add to the potato. Ms. T responded ‘more or less; you figure it out’ in line with the unit goal of getting students to agree on an experimental procedure after a trial run. After that exchange, the students came to the front of the classroom to collect their materials and then began setting up the experiment. The teacher and observers walked around the classroom to ensure that students’ equipment and sensors were working properly and help with student questions.
The students in the focus group worked with a member of the research team, Ms. K, to make sure that the pressure seal was on the potato correctly. At this point, the students were concerned about how full the hole in the potato should be with deionized water. After Ms. K assured the group that their setup was fine, the students collected data. The teacher, Ms. T, reminded the class to set the sensors to run for 10 min. Mr. R walked by the group and the students asked Mr. R and Ms. K whether the sensor was collecting data or not. Mr. R confirmed that the sensor was collecting data and walked away. The students asked Ms. K whether they needed to enter data manually or if the sensor worked on its own. Ms. K noted that the sensor was collecting data automatically.
Four minutes into the experiment, students indicated that they perceived the data as a ‘straight line,’ but they had questions:
Why is ours just flat? [See .]
Well, it's a 10-minute experiment. Why do you think it's flat?
Do you guys know what it's measuring?
Pressure inside.
What? Pressure?
Well, it’s measuring the pressure inside.
Oh, it gives you – go back and change it.
(Ms. S and S1 work on S1's computer to troubleshoot.)
Was this supposed to be a straight line?
Figure 2. A representative graph showing what students saw when they were collecting data on the first day about 45 s after data collection started.
Note: This is a recreation.
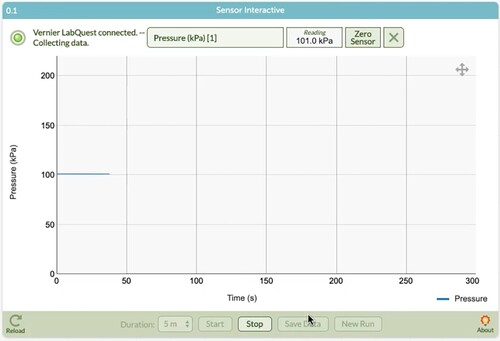
The data display in shows what students and observers saw 45 s into the first data collection run of this investigation. These students reacted to their graphical display with some concern – they seemed to think that they had made a mistake but did not know what to do about it. In the end, they saved their data in CODAP in a tabular form. They wrote in their lab notebooks that they ‘waited too long to collect the data’ as a possible problem in the trial run.
For each experimental condition, with varying salt concentrations used in the well of the potato, the pressure change was very small when compared to pressures typically measured by this type of sensor. Typical pressure changes over the period of a trial run ranged between 0–2 kPA, while the default scaling on the graph for the typical range of this sensor was 0–400 kPA. From a student's perspective, the 5-to-10-minute wait during data collection and the nearly imperceptible change in pressure (at the default scaling) made it appear as though nothing was happening. Students viewed the sensor readings in a tabular format and noticed minor variations of one-tenth of a kPA. However, they were unaware that the fluctuations sometimes fell below the display's resolution. They were not aware that changing the y-axis scale (i.e. minimum and maximum values) would have given them a different perspective on their data.
Day 3: class discussion on refining the experimental setup
The next day, Ms. T rescaled the focus group's graph prior to the class period and projected it to the class for sharing:
Can we share our – what procedures did we use so that we have the data? Can you share the procedure that you think actually works?
Umm, I don't think it was our group that shared data. None of these look like our –
In all of these, I have made it bigger.
Oh.
Figure 3. The teacher rescaled the data to show the correct scale, but the students did not seem to recognise their data when it was projected on the board.
Note: The graph was recreated by the authors from the same student data table and scaled to match the image from classroom video.
The teacher encouraged the class to carry out a revised experimental procedure, with each run lasting five minutes. The students then returned to their respective groups to collect another trial run, following the agreed-upon procedure. About 10 s into their new trial run, the focus group tried again to determine if their seal was good and if they were collecting data. The following exchange occurred:
Are we supposed to make a line or something?
Restart?
It’s going.
It's just straight. Is this (inaudible)?
Whoa, what I am doing, what (inaudible)?
(Rather than clicking ‘Stop,’ the student, apparently flustered, clicked the ‘disconnect sensor’ button.)
Oh, sh –.
(sound of laughing)
I’ll have to restart it.
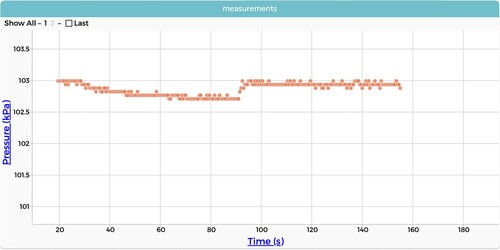
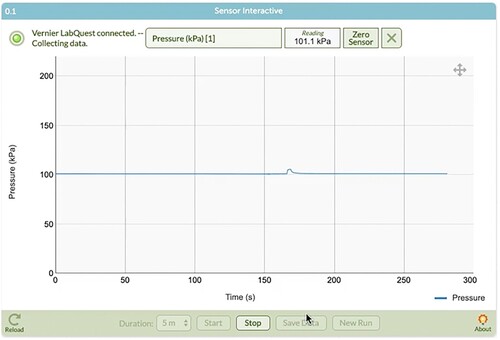
The author then proceeded to change the duration of the run from 10 min to 5 min, and then started a new run for the students. After this exchange, students waited for the run to complete. They made off-topic comments about grades and other schools they attended. About halfway into the trial run, the author asked about their graph ():
Can I see your data?
Yeah.
Is it supposed to look like that on the screen?
Oh, yeah, that’s because – that’s where I touched it.
Oh, interesting! OK.
Figure 4. The graph that the students produced when they seem to have accidentally rescaled the data before the first author approached the group. The graph oscillates, jumping between two values that represent miniscule changes in pressure, because the sensor is approaching its resolution limit.
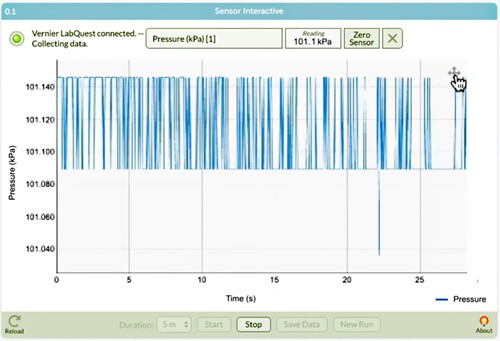
Figure 5. What was on screen on Day 2 when the researcher/first author approached the group. Note the small ‘bump’ at approximately 160 s.
The question of the straight line continued to come up for this group of students even after a whole class discussion and a second chance to work on the data collection run. They collected another set of data before the class period ended, but did not voice questions about it. At the end of class, they returned their pressure sensors with minimal discussion about the investigation. The graph continued to appear as a straight line in the onscreen data representation and the students continued to express confusion about this by the end of Day 3.
Day 4 and on: working beyond the data collection runs
Ms. T asked students to draw a picture of what they thought was going on with the water from the salt solution as it moves via osmosis between the well and the cells of the potato. In the caption, one student wrote: ‘The water molecules move from a higher concentration to a lower concentration, meaning the concentration inside the cell is higher than the concentration inside [the well] (20% or 5% NaCl), so the water moves out of the cell.’ This indicates some level of understanding of the phenomenon that there is a higher ratio of water to salt inside the cell (i.e., higher concentration of water) compared to the solution in the well bored into the potato. The small groups spent one more day collecting data, this time with each group trying different initial concentrations of saltwater solutions.
After completion of the data collection runs with three different concentrations, students continued to work with the teacher to better understand osmosis and diffusion for two weeks after this investigation. One week included InquirySpace curriculum with two simulations, including a pressure change simulation with graphs. They discussed what causes pressure changes and why NaCl will not cross a cell membrane. A second week was devoted to osmosis vocabulary, which was not part of the InquirySpace curriculum and was not videorecorded or observed.
Twelve days after the start of the InquirySpace investigations under study, the groups of students produced video lab reports to explain their findings from the pressure sensor and other investigations. By this time, the scaling issue appears to have been resolved for the focus group. In their report, they discussed their earlier misconceptions:
Our first attempt was challenging. We thought we had messed up because on our graph the line was just straight, but later on when we zoomed in, it didn't look straight. Also, we waited too long to connect the sensor to the potato after putting the water in.
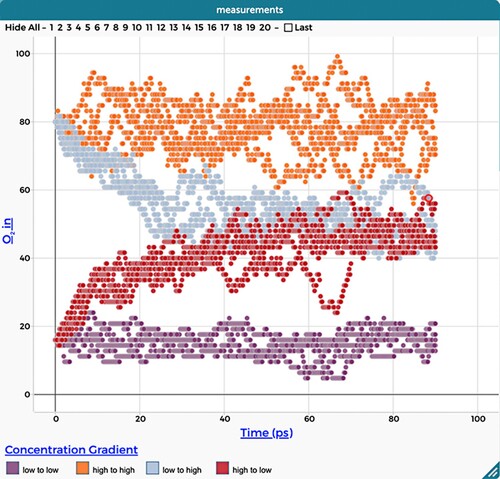
Figure 6. The graphs that the students produced with a simulation that explores diffusion across a cellular membrane.
Because this issue was missed by four experienced educators in the room and only recognised in retrospect, it is worth reflecting on how the educators interpreted and responded to the issue at the time, its impact on the small group exploration, and the potential insights that could be gained from re-examining it through the lens of the mangle of practice.
Findings and discussion
Finding 1: scaling issues manifested in the form of student dissatisfaction with their graphed data when the collected data approached the sensor's resolution
Our case study reveals that students encountered two types of scaling issues when working with graphs. The first type occurred when the graphs were zoomed out too far (), causing the curves to compress and obscure trends in the data. This made it difficult to discern the subtle pressure changes, as the graph appeared to be a straight line. The second type of scaling issue occurred when the graph was zoomed in too close (), resulting in chaotic data that was difficult to interpret. We provide a detailed description of each scaling issue and how students expressed their dissatisfaction with them.
When students encountered graphical representations that were zoomed out too far, the students did not ask about scale, per se. This is not surprising since they did not know what they did not know. Instead, they asked about the graphical patterns they saw, with questions such as ‘Is this supposed to be a straight line?’ and ‘Are we supposed to make a line or something?’ These questions were about the graphs and stemmed from the default scale of the graph and the overall small changes in pressure observed in the experiment. However, we can look beyond this to see that students’ conceptual difficulties were ultimately produced by the fact that the sensors did not appear to them to yield information about a change they felt should be occurring. They could not see any change in pressure and were unsure why. Similar to the experience of experimental scientists, these students questioned whether something was wrong with their instruments, their experimental design, or their interpretation of the results.
The second type of scaling issue involved zooming in too close on the data, which made it difficult for students to interpret the graph. They observed spikes in the graph, which result from the sensor readings oscillating between two values near the sensor's resolution limit. This happened when the pressure change was very small. Over the course of several days, they witnessed the numerical values for the pressure (at the top of the SensorConnector window) fluctuate rapidly in real time, further complicating their understanding of the collected data. As a consequence, the students struggled to make sense of their own sensor data on pressure change caused by osmosis at the cellular level. The functioning of their measuring tools impacted how the students perceived their data. Even though they were not successful at either point in creating alignments between their observations and their conceptions about what they should be seeing, it seems clear they were attempting this, and, unbeknownst to them, engaging in the mangle of practice in a sustained fashion.
The students were trying to comprehend the graphs with misleading scale by connecting the phenomenon back to the graph or the graph back to the phenomenon. Their question, ‘Is this supposed to be a straight line?,’ is consistent with Leinhardt et al's (Citation1990) observation that after rescaling, the ‘picture’ of a graph can look quite different, and with the finding of Ben-Zvi's case study (Citation2004) that questions students have about the overall shape of the graph could be an indication that students are trying to make sense of larger trends in the graph for summarising the data and connecting it with the phenomenon. When students saw their rescaled graph in CODAP projected on the whiteboard, they did not recognise the data as their own. Simply having someone else rescale their data, and tell them they had done so, was not helpful enough. The problem was not with the act of rescaling itself, but rather with the understanding that real-world data often requires rescaling and the ability to do so effectively. In other words, the students lacked the knowledge and awareness necessary to understand that they needed to rescale and to figure out how to do so.
Finding 2: the teacher and observers interpreted these manifestations in the moment as procedural issues, and their attempts at in-the-moment scaffolding focused primarily on experimental procedure
The depth of the perceptual and interpretation issues that arose for the students related to scaling were not initially recognised as such. At the point when the graphs were zoomed out too far, the teacher and observers had several objectives in mind. They were focused on ensuring the equipment was functioning, encouraging reflective thinking, directing attention to the experimental procedure, and troubleshooting technical issues (). One potentially powerful teaching move they used was the reflective toss (Van Zee & Minstrell, Citation1997) where they asked questions such as, ‘Do you guys know what it's measuring?’ in order to foster reflective discourse within the group. Despite these efforts to encourage reflective thinking, and the valuable insights generated from these questions, the depth of perceptual and interpretation issues related to scaling went unrecognised at that time, leaving these students without the necessary guidance to manipulate the data representations and develop a more accurate understanding. Consequently, their primary concern remained whether they had set up the experiment correctly, rather than exploring their understanding of the data representation.
When the graphs were zoomed in too closely, the educators’ primary focus was on addressing technological issues, inadvertently leaving the students with a lack of comprehension regarding the spikes shown in . As a result, the students remained confused despite the educators’ reassurances during class discussions that their data looked good. Unfortunately, this reassurance failed to bridge the gap between the students’ understanding of the graph, seen at a misleading scale, and their perception of what was happening in their experiment. The scaling and resolution problems were never explicitly addressed, and the students continued to have uncertainty and doubts about the accuracy of their experimental setup.
In line with Jazby et al.'s (Citation2023) observations regarding the time pressures faced by teachers when attempting to notice students’ thought processes during lessons, this study's findings further support the notion that enhancing teachers’ capacity to effectively attend to and make sense of significant classroom occurrences is crucial for gaining insight into student difficulties. In turn, this reinforces our awareness of the pivotal role teachers play in recognising and addressing student challenges, while also shedding light on the challenges imposed by time constraints in the classroom. In the specific context of this study, it is evident that creating opportunities for teachers to notice and address these scaling issues and other challenges is vital for optimising student learning experiences. When experiments are opened up for students to exert more of the design decisions, it may not be possible to anticipate the results. This can lead to a greater diversity of results, and issues of scale and limitations of the sensor resolution should be something that teachers are prepared to support when students have questions about their results.
In summary, despite the educators’ reassurances regarding the quality of the students’ data during class discussions, their questions about the straight line in the graphed data were not adequately addressed at the time. This lack of alignment between their understanding and the actual events in the experiment persisted, leaving the students with uncertainty regarding their findings. We suggest the students could have benefited from more explicit support to understand the measurement process, to make connections between the range of measurements the sensors were designed for (0–400 kPA), and the range of measurements being made (0–2 kPA). We hypothesise that their later work with a simulation of pressure change (which included a properly scaled graph of data and was conducted after their hands-on work with sensors but before their screencast assignment) helped them understand the relationship and may have helped resolve their graphing questions.
The teacher and observers underestimated the difficulty of linking the data back to the phenomenon in this situation. The students struggled to understand what was happening in the experiment at the cellular level, and the ‘straight line’ that students saw confused them because a finding of ‘no change’ was not in alignment with their conceptions. Rather than recognising and framing this lack of alignment and the struggle to resolve it as an important part of the scientific process, it functioned to reduce chances for these students to act independently and autonomously in their data production and analysis.
In addition to issues related to graph scaling, material resistance from sensors continued to pose a challenge in subsequent implementations in the biology classes of this teacher and others. To address this issue, a new InquirySpace curricular unit was created with activities to help students better understand the available sensors and their limitations. These activities include teacher-led discussions on the equipment's limitations, an optional exercise focusing on exploring sensors and their measurement techniques, and guidance on rescaling graphs for obtaining more precise real-time data representation. These were designed to provide students with opportunities to think about and rescale their graphs while collecting data and to have productive conversations about the osmosis phenomenon and its relationship to the changes in pressure data. The revised curriculum is available and being used in classrooms.
Implications for teaching and future research
Overall, this case study highlights the importance of supporting students to understand material resistances they are likely to face when using modern sensor technologies to carry out preliminary investigations. It emphasises that teachers must be mindful of these challenges and provide support to their students as they engage in data-rich investigations, particularly in light of the NGSS and recent advancements in affordable sensor technologies. The use of inquiry-based teaching methods in classrooms can make data collection and graphing more challenging. This is due to the fact that students often design their own experiments, which can lead to significant variations in how they use sensors. To address this issue, it is important to reframe sensor and data graphing difficulties as opportunities for students to align their conceptual understanding with their experimental results and to empower students to realise they are engaging in valid scientific practices. This can help position them as data producers (Hardy et al., Citation2020).
In light of the increasing availability and usefulness of sensors for NGSS, we see the following implications arising from this study.
Engaging in more activities exploring sensor capabilities could help students understand the mangle of practice. Teachers could incorporate classroom activities where the primary goal is to discuss the measurement range of the sensor, what it can measure, and how to handle unexpected behaviour. By actively exploring the sensor's capabilities and limitations, students may gain a better understanding of how to effectively use the technology in their experiments. Manz et al. (Citation2020) argue that if teachers do not support students in making sense of uncertainties inherent in measurement, then teachers will be left with the task of ensuring that students’ explanations fit the model that the teacher or curriculum developers were trying to create. Incorporating activities that encourage students to grapple with these uncertainties can empower them to develop a more robust understanding of the scientific concepts and the role of measurements in supporting their claims (Manz et al., Citation2020).
These kinds of activities often require the teacher to embrace the unexpected more than usual and to be prepared to answer student questions in depth. These episodes highlight the importance of empowering teachers to establish supportive classroom structures that facilitate addressing student questions within an inquiry-based learning environment (Jazby et al., Citation2023). This shift in approach means helping students anticipate potential sources of issues in their data, and support them in articulating how they think their data should look.
We suggest an increased focus on analysing computer-generated graphs and other representations of student-produced data. Pols et al. (Citation2021) suggest that high school students face difficulties in understanding various graph features, such as labelling axes or identifying trend lines, when working with computer-generated graphs. Teachers can enhance students’ understanding of data representation by questioning them about the graphs and other data visualisations they create. When a student asks, ‘Should this be a straight line?,’ a teacher could respond by prompting students to consider their expectations, potential sources of noise, and the appearance of small changes in their data. The objective is to encourage students to think critically about their experimental results and to foster deeper engagement with the scientific process. This approach aligns with the perspective of Ben-Zvi (Citation2004), who emphasises that teachers can support student understanding by fostering an environment that encourages students to interpret and derive meaning from the graphs they generate, rather than simply providing directives.
In the context of high school biology, educators may face distinct challenges using sensor technologies compared to physics, for instance, because biology labs often deal with data that approach the limits of the sensors available in schools. When sensor use spreads to more realms of science instruction such as biology, there are new challenges for teachers in noticing the discrepancies between students’ expectations and actual outcomes.
Limitations and recommendations for future research. This case study is of a single group of high school biology students working to make sense of the data they collected with one sensor in a particular investigation. Other students may interact with sensors and software for collecting and analysing data differently. Similarly, we recognise that the specifics of the teacher and classroom setting play a role in students’ experiences working with the data they collect.
Future research could further investigate the difficulties that teachers face while guiding students in data-oriented inquiry as sensor use moves increasingly into other areas of high school biology. The objective would be to identify pedagogical scaffolds appropriate to the new kinds of investigations suitable for those areas, as well as identifying the kinds of material resistance students will likely encounter so that those encounters can be reframed as valid science practice.
Conclusion
A major premise we are working from is that data collection with sensors has the potential to enhance inquiry-based learning activities in the classroom, provided appropriate scaffolding is in place. An unanticipated finding in our study was the crucial role of material resistance when working with sensors in investigations that challenge the sensor's measurement capabilities. Students struggled with the graphs they produced from sensor readings and they grappled with understanding whether they were producing data at all. Furthermore, scaling was a significant challenge in this classroom, as evidenced by the example in this case study. It was surprising to realise that even the adults in the room, including the first author, were unable to recognise the scaling issue in the midst of all the classroom activity. We suggest that although grappling with material resistance can be a source of frustration for students, it can also present opportunities to discuss aspects of measurement in general. We see value in placing material resistance within the context of valid scientific inquiry, as recommended by Manz (Citation2015).
As the popularity of inquiry-based teaching and learning and the adoption of NGSS continues to grow, it is imperative for educators to leverage both new points about NGSS and advancements in technology to enhance teaching practices. In this context, it is crucial for teachers and students alike to acknowledge the limitations of sensors, particularly when it comes to interpreting the graphed data they generate. By developing a deeper understanding of material resistance and its implications for inquiry-based learning, teachers and students can harness the full potential of sensors in the classroom.
Ethics statement
This study was approved by the Ethical & Independent Review Services (E&I Assigned Study ID: 19106-01) on July 19, 2019, date of check-in July 18, 2021. All participants provided written consent prior to participating. Written informed consent to participate in this study was provided by minor participants’ legal guardian/next of kin. Identifying information, such as names and places, have been anonymised to ensure participant safety and privacy.
Acknowledgements
Any opinions, findings, and conclusions or recommendations expressed in this material are those of the author(s) and do not necessarily reflect the views of the National Science Foundation. The authors would like to acknowledge Dan Damelin, Sarah Haavind, Steve Roderick, Linda Cohen, George Jennings, and Cynthia McIntyre for their input.
Disclosure statement
No potential conflict of interest was reported by the author(s).
Additional information
Funding
References
- Bell, R. L., Smetana, L., & Binns, I. (2005). Simplifying inquiry instruction. The Science Teacher, 72(7), 30–33.
- Ben-Zvi, D. (2004). Reasoning about data analysis. In D. Ben-Zvi & J. Garfield (Eds.), The challenge of developing statistical literacy, reasoning and thinking (pp. 121–145). Kluwer Academic Publishers. http://link.springer.com/10.10071-4020-2278-6
- Bernhard, J. (2018). What matters for students’ learning in the laboratory? Do not neglect the role of experimental equipment! Instructional Science, 46(6), 819–846. https://doi.org/10.1007/s11251-018-9469-x
- Chan, K. K. H., Xu, L., Cooper, R., Berry, A., & van Driel, J. H. (2021). Teacher noticing in science education: Do you see what I see? Studies in Science Education, 57(1), 1–44. https://doi.org/10.1080/03057267.2020.1755803
- Clement, J. (1989). The concept of variation and misconceptions in Cartesian graphing. Focus on Learning Problems in Mathematics, 11(12), 77–87.
- Cooper, V. A., Forino, G., Kanjanabootra, S., & von Meding, J. (2020). Leveraging the community of inquiry framework to support web-based simulations in disaster studies. The Internet and Higher Education, 47, Article 100757. https://doi.org/10.1016/j.iheduc.2020.100757
- Donnelly-Hermosillo, D. F., Gerard, L. F., & Linn, M. C. (2020). Impact of graph technologies in K-12 science and mathematics education. Computers & Education, 146, Article 103748. https://doi.org/10.1016/j.compedu.2019.103748
- Finzer, W. (2014). Common online data analysis platform (CODAP). https://codap.concord.org/
- Gericke, N., Högström, P., & Wallin, J. (2023). A systematic review of research on laboratory work in secondary school. Studies in Science Education, 59(2), 245–285. https://doi.org/10.1080/03057267.2022.2090125
- Getting to Know Your Pressure Sensor. (2022). Activity: Getting to know your pressure sensor – IS2 biology. http://short.concord.org/lub
- Hardy, L., Dixon, C., & Hsi, S. (2020). From data collectors to data producers: Shifting students’ relationship to data. Journal of the Learning Sciences, 29(1), 104–126. https://doi.org/10.1080/10508406.2019.1678164
- Jazby, D., Widjaja, W., Xu, L., & van Driel, J. H. (2023). Noticing student thinking under pressure in primary mathematics and science lessons. International Journal of Science and Mathematics Education, 21(2), 645–666. https://doi.org/10.1007/s10763-022-10263-9
- Lai, K., Cabrera, J., Vitale, J. M., Madhok, J., Tinker, R., & Linn, M. C. (2016). Measuring graph comprehension, critique, and construction in science. Journal of Science Education and Technology, 25(4), 665–681. https://doi.org/10.1007/s10956-016-9621-9
- Lee, V. R., & Wilkerson, M. H. (2018). Data use by middle and secondary students in the digital age: A status report and future prospects. Commissioned Paper for the National Academies of Sciences, Engineering, and Medicine, Board on Science Education, Committee on Science Investigations and Engineering Design for Grades 6-12, 43.
- Lee, V. R., Wilkerson, M. H., & Lanouette, K. (2021). A call for a humanistic stance toward K–12 data science education. Educational Researcher, 50(9), 664–672. https://doi.org/10.3102/0013189X211048810
- Lehtinen, A., & Viiri, J. (2017). Guidance provided by teacher and simulation for inquiry-based learning: A case study. Journal of Science Education and Technology, 26(2), 193–206. https://doi.org/10.1007/s10956-016-9672-y
- Leinhardt, G., Zaslavsky, O., & Stein, M. K. (1990). Functions, graphs, and graphing: Tasks, learning, and teaching. Review of Educational Research, 60(1), 1–64. https://doi.org/10.3102/00346543060001001
- Manz, E. (2015). Resistance and the development of scientific practice: Designing the mangle into science instruction. Cognition and Instruction, 33(2), 89–124. https://doi.org/10.1080/07370008.2014.1000490
- Manz, E., Lehrer, R., & Schauble, L. (2020). Rethinking the classroom science investigation. Journal of Research in Science Teaching, 57(7), 1148–1174. https://doi.org/10.1002/tea.21625
- McDermott, L. C., Rosenquist, M. L., & van Zee, E. H. (1987). Student difficulties in connecting graphs and physics: Examples from kinematics. American Journal of Physics, 55(6), 503–513. https://doi.org/10.1119/1.15104
- Metcalf, S. J., & Tinker, R. F. (2004). Probeware and handhelds in elementary and middle school science. Journal of Science Education and Technology, 13(1), 43–49. https://doi.org/10.1023/B:JOST.0000019637.22473.02
- Millar, M. (2005). Technology in the lab part I: What research says about using probeware in the science classroom. The Science Teacher, 72(7), 34–37.
- Mokros, J. R., & Tinker, R. F. (1987). The impact of microcomputer-based labs on children’s ability to interpret graphs. Journal of Research in Science Teaching, 24(4), 369–383. https://doi.org/10.1002/tea.3660240408
- National Research Council. (2000). Inquiry and the national science education standards: A guide for teaching and learning (S. Olson & S. Loucks-Horsley, Eds.; p. 9596). National Academies Press. https://doi.org/10.17226/9596
- NGSS Lead States. (2013). The next generation science standards: For states, by states. National Academies Press.
- Pedaste, M., Mäeots, M., Siiman, L. A., de Jong, T., van Riesen, S. A. N., Kamp, E. T., Manoli, C. C., Zacharia, Z. C., & Tsourlidaki, E. (2015). Phases of inquiry-based learning: Definitions and the inquiry cycle. Educational Research Review, 14, 47–61. https://doi.org/10.1016/j.edurev.2015.02.003
- Pickering, A. (1995). The mangle of practice: Time, agency, and science. University of Chicago Press.
- Pols, C. F. J., Dekkers, P. J. J. M., & De Vries, M. J. (2021). What do they know? Investigating students’ ability to analyse experimental data in secondary physics education. International Journal of Science Education, 43(2), 274–297. https://doi.org/10.1080/09500693.2020.1865588
- Price, E. (2017). The use of probeware to improve learning outcomes in middle school science: A Mixed Methods Case Study [Gwynedd Mercy University]. https://www.proquest.com/docview/1952261937
- Smith, S. M. (2019). 2018 NSSME+: Status of high school chemistry. Horizon Research, Inc.
- St. Clair, N., & Stephens, A. L. (2022, June 3). Using data stories to motivate student exploration of science phenomena. International Conference of the Learning Sciences, Hiroshima, Japan.
- Thornton, R., & Sokoloff, D. (1990). Learning motion concepts using real-time microcomputer-based laboratory tools. American Journal of Physics, 58(9), 858–867. https://doi.org/10.1119/1.16350
- Tinker, R. (2002). A history of probeware. The Concord Consortium. https://concord.org/wp-content/uploads/2016/12/pdf/probeware_history.pdf
- Van Zee, E., & Minstrell, J. (1997). Using questioning to guide student thinking. Journal of the Learning Sciences, 6(2), 227–269. https://doi.org/10.1207/s15327809jls0602_3
- Wu, H.-K., & Krajcik, J. (2006). Inscriptional practices in two inquiry-based classrooms: A case study of seventh graders’ use of data tables and graphs. Journal of Research in Science Teaching, 43(1), 63–95. https://doi.org/10.1002/tea.20092
- Yin, R. (2018). Case study research and applications: Design and methods (6th ed.). Sage.
- Zucker, A. A., Tinker, R., Staudt, C., Mansfield, A., & Metcalf, S. (2008). Learning science in grades 3–8 using probeware and computers: Findings from the TEEMSS II project. Journal of Science Education and Technology, 17(1), 42–48. https://doi.org/10.1007/s10956-007-9086-y