
 ?Mathematical formulae have been encoded as MathML and are displayed in this HTML version using MathJax in order to improve their display. Uncheck the box to turn MathJax off. This feature requires Javascript. Click on a formula to zoom.
ABSTRACT
A methodology of optimising composite frame structures has been applied to three selected geometries. A cyclic process driven by predefined objectives achieved the most desirable parameters through adjustments in winding angles and tube ply thicknesses. A geometry resembling a crane structure underwent initial analyses, allowing for the determination of appropriate settings for the surrogate model’s training phase, considering accuracy and computational time. Its final design was influenced by prevalent bending and tension loads, resulting in near-zero winding angles and a range of thicknesses that met displacement, strength, and weight requirements. A second geometry with further restrictions was also considered. Finally, for a third geometry, winding angles were tailored to accommodate torsion forces. The presented optimisation process resulted in volume reduction while maintaining displacement and strength parameters. These findings highlight the effectiveness and transferability of the optimisation approach across different geometries.
1. Introduction
Filament winding technology involves the precise placement of continuous filaments onto a rotating mandrel, resulting in the creation of lightweight and high-strength structures [Citation1]. Composite frame structures have gained significant usage on account of their numerous benefits. These structures offer advantages such as exceptional strength-to-weight ratios, allowing for the creation of lightweight designs without compromising structural integrity. This reduction in weight leads to improved energy efficiency and overall performance. However, it is important to consider the specific rules and considerations associated with composite frame structures to ensure their successful implementation [Citation2].
Designing composite structures often involves the utilisation of solid mechanics-based equations and finite element (FE) simulations to gain valuable insights into the mechanical behaviour and other important properties of composite materials within the structure. Functional design of composite structures requires addressing multiple criteria, including critical stress, strain, stiffness, and failure considerations, which are incorporated into equations to predict component behaviour. Depending on the design objectives and complexity, materials mechanics-based equations and FE strategies may vary, allowing tailoring the design process to the specific requirements of the problem in hand [Citation3].
In addition to mechanistic equations and related FE simulations, the concept of optimisation specifically multiple-criteria optimisation plays a very significant role in the design of composite structures. Multiple criteria optimisation techniques enable exploration of a wide range of design possibilities while simultaneously considering various functional requirements, such as critical strength, deformation, and stiffness. An effective conservative design principle should select the safest solution that satisfies all the necessary criteria, and which can then be efficiently implemented through a multi-objective optimisation approach. This strategy allows implementation of a balanced design that satisfies all criteria, ensuring the safest and most efficient configuration. By varying design parameters such as fibre orientations, laminate layup, and thicknesses, desired targets, such as weight reduction, increased stiffness, or improved fatigue resistance, can be achieved, while ensuring that critical criteria are met [Citation4].
Gradient-based multi-objective algorithms are available and are used in many real-life scenario [Citation5]. In the present situation it would be hugely cumbersome to apply these algorithms, as a gradient computation of the immensely complex system equations used in this study would be very difficult, if not practically impossible, to implement and computationally very expensive. Furthermore, gradient-based methods usually compute just one optimum solution at a time and after computing a handful of them, with the help of a Decision Maker (DM) they attempt further improvements. Here we wish to explore the total spread of the optimum Pareto front that would be much easier using a non-calculus data-driven procedure. Data-driven models based upon evolutionary algorithms are increasingly being employed in the optimisation of composite structures [Citation6,Citation7]. These models utilise large datasets and advanced algorithms to analyse and evaluate the design alternatives. Data-driven approaches provide a comprehensive understanding of the complex interactions between the design variables and the related performance objectives. They allow efficient exploration of the design space, resulting in optimised composite structures that meet specific requirements [Citation4].
One such data-driven optimisation algorithm used in this study is the Evolutionary Deep Neural Net algorithm (EvoDN2). EvoDN2 employs an evolutionary bi-objective optimisation approach, inspired by natural selection and genetic algorithms. It iteratively evolves and refines the design solutions based on specified objectives and constraints. By simulating evolutionary processes, EvoDN2 enables the identification of superior design configurations, leading to enhanced important properties and efficiency of composite frame structures [Citation8].
In this article, a method is presented for designing filament-wound composite frame structures. Details of the classical lamination theory, which forms the foundation for determining stiffness, strength and other mechanical properties of composite structures, will be described. Furthermore, the principles and application of beam theory related to the design process will be discussed.
The optimisation principles utilised, the preparation of data for training the optimisation model, and the specific settings and parameters involved in the optimisation process will be elaborated in the following sections. Additionally, the results obtained from the application of the proposed method in designing specific geometries will be presented, showcasing the benefits and improvements achieved through the presented approach.
2. Structure of the paper
This paper is organized in three main sections: Methods, Results and Discussion, followed by the Summary and Conclusion.
In the Methods section we will focus on (i) the equivalent stiffness methodology (ii) beam theory, (iii) explanation of optimisation principles and the algorithm used, and (iv) the cyclic optimisation and its benefits.
In the Results and Discussion section we will present the results obtained when our methodology was applied to some specific geometries and will also compare our results with those presented by other researchers in the same field.
Finally, in the Summary and Conclusion section a comprehensive overview will be provided.
3. Methods
3.1. Equivalent stiffness methodology
In the presented methodology, the theory of minimum complementary energy (described in [Citation9] for example) is employed to calculate the equivalent stiffness. Hooke’s law for orthotropic material is used to determine the ply compliance matrix in the coordinate system of a laminate Ct and combined with geometrical analyses to establish the relevant stiffness. Equations (1–4) below express the equivalent stiffnesses: Equation (1) denotes the equivalent tensile stiffness, Equation (2) represents the equivalent bending stiffness in the z-direction and the equivalent bending stiffness in the y-direction (which are equal for a circular cross-section as used in our case), Equation (3) expresses the equivalent torsional and Equation (4) provides the equivalent shear stiffness.
(1)
(1)
(2)
(2)
(3)
(3)
(4)
(4)
In the equations, the variables ri, rout_i and rin_i represent the mean, outer and inner i-th ply radius, respectively, while ti denotes the i-th ply thickness. Ct_i (r,c) refers to the r-th row, and c-th to the column member of the i-th ply compliance matrix in the coordinate system of the laminate. The values of ci and Ac_i are the i-th ply circumference of the midline and the area inside ci, respectively.
The values of the equivalent stiffnesses are determined by the material properties, ply thickness and orientation, stacking sequence, and cross-section of the tube. By considering these factors, utilisation of Hooke’s law for orthotropic material allows for the calculation of the laminate stiffnesses and the optimisation process for designing filament-wound composite frame structures.
3.2. Beam theory
Beam theory (described in [Citation10] for example) approximates the behaviour of the composite structure by discretizing it into finite elements, each representing a beam or its segment. By applying the principles of mechanics and numerical methods, beam theory enables the calculation of deformations, stresses, and other important parameters. This facilitates evaluation of the objectives and subsequent optimisation of the composite frame structures.
In the current methodology, the 2-node Timoshenko beam element in 3D space was considered. Its stiffness matrix Ke is defined by the Equations (5–8) and depends on the equivalent stiffnesses (Equations 1–4) and length L of the element.
(5)
(5)
(6)
(6)
(7)
(7)
(8)
(8)
The analysed geometry is described by the coordinates of the nodes connected by beam elements. The elements’ local stiffness matrix Ke_loc is used to determine the internal forces Fint (Equation 9) acting on the beam element, obtained through knowledge of the nodes’ displacements u (Equation 10) by utilising relation between the structure global stiffness matrix Kglob and applied external forces Fext (Equation 11).
(9)
(9)
(10)
(10)
(11)
(11) Ply stresses
,
, and
in material coordinates are obtained by utilising estimated internal forces Fint (converted to the tension or compression force N, torque T, and bending moment M) in conjunction with the transformation matrix
(see Equation 12). These ply stresses are used to identify the ply strength coefficient smaxi using maximum stress criterion (Equations 13–16), which was chosen based upon a previous study [Citation4]. The maximum stress criterion enables us to recognize in which direction the failure should occur and at the same time these equations are sufficiently simple and provides adequate accuracy. XT and XC represent the longitudinal tensile and compressive strength, respectively; YT and YC represent the transversal tensile and compressive strength and S is the shear strength of the material. Equations (13–15) define the ply stress coefficients in different directions: the fibre direction (Equation 13), the direction perpendicular to the fibres (Equation 14), and the shear direction (Equation 15). These coefficients are expressed as the ratio of the applied stress to the corresponding material strength. The ply stress coefficient represents the material’s utilisation rate, with the highest value among these coefficients determined as described in Equation (16). When this coefficient equals 1, it indicates that the material has experienced damage. The factor of safety is the reciprocal of this coefficient.
(12)
(12)
(13)
(13)
(14)
(14)
(15)
(15)
(16)
(16) In summary, beam theory, which utilises Hooke’s law for orthotropic material, forms the basis of the methodology employed for analysing composite frame structures. The current methodology enables the calculation of deformations, stresses, and other important parameters necessary for evaluating the objectives and establishes a robust framework for subsequent optimisation processes, which will be detailed in the following sections.
4. Explanation of optimisation principles and EvoDN2 algorithm
In this work, an optimisation approach is employed to design composite frame structures. Optimisation aims to find the optimal design configurations that satisfy predefined objectives and constraints. The specific optimisation algorithm utilised in the presented research is the data-driven evolutionary optimisation algorithm called Evolutionary Deep Neural Network (EvoDN2) algorithm [Citation8], where a learning module employs a data-driven deep neural network that evolves through a bi-objective evolutionary algorithm, and the final convergence is carried out using a Linear Least Square (LLSQ) procedure. It also has an optimisation module that is capable of many-objective optimisation using a constraint-based Reference Vector guided Evolutionary Algorithm (cRVEA) [Citation11]. EvoDN2 employs interconnected subnets to train surrogate models based on input data, optimising the trade-off between accuracy and complexity of the models created. This approach, detailed in references [Citation12,Citation13], allows handling of non-linear and noisy data, making it robust and independent of any direct implementation of the underlying physics of the problem. Following the training phase, the optimal models serve as objectives in a multi-objective optimisation framework. The cRVEA algorithm, integrated into EvoDN2, employs reference vectors to facilitate the population diversity and optimisation convergence, thus overcoming some typical challenges encountered in multi-objective optimisation. By utilising an angle-penalised distance and an adaptive approach, this algorithm provides the flexibility to guide the optimisation task towards specific areas of the Pareto front using a distribution of reference vectors [Citation11].
The usage and application of the EvoDN2 algorithm are discussed in [Citation12] to [Citation14], where a comprehensive elaboration of the algorithm’s implementation, including its specific parameters, evolutionary operators, and convergence criteria is provided in detail. This paper emphasizes the capability and advantages of EvoDN2 in addressing the optimisation challenges encountered in designing filament-wound composite frame structures.
5. Introduction of cyclic optimisation and its benefits
Building upon the application of EvoDN2, the concept of cyclic optimisation will be introduced. Cyclic optimisation allows for iterative refinement of the design solutions through multiple optimisation cycles. Each cycle consists of an optimisation run, where the solutions from the previous cycle serve as starting points for the subsequent runs. This iterative process enables a thorough exploration of the design space and gradually improves the objectives. The utilisation of cyclic optimisation provides the opportunity to further enhance the efficiency and effectiveness of the design process.
To achieve successful training of the optimisation model, it is essential to undertake the necessary data preparation steps and configure the training parameters appropriately to obtain the desired fitting parameter values, which are indicative of well-executed optimisations. The optimisation process carried out on the structures studied in this investigation, needed to include some decision-making rules to select the members for the next run, as well as the specification of end parameters where objectives are not improved between cycles. The developed methods will now be described on chosen geometries.
6. Description of the method applied
In this study, three objectives are optimised and analysed:
F1: Connected to structure stiffness, represented by the displacement of a defined node (usually the node where the load is applied), obtained from Equation (10).
F2: Connected to structure strength, represented by the maximum value (smax) of the ply strength coefficients (smaxi) obtained from Equation (16).
F3: Connected to structure weight and cost, represented by the structure volume derived from the structure geometry and tube thicknesses.
In this study, all three objectives are minimized in a cyclic fashion as we will elaborate further in the subsequent text. The combination of the above-mentioned methods is used to determine objective values for selecting ply thicknesses ti and ply angles αi of the tubes (decision variables for optimisation) and to establish their possible ranges in the 1st cycle. The decision parameter ranges that are selected approximately correspond to the required and physically achievable objective values.
The decision parameter ranges obtained from the initial analysis can be expanded to include a broader range of objectives when a surrogate model is built. During the cyclic optimisation process, the decision parameter ranges are dynamically adjusted based on the results of the previous steps, primarily focusing on thicknesses. The accuracy of the initial structure analyses and the determination of decision parameters are crucial for building an accurate surrogate model.
When choosing the decision variables for the subsequent cycle, a new dataset of decision variables is created, typically resembling the original dataset. The ply angle values αi obtained through optimisation in the previous cycle (i-1) remain constant for the current cycle (i), while the ply thickness (ti) of each ply in the i-th cycle is determined as i/(i – 1)*ti-1, where ti-1 represents the ply thickness from the previous cycle. Consequently, the ply properties achieved from the previous cycle(s), defined by ply thickness and ply angle, are taken into account in the current cycle. This iterative approach allows for the optimisation of the first ply in the initial cycle, the optimisation of the second ply in the 2nd cycle (with the first ply already present in the structure), and so on. Additionally, it facilitates the adjustment of the thickness of individual tubes within the structure and enables the composition to become more diverse.
The iterative process of cyclic optimisation concludes when changing the target functions between individual cycles no longer brings benefits (either there is no improvement in the target functions or there is only a marginal improvement at the expense of adding winding layers of small thickness, which could negatively affect the production technology).
In this study, the optimisation process was applied to three specific composite frame geometries: Geometry A, Geometry B, and Geometry C. These geometries were chosen to represent typical design scenarios encountered in practice. Geometry A can be characterised as a crane structure, Geometry B represents the joint (node 3) of the optimised Geometry A structure, and Geometry C resembles a Gantry-type machine [Citation15], characterised by its horizontal framework that provides crucial stiffness for the machine. The horizontal structure plays a vital role in maintaining stability and precision during machining operations. It supports various components such as the tooling, spindle, and workpiece, ensuring optimal performance and accuracy.
Selected geometries and their specifications are presented in , which provides details such as geometries, boundary conditions, loading, and beam identification.
Table 1. Analysed geometries.
7. Results and discussion
The optimised results for the different configurations studied here are presented and analysed below.
7.1. Geometry A
The initial analyses were conducted and the range of initial thicknesses was determined based on the following requirements: F1 should be up to 1 percent of the length of the boom beam (this value was chosen with respect to the analysed crane structure application), F2 should be less than 0.5 (which expresses a safety factor of 2), and F3 should be minimised (less volume means less mass and structural cost).
Subsequently, a study of the training parameters for Geometry A was carried out. The number of subnets, nodes in subnets, and number of generations were analysed (for more details refer to [Citation4]) to achieve the best surrogate model. The surrogate model should be sufficiently accurate while ensuring a reasonable training time. provides details such as the number of settings, number of subnets (S), number of nodes in subnets (SN), slope value for objectives (F1, F2, F3), and computational time (time). Setting number 5 was chosen for training, striking a balance between computational time and accuracy.
Table 2. Geometry A – settings of training parameters.
During the training of the second layer, it was found that not only the necessary range of proposed layer thicknesses needed to be included but also at least four thickness values (including two boundaries and two values distributed within them) were required in the dataset of design variables.
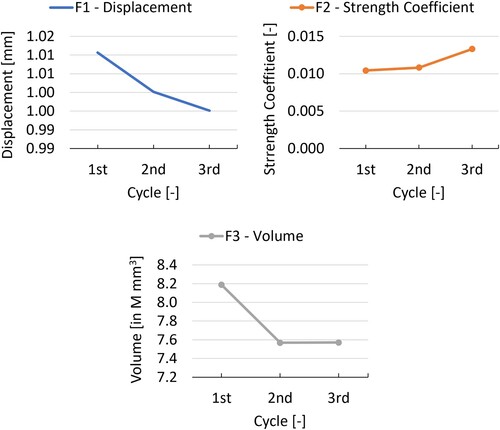
Four cycles were conducted to determine the parameters of the four layers, including ply thicknesses and angles. The optimisation course can be observed in , which displays the objective values in each cycle, and , which shows the total thicknesses of tubes in each cycle. illustrates that objective F1 (displacement) remained relatively stable throughout the optimisation process, while objectives F2 (strength) and F3 (volume) demonstrated a decrease during the cyclic optimisation procedure. Objectives 1 and 2 stayed within the required limits, while objective 3 decreased until the 3rd cycle. Therefore, the final member chosen as the output of the optimisation process, presented in the , emerged from the 3rd cycle. Changes in the total thicknesses of the tubes are shown in , with tubes 1 and 3 thicknesses decreasing, and tube 2 thickness increasing. (left) showcases the final optimised configuration for Geometry A, obtained from the cyclic optimisation process.
Figure 1. Geometry A – Displacement (top left), strength coefficient (top right), and volume (centre bottom) evaluation during optimisation (F1, F2, F3).
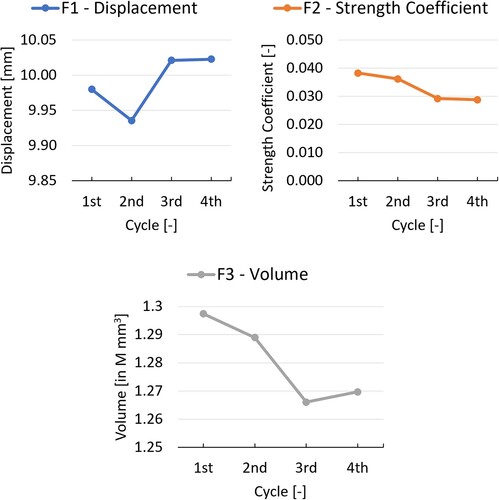
Figure 2. Geometry A – The thicknesses change during the optimisation process.
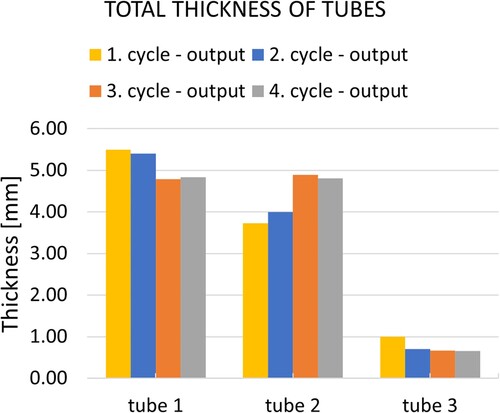
Figure 3. Geometry A – Final optimised geometry (left) and Geometry B – representation of the original geometry (right).
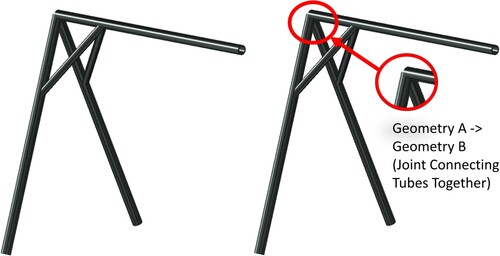
Table 3. Geometry A – Optimised structure parameters.
As a result of the optimisation, both the winding angles and thicknesses of the tube plies for each tube were adjusted to achieve the optimal winding configuration. Considering the type of loading applied in Geometry A (primarily bending, tension, and compression); the winding angle was set to 0°, ensuring optimal performance. The thicknesses of the tubes were iteratively modified, taking into account the objective values, to further enhance the overall structural response. The analysis settings derived from the optimisation process of Geometry A were successfully applied to subsequent geometries.
7.2. Geometry B
Geometry B, shown in (right), serves as a joint structure that builds upon the output of Geometry A. Its purpose is to reinforce the joint, enabling it to withstand the required load while ensuring sufficient strength and stiffness. Additionally, the design must meet the minimum volume requirement.
illustrates the development of the objectives throughout the optimisation process, with the starting point (0) representing the initial state without any added winding (simply the original winding from the results of geometry A is analysed). This starting point is followed by 1st cycle states, where objectives F1 and F2 exhibit a decreasing tendency while objective F3 has increased, as expected owing to the nature of the task. Here we have used specific targets to reduce the volume and maintain the stricter restrictions on strength and stiffness parameters of the joint, depending on the 1st cycle results that were set for the objective values: i.e. F1 should be within 0.002 mm, F2 within 0.001, and F3 within 70,000 mm3. These specific targets were achieved in the 5th cycle, with no further improvements between the 5th and 6th cycle points, as displayed in . Therefore, the optimisation process concluded after the 6th cycle, with the output being the member obtained from the 5th cycle, as shown in . highlights that tube 1 does not require additional reinforcement to meet the required parameters while tube 2 requires reinforcement.
Figure 4. Geometry B – Displacement (top left), strength coefficient (top right), and volume (centre bottom) evaluation during optimisation (F1, F2, F3).
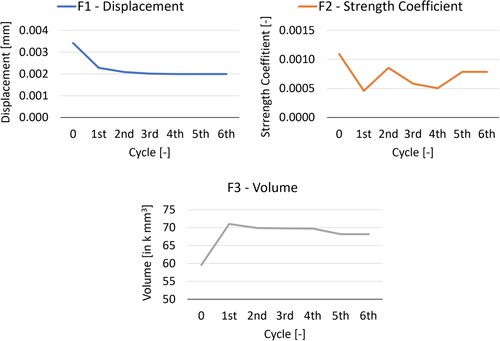
Figure 5. Geometry B –Thicknesses change during the optimisation process.
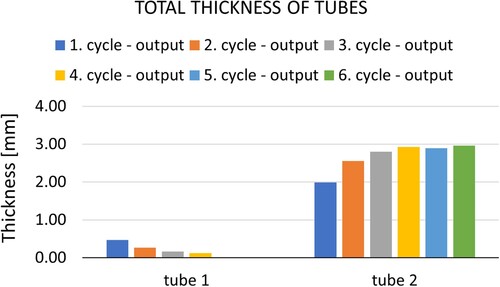
Table 4. Geometry B – Optimised structure parameters.
7.3. Geometry C
Geometry C represents a Gantry-type machining centre [Citation15], where the forces acting at node 2 induce torsion in tube 1. Consequently, the resulting member should have the winding configuration adapted to handle the applied torque. After the 1st cycle of optimisation, the targets for the objectives were established after considering the anticipated use of the analysed structure: F1 should be within 1 mm, F2 should be near 0.01, and F3 should be minimised. depicts the changes in the objectives throughout the optimisation process, revealing that the optimal member can be selected after the 2nd cycle. The choice of the 2nd cycle member is based on a comparison with the 3rd cycle member, indicating that the objectives F2 and F3 for the 3rd cycle member show degradation compared to the results of the 2nd cycle member, as displayed in .
Figure 6. Geometry C – Displacement (top left), strength coefficient (top right), and volume (centre bottom) evaluation during optimisation (F1, F2, F3).
The specific parameters of the optimal member are provided in . Notably, the winding angles of the layers in tube 1 have non-zero values, with one winding around a tenth of a radian and another winding around half a radian.
Table 5. Geometry C – Optimised structure parameters.
8. Comparison with previous research
In a previous study [Citation16], a combination of CLT, Hashin theories, and FE-based methods with machine learning techniques was utilised to determine the optimal stacking sequence and fibre modulus for achieving the desired strength and stiffness values in a cantilever beam. However, this approach employed a single objective GA, which solved the objectives separately and may not effectively control data overfitting.
In our study, we employed a bi-objective Evolutionary Algorithm (EA), which offers better control over data overfitting by striking a trade-off between model accuracy and complexity. It also allows the flexibility of selecting the most suitable model from a Pareto set of optimum models [Citation13]. Additionally, unlike the previous study [Citation16], our approach incorporates deep learning, enabling the identification of small but significant fluctuations in the data, as demonstrated in a recent study [Citation17].
Furthermore, the use of the cRVEA algorithm in our present study enabled the simultaneous optimisation of three objectives, which was not achievable using the single objective GA employed in the previous study [Citation16]. This capability enhances the efficiency and effectiveness of the optimisation process, leading to improved design outcomes.
The topology optimisation on several frame structures was conducted as described in reference [Citation18] regarding fundamental frequency constraints. The stacking sequence was subject to certain limitations imposed by manufacturing constraints. These limitations included the requirement for a symmetrical and balanced laminate, restrictions on the number of plies with the same orientation stacked together, a minimum of 10% of plies at angles of 5°, ±45°, and 85°, and the prohibition of winding a 5° ply as the first or last ply. The limitations of stacking sequences are used to reduce the computational cost. This approach allows topology optimisation of composite frame structure with decreasing total mass of the structure considering fundamental frequency constraints.
Topological optimisation enables the reduction of unnecessary beams of the structure and thus a reduction in the total weight. The method presented here enables the same. Our method can also calculate different values of winding angles of individual beams or a group of beams, which can also result in weight reduction compared to the method published in reference [Citation18] while maintaining the required stiffness. Thanks to the current technological possibilities of winding composite beams under a wide range of angles, our method is relevant and highly applicable, while its production should not be more expensive than that described in reference [Citation18]. On the contrary, less material is involved, which should reduce the price of the final product.
The presented method offers the advantage of using simple equations without the need to create a complex model for designing the appropriate tube stacking sequence in frame structures, while still needing more detailed technological design to be implemented at a later stage.
9. Summary and conclusion
In this study, an optimisation process based on machine learning techniques was used to prepare a surrogate model presenting the behaviour of a composite frame structure. It was successfully applied to three specific composite frame geometries, which represent typical design scenarios encountered in practice, including a crane structure, a joint reinforcement, and a Gantry-type machining centre. Each geometry presented unique challenges and requirements, and our objective was to tailor their designs to meet specific criteria.
The optimisation process involved adjusting the winding angles and thicknesses of tube plies to achieve the optimal winding configuration and enhance structural performance. The type of loading applied to each geometry influenced the winding angle settings. The optimisation process resulted in improved objective values, such as displacement, strength, and volume, indicating the effectiveness of the approach.
Geometry A was initially analysed with a clear focus on achieving three specific objectives: minimising volume, ensuring a safety factor for strength, and controlling displacement within acceptable limits. This optimisation process resulted in the final member of choices emerging from the 3rd cycle, as it consistently met the criteria. The integration of winding angles and thickness adjustments allowed development of a final configuration that effectively balanced structural integrity and mass reduction. The findings from Geometry A optimisation were successfully utilised in subsequent geometries, demonstrating the transferability and effectiveness of the present analysis strategy.
Geometry B served as a joint structure building upon the output of Geometry A. The joint needed to reinforce the assembly to withstand the required loads while ensuring sufficient strength and stiffness. The optimisation process involved striking a balance between reducing volume and maintaining strict strength and stiffness parameters. Our findings indicated that the 5th cycle of optimisation provided the best trade-off between these objectives, leading to the selection of the member obtained from this cycle. Tube 1 did not require additional reinforcement, whereas tube 2 benefited from strengthening measures.
Geometry C was aimed at adapting the winding configuration to handle the applied torque in tube 1, beside usual loadings such as bending and tension while minimising volume and controlling displacement and strength. The optimal member was identified after the 2nd cycle, based on a comparison with the 3rd cycle member, which showed worsening in objectives F2 and F3.
Comparatively, our approach in this study demonstrated several advantages over previous research. Utilising a bi-objective EA allowed for better control over data overfitting and the selection of optimal models from a Pareto set of optimum models. Incorporating deep learning enabled the identification of subtle yet significant fluctuations in the data. Moreover, our use of the cRVEA algorithm enabled the simultaneous optimisation of three objectives, enhancing the effectiveness of the optimisation process.
Our methodology expanded on existing research regarding topology optimisation of composite frame/curved beam structures. The ability to calculate various ply winding angles and thicknesses for individual beams or groups of beams can potentially reduce weight while maintaining the required strength and stiffness. This approach is highly practical, promising reduced material consumption and lower production costs.
In conclusion, this study has provided valuable insights into the optimisation of composite structures across different geometries. We have successfully developed and fine-tuned designs to meet specific performance criteria, showcasing the versatility and effectiveness of our approach. The integration of evolutionary algorithms, deep learning, and careful consideration of objectives and constraints has enabled us to achieve optimised configurations that strike a balance between structural integrity, mass reduction and performance requirements. These findings offer practical usage for real-world applications in engineering and manufacturing.
Disclosure statement
No potential conflict of interest was reported by the author(s).
Additional information
Funding
References
- F.C. Shen, A filament-wound structure technology overview. Mater. Chem. Phys. 42(2) (1995), pp. 96–100.
- M. Dvořák, T. Ponížil, V. Kulíšek, N. Schmidová, K. Doubrava, B. Kropík, and M. Růžička, Experimental development of composite bicycle frame. Appl. Sci. 12(16) (2022), p. 8377. doi:10.3390/app12168377.
- S. David Müzel, E.P. Bonhin, N.M. Guimarães, and E.S. Guidi, Application of the finite element method in the analysis of composite materials: a review. Polymers 12(4) (2020), pp. 818.
- A. Malá, Z. Padovec, T. Mareš, and N. Chakraborti, Shallow and deep evolutionary neural networks applications in solid mechanics, in Advanced Machine Learning with Evolutionary and Metaheuristic Techniques, J. Valadi, K.P. Singh, M. Ojha, and P. Siarry, ed., Springer, Springer Nature Singapore Pvt Ltd.
- K. Miettinen, Nonlinear Multiobjective Optimization, Kluwer Academic Publishers, Boston, 1998.
- D. Vondráček, Z. Padovec, T. Mareš, and N. Chakraborti, Optimization of dome shape for filament wound pressure vessels using data-driven evolutionary algorithms. Mater. Manuf. Processes (2023), pp. 1–12. doi:10.1080/10426914.2023.2187823.
- D. Vondráček, Z. Padovec, T. Mareš, and N. Chakraborti, Analysis and optimization of junction between cylindrical part and end dome of filament wound pressure vessels using data driven evolutionary algorithms. Proc. Inst. Mech. Eng., Part C (2023). doi:10.1177/09544062231191319.
- S. Roy, and N. Chakraborti, Novel strategies for data-driven evolutionary optimization, in Computational Sciences and Artificial Intelligence in Industry: New Digital Technologies for Solving Future Societal and Economical Challenges, Tero Turovien, Jacques Periaux, Pekka Neittaanmäki, ed., Springer International Publishing, Cham, 2022. pp. 11–25.
- R.M. Jones, Mechanics of Composite Materials: Second ed, Taylor & Francis Ltd, London, 1999.
- S.S. Rao, The Finite Element Method in Engineering, Elsevier Science & Technology, Burlington, 2004.
- R. Cheng, Y. Jin, M. Olhofer, and B. Sendhoff, A reference vector guided evolutionary algorithm for many-objective optimization. IEEE Trans. Evol. Comput. 20(5) (2016), pp. 773–791.
- S. Roy, B. Saini, D. Chakrabarti, and N. Chakraborti, Mechanical properties of micro-alloyed steels studied using a evolutionary deep neural network. Mater. Manuf. Processes 35(6) (2020), pp. 611–624.
- N. Chakraborti, Data-Driven Evolutionary Modeling in Materials Technology, CRC Press, Boca Raton, 2023.
- P. David, T. Mareš, and N. Chakraborti, Evolutionary multi-objective optimization of truss topology for additively manufactured components. Mater. Manuf. Processes (2023), pp. 1–10. doi:10.1080/10426914.2023.2196325.
- X. Li, P. Yang, Z. Chen, and L. Miao, The modular design and analysis of open CNC system machine. MATEC Web Conf. 220 (2018), p. 08006.
- Z. Liao, C. Qiu, J. Yang, J. Yang, and L. Yang, Accelerating the layup sequences design of composite laminates via theory-guided machine learning models. Polymers 14(15) (2022), pp. 3229.
- P. Bastl, M. Valášek, and N. Chakraborti, Evolutionary algorithms in robot calibration. Mater. Manuf. Processes (2023), pp. 1–20. doi:10.1080/10426914.2023.2238368.
- Z. Duan, Y. Liu, B. Xu, and J. Yan, Structural topology design optimization of fiber-reinforced composite frames with fundamental frequency constraints. J. Struct. Eng. 148(4) (2022), p. 04022027.