
 ?Mathematical formulae have been encoded as MathML and are displayed in this HTML version using MathJax in order to improve their display. Uncheck the box to turn MathJax off. This feature requires Javascript. Click on a formula to zoom.
ABSTRACT
The formation mechanism of a recrystallisation internal friction (IF) peak superimposed on a grain boundary (GB) IF peak for deformed copper was studied. The P1 peak, associated with the recrystallisation process, was observed at ∼ 599 K (2 K/min) during the first heating process. Subsequently, the P2 peak, located at ∼ 510 K (0.2 Hz), corresponded to GB relaxation during the cooling process. The P1 peak showed minor relaxation at higher frequencies owing to the influence of GB relaxation. To accurately determine the temperature of the P1 peak in this scenario, two methods were used: fitting the measured IF spectra and performing IF measurements at lower frequencies and/or with faster heating rates to minimise the impact of GB relaxation. This work investigated the formation mechanism of the recrystallisation peak and supplemented the method for determining the recrystallisation temperature through IF measurements when the GB peak occurs at a nearby temperature.
1. Introduction
The recrystallisation temperature is considered one of the critical parameters for deformed metals. Classical methods used to determine this temperature, such as metallographic and hardness methods, have certain drawbacks including tedious operation, long testing cycles, and the need for numerous samples. However, the internal friction (IF) technique, sensitive to defects in solids, can be employed to investigate the recrystallisation process of the deformed metals [Citation1].
In previous studies on the recrystallisation behaviour of deformed metals using the IF technique [Citation2–6], a non-relaxational IF peak associated with the recrystallisation process was observed [Citation2–4], and the apparent activation energy of recrystallisation process could be deduced [Citation5, Citation6]. However, the temperature at which the recrystallisation IF peak occurs depends on the heating rate and differs significantly from the classical recrystallisation temperature. To address this, a method to determine the classical recrystallisation temperature using the IF technique was proposed [Citation1]. The key issue in this method lies in accurately determining the recrystallisation peak temperature, which becomes challenging when considering the contribution of grain-boundary relaxation. In this paper, the formation mechanism of a recrystallisation IF peak superposed with a GB peak of deformed pure Cu is investigated and two methods for accurately determining the recrystallisation peak temperature suggested. In addition, the equivalence of continuously heating and isothermal recrystallisation processes in deformed pure Cu is reported.
2. Experimental
Copper plates with a purity of 99.99% were obtained from Zhongnuo Adcanced Material (Beijing) Technology Co. Ltd. Their main impurities are Ag, Sn, Ni and Fe (10–25 ppm). After full annealing, a copper plate was cold-rolled with a thickness reduction of 80% (designated as CR hereafter). The preparation and testing procedures for the specimens used in the IF measurements and Vickers hardness measurements followed the methods described in Ref. [Citation1].
3. Results and discussion
The behaviours of IF and relative modulus of sample CR as a function of temperature were characterised as shown in . A P1 peak, similar to other recrystallisation peaks, appears at ∼ 599 K (0.5 Hz) during the heating process at a rate of 2 K/min. Correspondingly, the relative modulus exhibited abnormal changes (red region in a), indicating that the P1 peak dominantly originated from the recrystallisation process [Citation3, Citation4]. It is interesting to note that the peak temperature is frequency dependent when the frequency is more than 0.5 Hz. During the subsequent cooling process, only a P2 peak appears at ∼ 510 K (0.2 Hz). Therefore, the P1 peak is not a pure recrystallisation peak, but additionally contains a component of relaxation nature.
Figure 1. Temperature-dependent IF and relative modulus of sample CR measured in the (a) heating and (b) cooling process; (c) Arrhenius plot of the P2 peak. Fitting profiles of P2 peak (short-dash lines) and background curve (dash lines) are plotted.
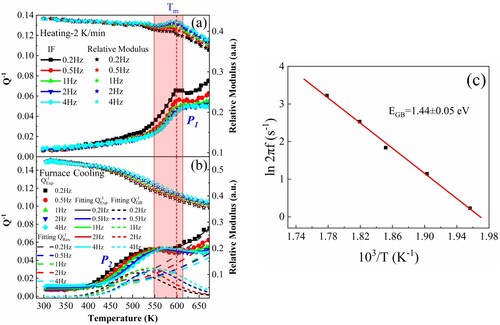
The P2 peak obviously exhibiting a relaxation nature (b) can be described as [Citation7]:
(1)
(1) and the P2 peak occurs at the following condition:
(2)
(2) where TP is the P2 peak temperature, ω = 2πf is the circular frequency, τ is the relaxation time, τ0 is the pre-exponential factor of τ, E is the activation energy, and k is the Boltzmann constant. The background is [Citation8]:
(3)
(3) with A, B, and C being constants. Therefore, the value of E for the P2 peak was calculated as 1.44 ± 0.05 eV from c, which is consistent with the activation energy of grain boundary (GB) relaxation in Cu [Citation2], indicating that the P2 peak is the GB peak.
The GB relaxation behaviour of sample CR was analysed. Because GB relaxation occurs in the recrystallised materials, this would contribute to the IF spectrum in the heating process around the P1 peak temperature (Tm). Therefore, the weak relaxation of the P1 peak can be ascribed to the contribution of GB relaxation.
On the other hand, a recrystallisation peak appears because the IF value of deformed materials is significantly higher than that of recrystallised materials at comparative temperatures [Citation3]. When the recrystallisation occurs, the deformed grains will be gradually replaced by recrystallised grains, and the measured IF () would be a weighted combination of
(deformed materials) and
(fully recrystallised materials), both of which can be approximately described by EquationEq. (3
(3)
(3) ). Therefore,
is related to the recrystallisation volume fraction (X) following the rule of mixtures [Citation1]:
(4)
(4) In this paper however, the contribution of GB relaxation (
), which is weighted by X, should be considered, so
can be re-written as:
(5)
(5)
(6)
(6) Therefore, the P1 peak is composed of
, fRex (recrystallisation IF peak) and X
. In the continuous heating process, X can be described as [Citation9, Citation10]:
(7)
(7) where t is the time, k0 is a constant, R is the gas constant, E is the recrystallisation activation energy, β is the heating rate, T(t) = T0+βt, T0 is the initial temperature, and n is the Avrami exponent [Citation11].
The unknown parameters in and
are obtained through the IF spectrum in the cooling process, and then the other parameters in X and fRex are determined by the IF spectrum in the heating process. Thus,
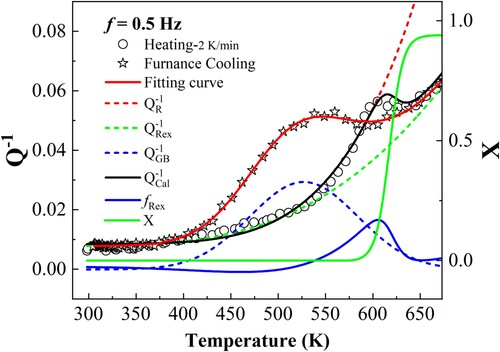
and fRex can be deduced, enabling an accurate determination of Tm. demonstrates a satisfactory fitting result of the IF spectra, following the above-mentioned procedures.
Figure 2. IF-temperature spectra measured at 0.5 Hz with 2 K/min. The total fitting results (solid lines), fRex (blue solid line), the GB peak and the background curves (dash lines) are plotted.
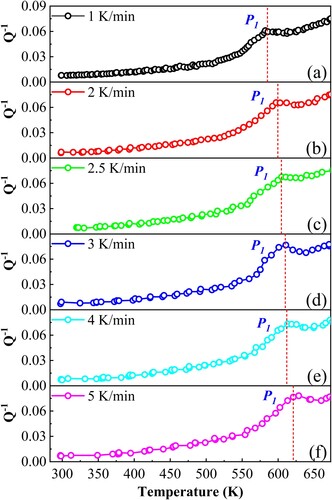
Therefore, two approaches can be employed to precisely determine the recrystallisation peak that overlaps with the GB peak. One is to fit the measured IF in heating/cooling processes by Eqs. (1–7). The other is to separate the P1 peak and the P2 peak as far as possible by measuring the IF spectra at low frequencies which will shift the P2 peak towards lower temperature and/or with high heating rate which would shift the P1 peak towards higher temperature. In this study, Tm can be directly determined (shown in ) at 0.2 Hz, where the influence of the P2 peak on the P1 peak can be neglected.
Figure 3. The IF spectra (0.2 Hz) of sample CR measured with the following heating rates: (a) 1 K/min, (b) 2 K/min, (c) 2.5 K/min, (d) 3 K/min, (e) 4 K/min, and (f) 5 K/min.
To investigate the equivalence of continuously heating and isothermal recrystallisation processes in the deformed Cu, similar test procedures and data analysis methods to those in Ref. [Citation1] were adopted in the present case.
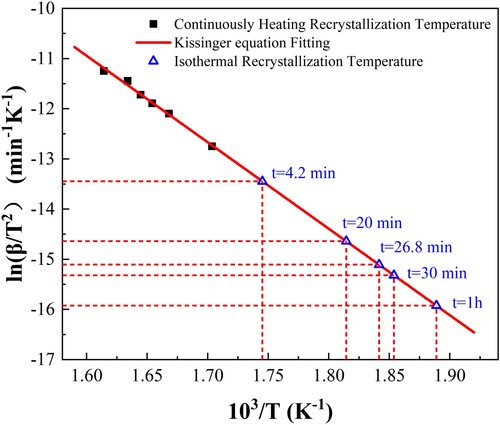
The Kissinger equation of sample CR deduced from the shift of P1 peak with heating rate (as shown in ) can be expressed as [Citation12]:
(8)
(8) where A = 16 ± 1 ln(min−1K−1) is a constant, and Em = 143 ± 6 kJ/mol is the recrystallisation activation energy in the continuously heating process. Through the hardness method [Citation1, Citation13, Citation14], the classical recrystallisation temperature (
) at different isothermal annealing times (
) is obtained. The calculated recrystallisation activation energy in the isothermal recrystallisation process is 1.46 ± 0.11 eV, which is comparable to Em, indicating that the mechanism of continuously heating and the isothermal recrystallisation process is consistent. Therefore, it is reasonable to predict
by the Kissinger equation deduced from IF measurement. The heating rate corresponding to
at corresponding
(4.2, 20, 26.8, 30 and 60 min) can be obtained as 0.47, 0.14, 0.081, 0.064 and 0.034 K/min by extrapolating the line of the Kissinger equation fitting to lower temperature. This means that the peak temperature of the P1 peak measured at such a low heating rate would coincide with
.
Figure 4. Kissinger plot of sample CR and correlation of with the parameters of continuously heating recrystallisation via the Kissinger equation.
4. Conclusions
For the sample CR, the P1 peak located at ∼ 599 K (K/min) during the heating process is associated with recrystallisation, while the P2 peak (GB peak) appears at ∼ 510 K (0.5 Hz) during the subsequent cooling process. The P1 peak is associated with weak relaxational at higher frequency because of the contribution of GB relaxation, and the mechanism related to the recrystallisation peak is composed of , fRex and X
. Consequently, two methods have been proposed to accurately determine the P1 peak temperature. One is to fit the measured IF spectra, and the other involves conducting IF measurements at lower frequency and/or with higher heating rate to minimise the influence of GB relaxation. The equivalence of the continuously heating and isothermal recrystallisation process has been evaluated, and the corresponding heating rates of
in deformed Cu obtained.
Disclosure statement
No potential conflict of interest was reported by the author(s).
Additional information
Funding
Notes on contributors
Tianlu Chen
Tianlu Chen is a Graduate student in the Key Laboratory of Materials Physics, Institute of Solid State Physics, HFIPS, Chinese Academy of Sciences, China.
Meng Sun
Meng Sun is an Associate Professor in the Key Laboratory of Materials Physics, Institute of Solid State Physics, HFIPS, Chinese Academy of Sciences, China.
Run Yang
Run Yang is a Graduate student in the Key Laboratory of Materials Physics, Institute of Solid State Physics, HFIPS, Chinese Academy of Sciences, China.
Rui Liu
Rui Liu is a Professor in the Key Laboratory of Materials Physics, Institute of Solid State Physics, HFIPS, Chinese Academy of Sciences, China.
Weibin Jiang
Weibin Jiang is a Professor in the Key Laboratory of Materials Physics, Institute of Solid State Physics, HFIPS, Chinese Academy of Sciences, China.
Tao Zhang
Tao Zhang is a Professor in the School of Physics and Materials Science, Guangzhou University, China.
Xuebang Wu
Xuebang Wu is a Professor in the Key Laboratory of Materials Physics, Institute of Solid State Physics, HFIPS, Chinese Academy of Sciences, China.
Xianping Wang
Xianping Wang is a Professor in the Key Laboratory of Materials Physics, Institute of Solid State Physics, HFIPS, Chinese Academy of Sciences, China.
Changsong Liu
Changsong Liu is a Professor in the Key Laboratory of Materials Physics, Institute of Solid State Physics, HFIPS, Chinese Academy of Sciences, China.
Qianfeng Fang
Qianfeng Fang is a Professor in the Key Laboratory of Materials Physics, Institute of Solid State Physics, HFIPS, Chinese Academy of Sciences, China.
References
- T.L. Chen, M. Sun, R. Liu, W.B. Jiang, X.B. Wu, X.P. Wang, C.S. Liu, and Q.F. Fang, Determination of recrystallization temperature of deformed high-purity Al assessed by internal friction technique. J. Alloys Compd. 891 (2022), pp. 161984.
- I.S. Golovin, Grain-boundary relaxation in copper before and after equal-channel angular pressing and recrystallization. The Physics of Metals and Metallography 110 (2010), pp. 405–413.
- I.S. Golovin, A.V. Mikhaylovskaya, and H.R. Sinning, Role of the β-phase in grain boundary and dislocation anelasticity in binary Al–Mg alloys. J. Alloys Compd. 577 (2013), pp. 622–632.
- A.V. Pozdniakov, R.Y. Barkov, A.S. Prosviryakov, A.Y. Churyumov, I.S. Golovin, and V.S. Zolotorevskiy, Effect of Zr on the microstructure, recrystallization behavior, mechanical properties and electrical conductivity of the novel Al-Er-Y alloy. J. Alloys Compd. 765 (2018), pp. 1–6.
- T. Hao, Z.Q. Fan, S.X. Zhao, G.N. Luo, C.S. Liu, and Q.F. Fang, Strengthening mechanism and thermal stability of severely deformed ferritic/martensitic steel. Mater. Sci. Eng. A 596 (2014), pp. 244–249.
- N. Kobelev, E. Kolyvanov, and Y. Estrin, Temperature dependence of sound attenuation and shear modulus of ultra fine grained copper produced by equal channel angular pressing. Acta Mater. 56 (2008), pp. 1473–1481.
- A.S. Nowick, and B.S. Berry, Anelastic Relaxation in Crystalline Solids, Academic Press, New York, 1972.
- M. Sun, W.B. Jiang, X.Q. Liu, T.L. Chen, X.P. Wang, and Q.F. Fang, A comparative study on the grain boundary internal friction peak of pure iron. Mater. Lett. 305 (2021), pp. 130814.
- A.T.W. Kempen, F. Sommer, and E.J. Mittemeijer, The isothermal and isochronal kinetics of the crystallisation of bulk amorphous Pd40Cu30P20Ni10. Acta Mater. 50 (2002), pp. 1319–1329.
- C.X. Xie, W. Li, D.H. Zheng, J.Y. Luo, X.C. Cao, S.Y. Zhong, and S. Li, Non-isothermal crystallization kinetics and magnetic properties of FeCoNiCrZr metallic glass. J. Supercond. Novel Magn. 31 (2018), pp. 2977–2982.
- Q.M. Luan, J. Lee, J.H. Zheng, C. Hopper, and J. Jiang, Combining microstructural characterization with crystal plasticity and phase-field modelling for the study of static recrystallization in pure aluminium. Comput. Mater. Sci. 173 (2020), pp. 109419.
- H.E. Kissinger, Variation of peak temperature with heating rate in differential thermal analysis. J. Res. Natl. Bur. Stand. (1934) 57 (1956), pp. 217–221.
- A. Alfonso, D. Juul Jensen, G.N. Luo, and W. Pantleon, Recrystallization kinetics of warm-rolled tungsten in the temperature range 1150–1350 °C. J. Nucl. Mater. 455 (2014), pp. 591–594.
- A. Alfonso, D. Juul Jensen, G.N. Luo, and W. Pantleon, Thermal stability of a highly-deformed warm-rolled tungsten plate in the temperature range 1100–1250°C. Fusion Eng. Des 98–99 (2015), pp. 1924–1928.