
Abstract
Objective
To evaluate the possible association between thyroid function within the euthyroid range and musculoskeletal parameters as well as body composition in a sample of postmenopausal women.
Methods
This cross-sectional study included 96 postmenopausal women with serum thyroid-stimulating hormone (TSH) within the normal laboratory reference range. Fasting venous blood samples were obtained for biochemical/hormonal assessment. Bone status and body composition were measured using Dual Energy X-ray absorptiometry (DXA). Physical activity was quantified using the International Physical Activity Questionnaire (IPAQ) index.
Results
Serum TSH correlated with handgrip strength (HGS, r-coefficient = 0.233, p = .025), and total body bone mineral density (BMD) T-score values (r-coefficient = 0.321, p = .003). HGS measures were associated with BMD (r-coefficient = 0.415, p < .001), with bone mineral content (BMC, r-coefficient = 0.427, p < .001), and lean mass (r-coefficient = 0.326, p = .003). Women with low muscle strength, defined as HGS < 16 kg, had lower TSH levels than women with normal muscle strength (low vs. normal muscle strength, ANCOVA 1.13 ± 0.49 mU/L vs. 1.60 ± 0.83 mU/L, p = 0.024) independently of age, BMD, percentage of body fat or absolute lean mass. Multivariable linear regression analysis showed that HGS values were associated with TSH measurements (β-coefficient = 0.246, p = .014) and BMD T-score values (β-coefficient = 0.306, p = .002). All models were adjusted for age, body mass index (BMI), vitamin D, low-density lipoprotein cholesterol, current smoking, physical activity, and homeostasis model assessment of insulin resistance.
Conclusions
In this sample of postmenopausal women, lower serum TSH values, within normal range, were associated with lower muscle strength compared to higher normal TSH values. Further research is needed to elucidate the significance of our preliminary findings.
Introduction
A growing body of evidence has described a negative association between female post-reproductive life and the musculoskeletal system and body composition [Citation1,Citation2]. The menopausal transition per se has been associated with a change in body composition: an increase in body fat and a corresponding decrease in lean fat mass [Citation3]. Moreover, menopause but also aging per se is known to induce a decrease in muscle strength, which is clinically manifested as a lower handgrip strength (HGS) [Citation4]. The latter has gained particular attention due to its close relation with bone metabolism and its possible use as a clinical indicator of sarcopenia in various populations [Citation5].
Aging, on the other hand, appears to modify thyroid function, secondary to the natural adaptation of the hypothalamic–pituitary–thyroid axis to the aging process itself [Citation6,Citation7]. In women, levels of the unstimulated thyroid-stimulating hormone (TSH) appear to increase with aging [Citation8–10]. Levels of serum triiodothyronine (T3) appear to decrease with time, while thyroxine (T4) serum levels are usually preserved [Citation11]. Moreover, aging individuals are characterized by the reduced conversion of T4 to T3, ensuing in a lower T4 to T3 ratio [Citation12].
Fluctuation of thyroid hormones within the normal range has been associated with musculoskeletal development and body composition, but the evidence remains conflicting due to the heterogenous nature of the assessed populations. A negative association between TSH levels and HGS has been described by one longitudinal [Citation13] and three cross-sectional population-based studies [Citation14–16]. In a gender-stratified approach, recent evidence reported an inverse association between HGS and TSH levels, mainly in males aged less than 65 years and a positive association between HGS and TSH levels in males aged more than 65 years [Citation17,Citation18]. Evidence on the possible association between bone turnover and thyroid hormones is still controversial, with studies reporting both a positive association [Citation19–21] or a lack of an association [Citation22–24]. The possible link between thyroid hormones and body composition has been described only by one earlier study, which reported an association between TSH levels and markers of adiposity in the general population [Citation25]. In an earlier study, we demonstrated that body composition after menopause is associated with thyroid function within the normal range [Citation26].
Given the role of thyroid hormones in regulating not only body composition but also musculoskeletal health, we aimed to evaluate the possible association between TSH within the normal range and parameters of bone and body composition and muscle strength in a sample of postmenopausal women.
Methods
Study population
This was a cross-sectional study that recruited postmenopausal women attending the outpatient Menopause Clinic of Aretaieio Hospital in Athens, Greece from January 2021 and August 2022. This clinic has been active since 1993 and serves as a referral Center for women experiencing symptoms at the time of the menopausal transition, as well as postmenopausal women experiencing chronic problems of aging. To be included all had normal thyroid function defined as a TSH within normal laboratory range (0.4 − 4.5 mU/L), as well as normal levels of free thyroxine and free triiodothyronine. The menopausal status was characterized by the absence of menstruation for 12 or more consecutive months, a serum follicle-stimulating hormone (FSH) level >25 mIU/mL and an estradiol (E2) level <50 pg/mL.
Exclusion criteria were as follows: clinically overt or treated cardiovascular disease, acute or chronic inflammatory diseases, thyroid dysfunction or pituitary pathology, diabetes mellitus of any type either diagnosed or treated, hepatic or renal insufficiency, history of recent surgical intervention for any reason and the presence of a tumor of any origin. In addition, we excluded women under treatment with any of the following either at the time of the study recruitment or 6 months prior to this: (a) nitrates or steroids, (b) hormone replacement therapy, (c) selective estrogen receptor modulators, (d) anti-osteoporotic drugs (e.g. bisphosphonates and/or denosumab) or teriparatide or romosozumab (e) any medications. A total of 96 women fulfilling the inclusion criteria were included in the study. All participants provided informed consent, and the research protocol of this study was approved by the Local Ethics Committee.
Protocol study procedures
A detailed medical history was recorded for all participants. We measured anthropometric parameters, including body weight (kg) and waist circumference (cm). A digital weight scale was used to measure body weight, and a stadiometer was used to measure height (m) in an upright position. Body mass index (BMI) was calculated using the equation: body weight (kg)/height (m)2. Fasting venous blood samples were collected on the same morning, centrifuged when necessary, and stored at −80 °C until assessment.
Assessment of body composition and bone status
Body composition was determined by Dual Energy X-ray absorptiometry (DXA; General Electric Lunar Corporation, Madison, WI). For this purpose, all women were positioned for regional and whole-body scans, according to the manufacturer’s protocol. Body fat distribution was determined as percentage of body fat and absolute lean mass (kg). The same scan provided information on the bone mineral density (BMD, expressed as g/cm2) and the bone mineral content (BMC, expressed as g) of participants. According to this Z and T scores are presented.
Physical activity assessment
Physical activity was evaluated by means of the International Physical Activity Questionnaire (IPAQ) index, which has already been validated for the Greek population, as previously described [Citation27,Citation28]. The IPAQ index classifies the extent of physical activity based on the amount of time spent into the following activities during the previous 7 d, namely walking or physical activity of moderate vs. high intensity [Citation28]. Metabolic equivalent of task (MET) minutes were estimated for each category of physical activity, and the total MET-minutes per week were calculated, as previously described [Citation27,Citation29].
Accordingly, intense physical activity was defined for those participants meeting any of the following criteria:
At least 3 d of vigorous intensity activity achieving a minimum of at least 1500 MET-minutes per week.
At least 7 d of combined activity, consisting of vigorous-intensity or moderate-intensity activity or walking, achieving a minimum total of at least 3000 MET-minutes per week.
Moderate physical activity was defined for those participants meeting at least one of the following criteria:
At least 3 d of vigorous-intensity activity or ≥20 min/d.
At least 5 d of moderate-intensity activity and/or walking for ≥30 min/d.
At least 5 d of any combination of walking, moderate-, or vigorous-intensity activity achieving a minimum total of ≥600 MET-min/week.
Sedentary lifestyle or low physical activity was defined for those participants who did not meet any of the above criteria.
Evaluation of musculoskeletal status
For this purpose, we evaluated HGS using a hydraulic hand dynamometer (Jamar®, Sammons Preston, Bolingbrook, IL). The measurements were performed with the participants in sitting position, the elbow at 90° flexion, the forearm in neutral position and the wrist between 0 and 30° of extension. The mean of three consecutive measurements in each hand was used for analysis (intraclass correlation coefficient 0.94–0.98 depending on the tested side) [Citation30–32]. Women with HGS measures below the cut off of 16 kg were considered to have low muscle strength, whereas those with higher HGS measures were considered as having normal muscle strength [Citation33]. The mid upper arm circumference (MUAC; cm) and triceps skinfold thickness (TSF; cm) were estimated as previously described [Citation34].
Biochemical and hormonal assays
Biochemical assays were performed on the Architect c 8000 system (Abbott Diagnostics, Abbott Park, IL). Serum glucose was measured by the hexokinase/G-6-PDH methodology (Abbott; coefficient of variance, CV ≤ 5%). Total cholesterol (TC) was measured by enzymatic assay (Abbot; CV ≤ 3%) and triglycerides by the enzymatic glycerol phosphate oxidase methodology (Abbott; CV ≤ 5%). High density lipoprotein cholesterol (HDL-C) levels were assessed by chromogenic accelerator selective detergent methodology (ultra HDL assay, Abbott; CV ≤ 4%) and low-density lipoprotein cholesterol (LDL-C) by elimination methodology (multigent direct LDL, Abbott; CV < 4%).
Hormonal serum assays were performed on the Architect i1000SR analyzer (Abbott Diagnostics) by chemiluminescent microparticle immunoassay (CMIA; Abbott) and included: insulin (CV ≤ 7%), TSH, free thyroxine (FT4; CV ≤ 10%), free triiodothyronine (FT3) and 25 (OH) Vitamin D (CV≤ 4.6%) levels. The homeostasis model assessment of insulin resistance (HOMA-IR) was calculated as follows: fasting insulin (μU/mL) × fasting glucose (mmol/L)/22.5.
Statistical analysis
Statistical analysis was performed using SPSS version 27.0(SPSS Inc., Chicago, IL). Qualitative data is expressed as frequencies (percent values), while quantitative data expressed as mean values and standard deviation (mean ± SD). For the purpose of the assessment, we used TSH levels as a continuous parameter. The normality of distributions was evaluated using both exploratory data analysis and the Kolmogorov–Smirnov test.
Correlations between parameters of interest were evaluated using Pearson’s correlation coefficient. Differences between continuous variables were assessed using the independent samples t-test (for baseline observations) or one-way analysis of variance (ANOVA) as well as analysis of co-variance (ANCOVA). We particularly assessed differences in bone and body composition parameters according to muscle strength, were the following confounders were utilized, namely age, height, current smoking, physical activity, LDL-C, vitamin D, and insulin resistance. We also assessed differences in TSH values according to muscle strength, where the following confounders were considered, namely age, BMD, % of body fat, and lean mass (kg). Linear regression analysis was used to evaluate the potential association between high vs. low-normal levels of TSH and bone and body composition parameters, in models adjusted for traditional risk factors such as age, vitamin D, physical activity, blood lipids, and insulin resistance. We used variance-inflation factors to estimate co-linearity between independent variables in regression models, all factors were estimated as < 2, implying that multicollinearity did not bias the regression models. For all calculations statistical significance was set at the level of p < .05.
Results
The results of the descriptive analysis for the 96 women of the study are presented in , including the results for anthropometric and demographic parameters, biochemical/hormonal serum levels, body composition, bone densitometry results, and musculoskeletal assessment.
Table 1. Studied parameters of postmenopausal women (n = 96) with normal thyroid function.
depicts the results of the correlation analysis between TSH levels and analyzed parameters. Accordingly, we observed that TSH correlated positively with HGS (r-coefficient = 0.233, p = .025) and total body BMD T-score values (r-coefficient = 0.321, p = .003). Measures of HGS were associated with BMD values (r-coefficient = 0.415, p < .001), with BMC values (r-coefficient = 0.427, p < .001) and lean mass measures (r-coefficient = 0.326, p = .003) (Data not shown in the table).
Table 2. Correlation analysis between values of handgrip strength, thyroid function, and body composition.
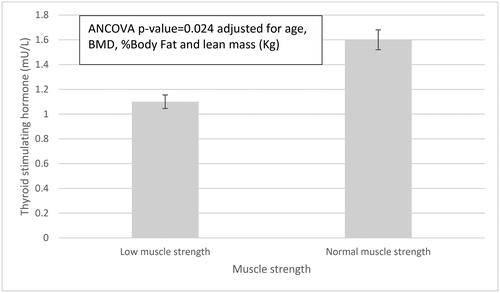
shows the comparison of mean TSH levels between women with low and normal HGS. We observed lower TSH levels in women with low HGS compared to women with normal HGS (low vs. normal HGS, ANCOVA 1.13 ± 0.49 mU/L vs. 1.60 ± 0.83 mU/L, p = .024) adjusted for age, BMD, percentage body fat and lean mass.
Figure 1. Thyroid stimulating hormone levels in women with low vs. normal muscle strength. Low muscle strength is defined as a HGS < 16 kg. Error bars represent standard deviation.
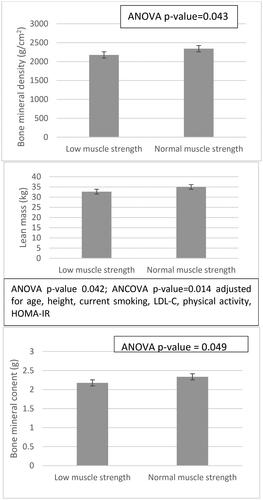
Furthermore, women with low HGS had lower total BMD measures, lean mass and total BMC compared to women with normal HGS (low vs. normal HGS, total BMD: 2.176.5 ± 234.5 g/cm2 vs. 2,342.1 ± 289.0 g/cm2, ANOVA p = .043; lean mass, 32.7 ± 4.6 kg vs. 35.0 ± 3.7 kg, ANOVA p = 0.042; BMC, 2.17 ± 0.23 g vs. 2.34 ± 0.29 g, ANOVA p = .049). Further adjustment for confounders like age or BMI resulted into the loss of statistical significance for BMD and BMC measures. However, the association between lean mass and HGS values remained significant even after adjustment for age, height, current smoking, LDL-C, physical activity, HOMA-IR, vitamin D (ANCOVA p = .023), .
Figure 2. Bone and body composition parameters according to muscle strength are presented as univariate analysis of variance (ANOVA) or co-variance (ANCOVA, adjusting for age, height, current smoking, physical activity, LDL-C, vitamin D, and insulin resistance). Low muscle strength is defined as a HGS < 16 kg. Error bars represent standard deviation. ANOVA: analysis of variance; ANCOVA: analysis of co-variance; HOMA-IR: homeostasis model assessment of insulin resistance; LDL-C: low-density lipoprotein cholesterol; HGS: handgrip strength. Statistical significance was set at the level of p value < .05.
shows the results of linear multivariable regression analysis, to evaluate the association of TSH to bone and body composition measures. TSH measurements were positively associated with HGS (β-coefficient = 0.246, p = .014) and BMD T-scores (β -coefficient = 0.306, p = .002). All models were adjusted for age, vitamin D, LDL-C, current smoking, physical activity, BMI, and HOMA-IR.
Table 3. Linear multivariable regression analysis models which included musculoskeletal or body composition parameters or bone densitometry as dependent variables.
Discussion
The results of this study highlight the role of TSH values within the normal range, with regards to musculoskeletal health of women after menopause. Multivariable linear regression analysis showed that postmenopausal women with lower TSH normal range values have less muscle strength and lower BMD T-score compared to women with higher TSH normal range values. Similarly, women with low muscle strength have significantly lower values of TSH when compared with women of normal muscle strength, after adjustment for risk factors (e.g. body composition, age, vitamin D, and physical activity).
We highlighted a positive association between TSH values within the normal range and muscle strength in this group of postmenopausal women, free from intake of thyroid hormone replacement therapy. In a gender-stratified approach, recent evidence reported an inverse association between HGS and TSH levels, mainly in males, but results regarding postmenopausal women remain inconclusive [Citation17,Citation18]. Kim et al. [Citation17] could not demonstrate an association between HGS measures and levels of TSH in the female subgroup of their study (n = 533) but demonstrated differences in levels of thyroid hormones between elder men and women. Unfortunately, the study by Kim et al. did not provide any information on the possible use of menopause hormone therapy [Citation17]. A large-scale Korean study (1487 men and 1407 women, aged at least 19 years) showed an age-dependent positive association between TSH levels above the normal reference range and HGS measures, evident only in men aged more than 65 years [Citation18]. Important to mention is the fact that the postmenopausal status has not been taken into consideration though [Citation18].
The same topic has been addressed by studies evaluating mixed-gender populations. Three cross-sectional population-based studies described a negative association between TSH levels and HGS in elderly individuals of both genders [Citation14–16]. The study by Szlejf et al. [Citation15] demonstrated in older adults a U-shaped association of TSH levels with sarcopenia and low muscle strength, assessed by HGS measures and bioelectrical impedance analysis. On the contrary, a longitudinal population-based study described in a mixed-gender population (61.9% males, no adjustment for the female reproductive status) that the annual change in HGS measures is predicted by high-normal FT3 and higher FT3-to-FT4 ratios, but reported no association between HGS and FT4 or TSH [Citation13].
According to the results of our study, values of HGS were associated with the amount of lean mass as well as indices of bone metabolism. Another cross-sectional analysis of 143 adults aged more than 70 years described gender-specific results; they showed that women with adequate vs. insufficient appendicular lean mass have greater maximal isometric and dynamic biceps strength, and maximal isometric and dynamic leg extension strength [Citation35], which agrees with our findings. A recent cross-sectional study of 249 postmenopausal women reported that the risk for dynapenia after the menopause is estimated as 1.06-times higher for each 1% of adiposity and 1.09-times higher for every year in age [Citation36]. The same study showed that the risk for dynapenia was found to be lower for women with higher femoral T-scores [Citation36]. An earlier study evaluated 117 physically active postmenopausal women and reported a cross-sectional association between HGS and BMD measures at all sites, whereas both lean mass and fat mass were positively correlated with femoral neck BMD [Citation37].
The association between TSH levels and BMD as well as muscle mass and strength can be explained by the results of recent studies which described the non-genomic effects of thyroid hormones. A growing body of evidence has reported the expression of TSH-receptors in extrathyroidal tissues, including adipose tissue and osteoblasts, while the TSH-receptor messenger RNA and the related protein are also expressed in skeletal muscles [Citation38,Citation39]. More specifically, experimental data on mice models and rodent muscle cells, has described that TSH administration can regulate insulin resistance via the protein kinase A and the cyclical AMP response element binding protein (PKA-CREB) pathway [Citation38]. TSH has also been thought to induce lipolysis and thermogenesis via its receptor in preadipocytes, while it is also involved in skeletal remodeling and bone resorption in osteoblasts or osteoclast precursors [Citation40–43].
The results of our study indicate the need for reassessment of the normal range of thyroid hormones in the aging individuals. The double-blind, randomized, placebo-controlled Thyroid Hormone Replacement for Untreated Older Adults with Subclinical Hypothyroidism Trial (TRUST) trial evaluated 737 adults aged at least 65 years who were diagnosed with persisting subclinical hypothyroidism. The primary analysis of the study could not identify any difference in hypothyroid symptoms or tiredness score at 1 year post intervention [Citation44]. In addition, the secondary analysis of the TRUST study could not demonstrate any improvement in hypothyroid symptoms or tiredness, in the group of older adults with higher hypothyroid symptom burden at baseline [Citation45]. Data in adults aged 80 years or older, retrieved from two randomized clinical trials, also showed that treatment of sub-clinical hypothyroidism with levothyroxine compared to placebo was not associated with any improvement in fatigue or hypothyroid symptoms [Citation46]. Emerging evidence suggests that TSH levels are positively associated with longevity, while the TSH set-point increases with advancing age, a fact that is implying that higher levels of TSH may be related with better clinical response in older individuals compared to the younger adults [Citation47]. Taking our results as well as previous data into consideration, it appears that there is a need for an age-specific reference range of TSH, which will adjust for higher normal values in the aging population.
This pilot study has certain limitations that need to be outlined. First, the cross-sectional design does not allow assessment of causality. Second, the sample size is rather small. Third, we encountered many missing values in the analysis of FT3, consequently the power to assess potential associations between FT3 and HGS or body composition parameters was not optimal. Hence, further analysis with values of FT4 and/or FT3 was not performed. Fourth, we measured thyroid hormone levels and measures of HGS only at one point of time. Despite this, this study adds to the limited available literature on the possible interrelation between serum TSH levels and measures of HGS, after evaluating a carefully selected group of postmenopausal women, recruited from an outpatient menopause clinic of a University hospital.
In conclusion, despite the above-mentioned limitations, in summary, the results of this study demonstrate the potential role of TSH values in the upper part of the reference range concerning measures of musculoskeletal health in an otherwise healthy postmenopausal sample. TSH values at the lower end of the normal range are associated with lower muscle strength and lower BMD T-scores. These results are implying a potential role of low normal thyroid function in postmenopausal women. Further prospective studies are required to elucidate the significance of our findings.
Author contributions
PC: data collection, literature review, manuscript drafting; EA: statistical analysis, literature review, manuscript drafting; PCh: statistical analysis, literature review, senior review of the manuscript; LK: data collection, literature review; AA: data collection, biochemical analysis; GK: laboratory analysis; KP: data collection; AA: data collection; NV: study supervision
IL: study supervision, senior review of the manuscript.
Disclosure statement
All authors declare having no conflicts of interest.
Data availability statement
The data that support the findings of this study are available from the corresponding author, [IL], upon reasonable request.
Additional information
Funding
References
- Greendale GA, Sternfeld B, Huang M, et al. Changes in body composition and weight during the menopause transition. JCI Insight. 2019;4(5):1. doi: 10.1172/jci.insight.124865.
- Greendale GA, Han W, Finkelstein JS, et al. Changes in regional fat distribution and anthropometric measures Across the menopause transition. J Clin Endocrinol Metab. 2021;106(9):2520–8. doi: 10.1210/clinem/dgab389.
- Marlatt KL, Pitynski-Miller DR, Gavin KM, et al. Body composition and cardiometabolic health across the menopause transition. Obesity (Silver Spring). 2022;30(1):14–27. doi: 10.1002/oby.23289.
- Geraci A, Calvani R, Ferri E, et al. Sarcopenia and menopause: the role of estradiol. Front Endocrinol (Lausanne). 2021;12:682012. doi: 10.3389/fendo.2021.682012.
- Lee SH, Gong HS. Measurement and interpretation of handgrip strength for research on sarcopenia and osteoporosis. J Bone Metab. 2020;27(2):85–96. doi: 10.11005/jbm.2020.27.2.85.
- Jasim S, Gharib H. Thyroid and aging. Endocr Pract. 2018;24(4):369–374. doi: 10.4158/EP171796.RA.
- Duntas LH. Aging and the hypothalamic-pituitary-thyroid axis. Vitam Horm. 2021;115:1–14. doi: 10.1016/bs.vh.2020.12.001.
- Surks MI, Sievert R. Drugs and thyroid function. N Engl J Med. 1995;333(25):1688–1694. doi: 10.1056/NEJM199512213332507.
- Tietz NW, Shuey DF, Wekstein DR. Laboratory values in fit aging individuals–sexagenarians through centenarians. Clin Chem. 1992;38(6):1167–1185. doi: 10.1093/clinchem/38.6.1167.
- Pinchera A, Mariotti S, Barbesino G, et al. Thyroid autoimmunity and ageing. Horm Res. 1995;43(1-3):64–68. doi: 10.1159/000184239.
- Over R, Mannan S, Nsouli-Maktabi H, et al. Age and the thyrotropin response to hypothyroxinemia. J Clin Endocrinol Metab. 2010;95(8):3675–3683. doi: 10.1210/jc.2010-0281.
- Veldhuis JD. Changes in pituitary function with ageing and implications for patient care. Nat Rev Endocrinol. 2013;9(4):205–215. doi: 10.1038/nrendo.2013.38.
- Gu Y, Meng G, Wu H, et al. Thyroid function as a predictor of handgrip strength among middle-aged and older euthyroid adults: the TCLSIH cohort study. J Am Med Dir Assoc. 2019;20(10):1236–1241. doi: 10.1016/j.jamda.2019.06.014.
- Spira D, Buchmann N, Demuth I, et al. Association of thyroid function with handgrip strength: data from the study of health in pomerania and the Berlin aging study II. Thyroid. 2019;29(9):1220–1226. doi: 10.1089/thy.2018.0646.
- Szlejf C, Suemoto CK, Janovsky C, et al. Thyroid function and sarcopenia: results from the ELSA-Brasil study. J Am Geriatr Soc. 2020;68(7):1545–1553. doi: 10.1111/jgs.16416.
- Di Iorio A, Paganelli R, Abate M, et al. Thyroid hormone signaling is associated with physical performance, muscle mass, and strength in a cohort of oldest-old: results from the mugello study. Geroscience. 2021;43(2):1053–1064. doi: 10.1007/s11357-020-00302-0.
- Kim BJ, Lee SH, Isales CM, et al. Association of serum TSH with handgrip strength in community-dwelling euthyroid elderly. J Clin Endocrinol Metab. 2018;103(11):3986–3992. doi: 10.1210/jc.2018-01095.
- Ahn SH, Seo DH, Cho Y, et al. Different relationships between thyrotropin and muscle strength according to sex and age in euthyroid koreans (The 6th korea national health and nutritional examination survey 2014-2015). Thyroid. 2020;30(12):1710–1717. doi: 10.1089/thy.2019.0601.
- Noh HM, Park YS, Lee J, et al. A cross-sectional study to examine the correlation between serum TSH levels and the osteoporosis of the lumbar spine in healthy women with normal thyroid function. Osteoporos Int. 2015;26(3):997–1003. doi: 10.1007/s00198-014-2906-z.
- Kim DJ, Khang YH, Koh JM, et al. Low normal TSH levels are associated with low bone mineral density in healthy postmenopausal women. Clin Endocrinol (Oxf). 2006;64(1):86–90. doi: 10.1111/j.1365-2265.2005.02422.x.
- Murphy E, Glüer CC, Reid DM, et al. Thyroid function within the upper normal range is associated with reduced bone mineral density and an increased risk of nonvertebral fractures in healthy euthyroid postmenopausal women. J Clin Endocrinol Metab. 2010;95(7):3173–3181. doi: 10.1210/jc.2009-2630.
- Grimnes G, Emaus N, Joakimsen RM, et al. The relationship between serum TSH and bone mineral density in men and postmenopausal women: the tromsø study. Thyroid. 2008;18(11):1147–1155. doi: 10.1089/thy.2008.0158.
- Svare A, Nilsen TI, Asvold BO, et al. Does thyroid function influence fracture risk? Prospective data from the HUNT2 study, Norway. Eur J Endocrinol. 2013;169(6):845–852. doi: 10.1530/EJE-13-0546.
- Lin JD, Pei D, Hsia TL, et al. The relationship between thyroid function and bone mineral density in euthyroid healthy subjects in Taiwan. Endocr Res. 2011;36(1):1–8. doi: 10.3109/07435800.2010.514877.
- de Moura Souza A, Sichieri R. Association between serum TSH concentration within the normal range and adiposity. Eur J Endocrinol. 2011;165(1):11–15. doi: 10.1530/EJE-11-0261.
- Lambrinoudaki I, Armeni E, Rizos D, et al. Indices of adiposity and thyroid hormones in euthyroid postmenopausal women. Eur J Endocrinol. 2015;173(2):237–245. doi: 10.1530/EJE-15-0141.
- Papathanasiou G, Georgoudis G, Papandreou M, et al. Reliability measures of the short international physical activity questionnaire (IPAQ) in greek young adults. Hellenic J Cardiol. 2009;50(4):283–294.
- Craig CL, Marshall AL, Sjöström M, et al. International physical activity questionnaire: 12-country reliability and validity. Med Sci Sports Exerc. 2003;35(8):1381–1395. doi: 10.1249/01.MSS.0000078924.61453.FB.
- Stamatelopoulos K, Tsoltos N, Armeni E, et al. Physical activity is associated with lower arterial stiffness in normal-weight postmenopausal women. J Clin Hypertens (Greenwich). 2020;22(9):1682–1690. doi: 10.1111/jch.13954.
- Sousa-Santos AR, Amaral TF. Differences in handgrip strength protocols to identify sarcopenia and frailty - a systematic review. BMC Geriatr. 2017;17(1):238. doi: 10.1186/s12877-017-0625-y.
- Velez MP, Rosendaal N, Alvarado B, et al. Age at natural menopause and physical function in older women from Albania, Brazil, Colombia and Canada: a life-course perspective. Maturitas. 2019;122:22–30. doi: 10.1016/j.maturitas.2018.12.015.
- Fragala MS, Dam TT, Barber V, et al. Strength and function response to clinical interventions of older women categorized by weakness and low lean mass using classifications from the foundation for the national institute of health sarcopenia project. J Gerontol A Biol Sci Med Sci. 2015;70(2):202–209. doi: 10.1093/gerona/glu110.
- Cruz-Jentoft AJ, Bahat G, Bauer J, et al. Sarcopenia: revised european consensus on definition and diagnosis. Age Ageing. 2019;48(1):16–31. doi: 10.1093/ageing/afy169.
- Stamatelopoulos K, Papavagelis C, Augoulea A, et al. Dietary patterns and cardiovascular risk in postmenopausal women: protocol of a cross-sectional and prospective study. Maturitas. 2018;116:59–65. doi: 10.1016/j.maturitas.2018.07.006.
- Patiño-Villada FA, González-Bernal JJ, González-Santos J, et al. Relationship of body composition with the strength and functional capacity of people over 70 years. Int J Environ Res Public Health. 2020;17(21):7767. doi: 10.3390/ijerph17217767.
- García-Alfaro P, García S, Rodríguez I, et al. Handgrip strength, dynapenia, and related factors in postmenopausal women. Menopause. 2021;29(1):16–22. doi: 10.1097/GME.0000000000001872.
- Marin RV, Pedrosa MAC, Moreira-Pfrimer LDF, et al. Association between lean mass and handgrip strength with bone mineral density in physically active postmenopausal women. J Clin Densitom. 2010;13(1):96–101. doi: 10.1016/j.jocd.2009.12.001.
- Moon MK, Kang GH, Kim HH, et al. Thyroid-stimulating hormone improves insulin sensitivity in skeletal muscle cells via cAMP/PKA/CREB pathway-dependent upregulation of insulin receptor substrate-1 expression. Mol Cell Endocrinol. 2016;436:50–58. doi: 10.1016/j.mce.2016.07.018.
- Davies T, Marians R, Latif R. The TSH receptor reveals itself. J Clin Invest. 2002;110(2):161–164. doi: 10.1172/JCI0216234.
- Abe E, Marians RC, Yu W, et al. TSH is a negative regulator of skeletal remodeling. Cell. 2003;115(2):151–162. doi: 10.1016/s0092-8674(03)00771-2.
- Baliram R, Latif R, Berkowitz J, et al. Thyroid-stimulating hormone induces a wnt-dependent, feed-forward loop for osteoblastogenesis in embryonic stem cell cultures. Proc Natl Acad Sci USA. 2011;108(39):16277–16282. doi: 10.1073/pnas.1110286108.
- Endo T, Kobayashi T. Thyroid-stimulating hormone receptor in brown adipose tissue is involved in the regulation of thermogenesis. Am J Physiol Endocrinol Metab. 2008;295(2):E514–E518. doi: 10.1152/ajpendo.90433.2008.
- Haraguchi K, Shimura H, Lin L, et al. Differentiation of rat preadipocytes is accompanied by expression of thyrotropin receptors. Endocrinology. 1996;137(8):3200–3205. doi: 10.1210/endo.137.8.8754740.
- Stott DJ, Rodondi N, Kearney PM, et al. Thyroid hormone therapy for older adults with subclinical hypothyroidism. N Engl J Med. 2017;376(26):2534–2544. doi: 10.1056/NEJMoa1603825.
- de Montmollin M, Feller M, Beglinger S, et al. L-thyroxine therapy for older adults with subclinical hypothyroidism and hypothyroid symptoms: secondary analysis of a randomized trial. Ann Intern Med. 2020;172(11):709–716. doi: 10.7326/M19-3193.
- Mooijaart SP, Du Puy RS, Stott DJ, et al. Association between levothyroxine treatment and thyroid-related symptoms among adults aged 80 years and older with subclinical hypothyroidism. Jama. 2019;322(20):1977–1986. doi: 10.1001/jama.2019.17274.
- Duntas LH, Yen PM. Diagnosis and treatment of hypothyroidism in the elderly. Endocrine. 2019;66(1):63–69. doi: 10.1007/s12020-019-02067-9.