
 ?Mathematical formulae have been encoded as MathML and are displayed in this HTML version using MathJax in order to improve their display. Uncheck the box to turn MathJax off. This feature requires Javascript. Click on a formula to zoom.
Abstract
Advanced analytics offers new means by which to increase efficiency. However, real-world applications of advanced analytics in manufacturing are scarce. One reason is that the management task of selecting advanced analytics technologies (AATs) for application areas in manufacturing is not well understood. In practice, choosing AATs is difficult because a myriad of potential techniques (e.g. diagnostic, predictive, and prescriptive) are suitable for different areas in the value chain (e.g. planning, scheduling, or quality assurance). It is thus challenging for managers to identify AATs that yield economic benefit. We propose a multi-criteria decision model that managers can use to select efficient AATs tailored to company-specific needs. Based on a data envelopment analysis, our model evaluates the efficiency of each AAT with respect to cost drivers and performance across common application areas in manufacturing. The effectiveness of our decision model is demonstrated by applying it to two manufacturing companies. For each company, a customized portfolio of efficient AATs is derived for a sample of use cases. Thereby, we aid management decision-making concerning the efficient allocation of corporate resources. Our decision model not only facilitates optimal financial allocation for operations in the short-term but also guides long-term strategic investments in AATs.
Introduction
Advanced analytics offers companies new possibilities to generate knowledge and business value from large datasets (Chehbi-Gamoura et al. Citation2019; Choi, Wallace, and Wang Citation2018; De-Arteaga, Feuerriegel, and Saar-Tsechansky Citation2022; Dogan and Birant Citation2021; Feuerriegel et al. Citation2022; Misic and Perakis Citation2019). It enables evidence-based decisions and actions informed by data. In this way, advanced analytics can become a critical differentiator for companies seeking to outcompete competitors (LaValle et al. Citation2011; Sivarajah et al. Citation2017).
There is a large untapped potential for process improvement and innovation using advanced analytics in manufacturing (Feng and Shanthikumar Citation2018; Kusiak Citation2017; Lee Citation2018; Lorenz et al. Citation2020; Senoner, Netland, and Feuerriegel Citation2022; Sony and Naik Citation2019; Wolf et al. Citation2019). Despite the promising prospects, manufacturers are not exploiting the full potential of advanced analytics (Stentoft et al. Citation2021). McKinsey estimated that <30% of the efficiency potential has been tapped so far (Henke et al. Citation2016). A core problem is that decision-makers in manufacturing face the complex task of selecting a suitable set (i.e. portfolio) of advanced analytics technologies (AATs). Concrete examples of AATs are reinforcement, semi-supervised, or deep learning techniques.Footnote1 Each AAT requires different resources during implementation and, furthermore, AATs vary in performance with respect to different application areas. Accordingly, decision-makers have to decide which selection of AATs entails the greatest economic benefit based on their company-specific needs. However, this choice is non-trivial for two main reasons. First, decision-makers lack knowledge concerning valuable application areas for advanced analytics (Fleming et al. Citation2018; LaValle et al. Citation2011). Second, they require decision models to aid them in the selection of suitable AATs from a plethora of different techniques (Wolf et al. Citation2019; Zangiacomi et al. Citation2019).
To aid managers in the manufacturing sector, this paper proposes a multi-criteria decision model that identifies a set of efficient AATs across different applications. Based on a data envelopment analysis (DEA), our decision model evaluates each AAT with respect to multiple cost drivers and effectiveness across common application areas. The DEA is particularly well suited for this problem as it can consider multiple input and output variables of the different applications. This is essential as the portfolio decision is complex, requiring to take various options and resources into account. To the best of our knowledge, this is the first use of a DEA model to allocate resources (e.g. financial, human) in conjunction with advanced analytics. This contribution can foster the further adoption of advanced analytics in manufacturing.
The applicability of our decision model is demonstrated using examples from two manufacturing companies. For each, we conducted expert interviews with associated project managers to identify both company-specific requirements and cost drivers. We evaluate efficiency across different AATs and, based on the results, recommend which advanced analytics techniques the manufacturing companies should use. Thereby, we guide resource allocation to AATs.
Our work has several implications for managers. Using our approach, decision-makers in manufacturing can support their selection of effective AATs. This is often challenging in practice since not merely a single AAT but rather a set of multiple AATs is required to improve efficiency in a manufacturing system. Given the recommended set of AATs, managers can improve human resource allocation, for example by hiring personnel with particular skills and steering short- and long-term financial investments in the AATs. Our decision model is flexible: it can be customized along different dimensions, namely the available AATs, cost drivers, and performance measures. Hence, our approach has wide applicability in diverse manufacturing settings.
The remainder of this paper is structured as follows. Section Related work provides an introduction to DEA and highlights the existing research gap. Section Model development develops our decision model to aid manufacturing management in selecting a set of efficient AATs. Section Empirical findings empirically demonstrates the effectiveness of our decision model in two manufacturing companies. Section Discussion discusses managerial implications, while Section Conclusion concludes.
Related work
In the following, we review existing approaches of selecting a set of efficient AATs for manufacturing. We then continue to provide a general introduction to DEA as a potential solution to overcome the limitations of the existing approaches.
Decision support for AAT selection
Research has identified many prominent applications of advanced analytics in manufacturing (Cheng et al. Citation2018; Choudhary, Harding, and Tiwari Citation2009; Köksal, Batmaz, and Testik Citation2011; Lorenz et al. Citation2021; Schuh et al. Citation2019; Sharp, Ak, and Hedberg Citation2018; Wang et al. Citation2018; Wuest et al. Citation2016). However, little research has been devoted to decision models that equip management with tools to select a suitable set of efficient AATs. Specifically, prior literature has suggested decision models for identifying and configuring single AATs for problem-specific applications, but not for choosing among multiple AATs. In this regard, this paper offers a novel and specific solution to a general problem that has been insufficiently addressed in the past.
Examples for selecting and configuring a single AAT are as follows. Villanueva Zacarias, Reimann, and Mitschang (Citation2018) suggest a framework that automatically recommends suitable analytics techniques with respect to a domain-specific problem at hand. Lechevalier et al. (Citation2018) present a framework for the semi-automatic generation and configuration of neural networks. However, this research stream is limited to single AATs rather than choosing a strategic selection of promising AATs. A promising way to overcome these limitations of the existing methods is offered by the DEA.
Data envelopment analysis
In management science, the evaluation of efficient entities is usually based on the DEA (Braglia and Petroni Citation1999; Braglia, Zanoni, and Zavanella Citation2003; Emrouznejad and Yang Citation2018; Jagoda and Thangarajah Citation2014; Liu, Lu, and Lu Citation2016). DEA is a method to assess the relative efficiency of homogeneous decision-making units (DMUs) that convert multiple inputs into multiple outputs (Charnes, Cooper, and Rhodes Citation1978). ‘Inputs’ are resources used by the DMUs, while ‘outputs’ represent generated benefits (Golany and Roll Citation1989). DMUs are generic entities; they can be organizations, divisions, industries, projects, or individuals.
The efficiency of each individual DMUj, j = 1,…, n, is evaluated based on m non-negative inputs xi = (x1,j,…, xm,j) and s non-negative outputs yr = (y1,j,…, ys,j). The DEA is based on a common measure to evaluate the efficiency of each DMUj, j = 1,…, n, i.e.
(1)
(1)
The strengths of the DEA are as follows. First, it is an empirical (‘data-oriented’) approach (Bogetoft and Otto Citation2011; Jagoda and Thangarajah Citation2014). Second, the DEA is non-parametric and thus does not require explicit characterizations of relations like linearity, which are customarily used in statistical regressions and related approaches (Cooper, Seiford, and Tone Citation2006). Third, the DEA can simultaneously handle multiple input and output variables that would otherwise not be comparable to one another (Cooper, Seiford, and Zhu Citation2011). This property of processing arbitrary factors ensures the DEA’s widespread applicability as a tool for benchmarking in many domains (Braglia, Zanoni, and Zavanella Citation2003; Chen, Cook, and Lim Citation2019; Liu, Lu, and Lu Citation2016).
The two basic DEA models are the Charnes, Cooper, and Rhodes (CCR) model (Charnes, Cooper, and Rhodes Citation1978) and the Banker, Charnes, Cooper (BCC) model (Banker, Charnes, and Cooper Citation1984). Both the CCR and the BCC draw upon a technology space T, defined as any possible input-output combinations, that are limited by the efficiency frontier. The technology space T is subject to two production economic regularities, namely free disposability and convexity (Cooper, Seiford, and Tone Citation2006). Free disposability assumes that one can produce at least the same number of outputs with more input. Convexity assumes that any weighted average of feasible input-output combinations is also a feasible production plan.
Both the CCR and the BCC model draw upon these two assumptions, yet they differ with respect to how input and output can be scaled, i.e. the returns-to-scale (RTS) assumption. Changing RTS assumptions affects the shape of the efficiency frontier and thus the technology space T (see ). The CCR model builds on the assumption of constant returns-to-scale (CRS) of activities. In other words, one can assume that we can arbitrarily scale inputs xi and outputs yr in a linear fashion (Cooper, Seiford, and Tone Citation2006). In combination with free disposability and convexity, the technology space for possible input-output pairs can thus be expressed as
(2)
(2)
where λj, j = 1,…, n, are the weights of the efficiency reference set (ERS), that is, a linear convex combination of efficient DMUs located on the frontier. The BCC model differs from the CCR model by additionally enforcing the condition
This implies a variable returns-to-scale (VRS) assumption and thus yields
(3)
(3)
Figure 1. Illustrative efficiency frontier and technology space T under CRS (solid line) and VRS (dashed line) with s = 1 and m = 1. DMUs are shown as points.
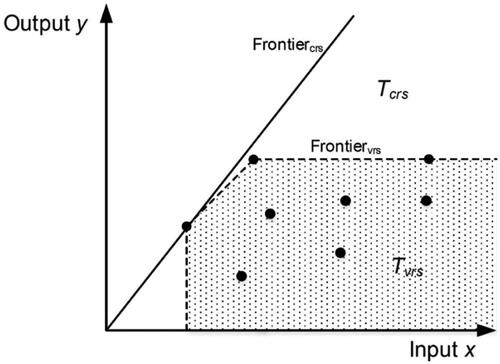
Because of this additional restriction, the technology frontier of the BCC model is less optimistic regarding potential input-output combinations than the CCR model. As a consequence, a BCC model with VRS always yields a greater or equal number of efficient DMUs relative to a CCR model with CRS, as shown in . Generally, the choice of the RTS assumption depends on the particular use case (Doyle and Green Citation1993). As we shall see later, our research setting requires a model that builds upon a VRS assumption.
Previously, the DEA has been widely considered a suitable decision model for strategic performance evaluation at the managerial level. For instance, researchers have applied the DEA in contexts, such as computer printers (Doyle Citation1991), robotics manufacturing systems (Cook, Kress, and Seiford Citation1993), software projects (Mahmood, Pettingell, and Shaskevich Citation1996), industrial robots (Baker and Talluri Citation1997) and automotive dealerships (Almohri, Chinnam, and Colosimo Citation2019).
However, to the best of our knowledge, the DEA has not yet been considered for selecting a set of efficient AATs in manufacturing. Since the DEA allows to select an efficient set consisting of multiple technologies, AATs can easily be added or removed to represent the latest development of AATs over time. In this regard, the DEA accounts for dynamic developments.
Model development
In the following, we first state our problem generally. We then present our proposed DEA framework. The resulting decision model requires suitable input and output variables, which we introduce subsequently. In the end, we formulate the optimization problem mathematically.
Problem statement
Our goal is to develop a multi-criteria decision model that identifies a set of efficient AATs in manufacturing. We model this decision problem via a DEA. The DEA is suitable because we (i) want to consider multiple input and output variables, (ii) have to handle incommensurate variables with different units, and (iii) require a scalar measure that allows for a ranking of examined AATs.
Proposed DEA framework
For our decision model, we propose an input-oriented BCC model in its envelopment form. Relevant inputs are given by financial resources that are required to implement an AAT, namely data preparation, modelling, and estimation costs. Relevant outputs are given by the generated effectiveness of an AAT across different application areas. Each output represents one aggregated effectiveness indicator based on three common measures, namely prediction performance, interpretability, and online learning ability (described in detail in the next chapter). shows our DEA framework. Each AAT is described by three cost drivers and in terms of its effectiveness in six application areas.
Figure 2. Proposed DEA framework in order to assess the efficiency of AATs.
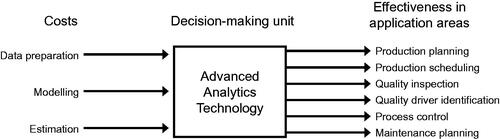
We opt for the input-oriented DEA variant because cost drivers can be considered flexible while the performance of each AAT in an application area is predetermined by the underlying technology. A manager, for instance, can hire better data scientists to improve modelling or data preparation (e.g. data collection mechanisms can be optimized to reduce data pre-processing costs). Estimation costs can be reduced, for instance, if appropriate computing infrastructure is acquired. However, the effectiveness of an AAT is exogenously determined by the underlying technology itself.
Furthermore, we opt for the BCC model as it allows for VRS. In our problem setting, it can be assumed that an increase in cost drivers will not result in an unlimited proportional change of effectiveness (Hastie, Tibshirani, and Friedman Citation2009; Bishop Citation2006). Another convenient advantage of the BCC model is that its VRS assumption additionally mitigates the shortcoming of AATs that are not fully homogeneous. Consequently, our previously mentioned drawback is alleviated by the fact that our BCC approach better accommodates the scale effects between different AATs in the efficiency analysis (Baker and Talluri Citation1997).
The reasons for solving the model using the envelopment form are 3-fold. First, the computational effort is considerably smaller compared to the multiplier model (number of constraints m + s ≪ n). Second, the envelopment form allows us to find an optimal, i.e. zero-slack, solution. Third, the interpretation of results is more straightforward because the solutions are directly related to inputs and outputs that correspond to original data compared to virtual multipliers (Cooper, Seiford, and Tone Citation2006).
Model parametrisation
In the following, we describe (i) cost drivers, (ii) application areas, and (iii) effectiveness measures of AATs in the respective application areas in detail.
Cost drivers
Relevant cost drivers for AATs are (i) data preparation, (ii) modelling, and (iii) estimation costs (Cheng et al. Citation2018; Villanueva Zacarias, Reimann, and Mitschang Citation2018; Hazen et al. Citation2014; Hastie, Tibshirani, and Friedman Citation2009; Kotsiantis, Zaharakis, and Pintelas Citation2007; Wuest et al. Citation2016). Each cost driver is detailed in the following.
Data preparation costs quantify the effort needed for pre-processing. Pre-processing costs for different AATs can vary substantially with respect to missing values, (ii) outliers, (iii) feature engineering (including transformation), and (iv) feature selection. For instance, some AATs, such as deep learning, learn feature representations implicitly and thus largely circumvent the need for manual pre-processing (Goodfellow, Bengio, and Courville Citation2017; LeCun, Bengio, and Hinton Citation2015). The LASSO comes with an implicit capacity for feature selection and thus automatically encourages parsimonious models (i.e. models with fewer parameters). In manufacturing, data pre-processing is usually labour intensive due to known issues in data quality (Hazen et al. Citation2014; Wang et al. Citation2018; Wuest et al. Citation2016).
Modelling costs arise from the manual effort that is needed to develop a model specification. This comprises the selection of both a model architecture and the best hyper-parameter configuration. Modelling costs can vary strongly between different AATs (Hastie, Tibshirani, and Friedman Citation2009; Kotsiantis, Zaharakis, and Pintelas Citation2007). Some models (e.g. regression models) leave only a few degrees of freedom. Other AATs require extensive manual effort to optimize a large set of (hyper-) parameters. This particularly applies to deep learning, where the choice of a suitable architecture is almost as important as hyper-parameter tuning (Kraus, Feuerriegel, and Oztekin Citation2020).
Estimation costs are characterized by computational efficiency. This includes demand for customized hardware (e.g. graphics processing units), required memory, and run-time. These costs vary considerably among different AATs: for instance, some can better handle large-scale data sets or large numbers of predictors (Kraus, Feuerriegel, and Oztekin Citation2020). This is especially relevant in manufacturing, since data-sets are often very large, both in terms of observations and the number of variables (Cheng et al. Citation2018; Villanueva Zacarias, Reimann, and Mitschang Citation2018; Wuest et al. Citation2016).
Application areas of advanced analytics in manufacturing
Multiple application scenarios of advanced analytics in manufacturing have previously been identified (Cheng et al. Citation2018; Choudhary, Harding, and Tiwari Citation2009; Köksal, Batmaz, and Testik Citation2011; Sharp, Ak, and Hedberg Citation2018; Wuest et al. Citation2016; Wolf et al. Citation2019). However, a clear classification of application areas is lacking. We thus conducted a systematic literature review (see Supplementary Appendix A for details) of analytics applications in manufacturing and derived the following classifications that we utilize throughout this paper: (i) production planning, (ii) production scheduling, (iii) quality inspection, (iv) quality driver identification, (v) process control, and (vi) maintenance planning.
Production planning requires accurate forecasts of demand (Chui et al. Citation2018; Esmaeilian, Behdad, and Wang Citation2016; Tao et al. Citation2018). However, this is challenging given that manufacturers are located at the upstream end of a long supply chain with multiple distributors, wholesalers, and retailers between the customer and themselves. This introduces multiple sources of variability and thus impedes straightforward forecasts of demand (Carbonneau, Laframboise, and Vahidov Citation2008). To aid better planning, advanced analytics for demand forecasting can be implemented. This commonly builds upon historical time series models (Ferreira, Lee, and Simchi-Levi Citation2016), which are often expanded by external user data (Boone et al. Citation2018; Chong et al. Citation2017; Cui et al. Citation2018; Lau, Zhang, and Xu Citation2018).
Production scheduling assigns incoming orders to machines based on a predetermined decision objective, e.g. the earliest due dates or the shortest average completion time. Job scheduling can be loosely categorized further into (i) job-shop scheduling and (ii) flow-shop scheduling. In the former, job-shop scheduling, n independent jobs have to be processed by a particular pre-determined subset of m machines, but without explicit orders (Zhang, Song, and Wu Citation2013). In contrast, flow-shop scheduling is characterized by n jobs that have to be processed on the same number of m machines in a sequence (Noroozi, Mokhtari, and Kamal Citation2013).
Quality inspection uses sensor data to analyze the condition of a product, e.g. scrap or good parts (Weimer, Scholz-Reiter, and Shpitalni Citation2016). Quality inspection has become a prevalent automation tool to reduce labour force and increase yield rates in manufacturing (Köksal, Batmaz, and Testik Citation2011; Wu and Zhang Citation2010). For instance, quality inspection based on visual sensing has the great advantage of contactless inspection and is, therefore, not influenced by the type, condition, electromagnetic field, or temperature of the target (Park et al. Citation2016). The inferred quality level is then used to determine whether and in which market a product is sold (Li, Xia, and Yue Citation2019).
Quality driver identification determines root causes that affect the quality (Chen, Tseng, and Wang Citation2005). Examples of such factors are the quality of materials or environmental conditions (e.g. temperature). These factors interact with each other and consequently make it difficult to systematically infer which factor is responsible for poor quality output (Hsu and Chien Citation2007; Kraus and Feuerriegel Citation2019; Tao et al. Citation2018). Once quality drivers have been inferred, actions can afterward be implemented with the objective of process improvement (Zantek, Wright, and Plante Citation2002).
Process control dynamically determines machine parameters so that a target measure is achieved, such as, for instance, maintaining a certain output quality or optimizing energy efficiency (Cheng et al. Citation2018; Elwany, Gebraeel, and Maillart Citation2011). Process control based on manual decision-making is often inefficient due to the abundant number of free parameters in modern manufacturing equipment. In contrast, advanced analytics promises the prospect of choosing parameters that result in improved productivity and product quality, as well as reduced costs (Tao et al. Citation2018).Footnote2
Maintenance planning introduces condition-based services, so that maintenance events are scheduled proactively or when a breakdown is identified to reduce the downtime of manufacturing machinery and tool equipment (Olde Keizer et al. Citation2018; Sharp, Ak, and Hedberg Citation2018). Maintenance planning can be further subdivided depending on whether actions are triggered reactively or proactively. Reactive maintenance infers the (latent) condition of a system in real-time from observable sensor data. Based on this, it triggers maintenance when the condition deteriorates below a certain safety threshold, such as the growth of a fault frequency. A major drawback of reactive maintenance is that it cannot anticipate a breakdown ahead of time. In contrast, proactive maintenance (often termed ‘predictive maintenance’) forecasts the remaining useful life of a system and, on this basis, triggers maintenance events in advance (Mazhar, Kara, and Kaebernick Citation2007; Sharp, Ak, and Hedberg Citation2018). To this end, it looks at the current and past states of the system, as well as its expected future operational load. This has multiple benefits in practice: it prevents breakdowns, prolongs the lifespan, and ensures the availability of spare parts in due course (Tobon-Mejia et al. Citation2012).
Effectiveness measures of AATs in application areas
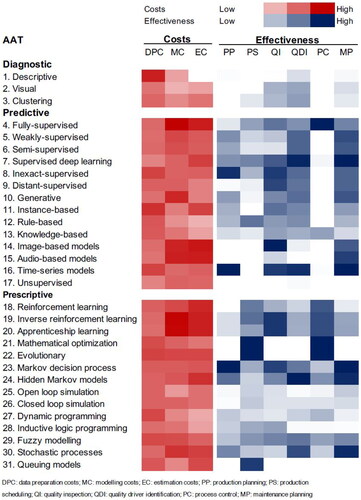
The AATs considered are as follows. We evaluate 31 AATs for our analysis. These AATs were selected based on an extensive review of the existing literature on advanced analytics (see Supplementary Appendix A for details). We subdivide all AATs into three main categories: (i) diagnostic, (ii) predictive, and (iii) prescriptive techniques.
Relevant effectiveness measures for AATs are (i) prediction performance, (ii) interpretability, and (iii) online learning (i.e. the ability of an AAT to be regularly updated with new data). The dimensions of prediction performance and interpretability are commonly used to gauge the suitability of a model. However, these measures are negatively correlated with each other and thus entail a trade-off that must be made for each use case (Hastie, Tibshirani, and Friedman Citation2009). Models with higher prediction performance are often black-box models and thus lack interpretability. Online learning is regarded as a crucial ability in manufacturing (Bang et al. Citation2019; Cheng et al. Citation2018; Sharp, Ak, and Hedberg Citation2018; Wuest et al. Citation2016). For a detailed overview of the evaluation, we refer to Supplementary Appendix B.
We use a ten-point scale to assess each AAT with respect to costs and effectiveness. That is, we followed Hastie, Tibshirani, and Friedman (Citation2009) and Kotsiantis, Zaharakis, and Pintelas (Citation2007) as they provide comprehensive rankings of AATs with respect to data preparation, modelling, and estimation costs, as well as prediction performance, interpretability, and online learning ability. To include domain-specific expertise, we additionally took findings from Wolf et al. (Citation2019) into account. Scoring each AAT according to input and output variables is a crucial task within the presented approach as this includes qualitative and subjective judgement. Therefore, we see this data set as a starting point that can be deliberately adjusted.
shows the resulting parametrization of each AAT. For instance, image-based models usually have high estimation and modelling costs due to a high number of input variables (pixel features) and sophisticated model structures (e.g. a deep convolutional neural network). These AATs often perform best on visual quality inspection tasks, but also for maintenance planning where they can identify potentially deteriorating parts.
Figure 3. Costs and effectiveness intensities across different AATs.
Mathematical formulation
When applying DEA to a group of decision-making units, an optimization problem must be solved for each DMU. In its basic form, a DEA model is a quotient programming problem. This is because the efficiency value of a decision unit is a quotient with the sum of the weighted outputs in the numerator and the sum of the weighted inputs in the denominator.
Let AATj, j = 1,…, n, refer to the DMUs to be evaluated. Furthermore, each AATj is associated with m non-negative inputs xi = (x1,j,…, xm,j) and s non-negative outputs yr = (y1,j, …, ys,j). These are weighted using virtual multipliers vi ≥ 0 for inputs and ur ≥ 0 for outputs (Cooper, Seiford, and Tone Citation2006). Given the input and output data, we measure the relative efficiency θ of each AATj once and hence need n optimizations. Let the AATj to be evaluated on any trail be designated as AATo, o = 1,…, n. For a given AATo, the objective function is thus given by
(4)
(4)
(5)
(5)
(6)
(6)
Put simply, the DEA tries to adapt the individual weights vi and ur to maximize the relative efficiency scalar θ for the AATo under study. EquationEquation (5)(5)
(5) ensures that the efficiency scalar is equal to or below 1 for all AATj, j = 1, …, n. AATs with an efficiency rating of 1 creates the so-called efficiency frontier.
The solution to a quotient programming problem is not easy because the objective function is not linear. Therefore, the problem is transformed into a linear programming problem using the so-called Charnes-Cooper transformation (Cooper, Seiford, and Tone Citation2006).
(7)
(7)
(8)
(8)
(9)
(9)
(10)
(10)
For each AAT, we compute confidence intervals for the bias-corrected efficiencies using a bootstrapping approach (Simar and Wilson Citation1998). The confidence intervals estimate the range within which a true efficiency occurs. This allows us to answer the question of AATs from the same group differ significantly in their efficiency. We provide further mathematical details in Supplementary Appendix C.
Empirical findings
In the following, we apply the proposed framework in two specific industrial settings.
Setting
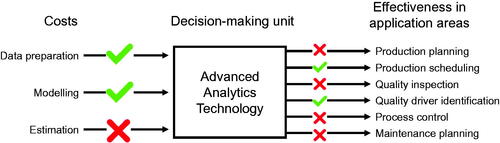
The decision model supports manufacturing companies to decide in which AATs to invest. This question is especially relevant for larger companies that are undergoing a digital transformation. To demonstrate our decision model, we cooperate with two manufacturing companies, namely Geberit Produktions AG and ABB Turbo Systems AG. Geberit Produktions AG manufactures sanitary products for the end-consumer market. ABB Turbo Systems AG constructs turbochargers for vehicles and power facilities. During two separate expert interviews with associated project managers, we identify (i) which application areas are of relevance due to different business needs and (ii) which cost drivers are critical factors with regard to the decision-making process. We use semi-structured interviews (Yin Citation2011) to evaluate the two most important cost drivers and the two most important application areas for each company (see ). In the first part of the interview, the interviewee described the environment of the company. In the second part, the interviewee reveals the current challenges and objectives of their manufacturing division. The third part of the interview asks to rank the different cost and application areas of the model by importance for the setting of the company. These qualitative results from these expert interviews were used to tailor our decision model to the different needs of both firms. The presented cases shall therefore reveal the applicability and illustrate the use of the model.
Figure 4. Exemplary selection of chosen cost drivers and application areas.
Empirical application 1: Geberit Produktions AG
Description
Geberit Produktions AG specializes in manufacturing and supplying sanitary parts and related systems. Geberit is headquartered in Switzerland, it is a leader in the European market and has a global presence through its subsidiaries.
Prospectively, the most relevant application areas for Geberit Produktions AG are production planning, quality driver identification, and process control. Production planning is a key enabler to reduce high inventory levels. Geberit Produktions AG requires production planning to allow for short delivery times to its customers. Quality driver identification is another promising application area for advanced analytics and can help maintain high productivity within production processes. Process control is important since Geberit Produktions AG uses expensive, automated equipment. According to our informants, data preparation and modelling are especially relevant cost drivers. Data preparation costs are critical because Geberit Produktions AG uses decentralized databases for each production plant, which hampers data fusion (Fink, Netland, and Feuerriegel Citation2022). Modelling costs are relevant because of limited expertise in the field of advanced analytics. Estimation costs are regarded as negligible because of existing hardware capacities.
Based on our findings from the expert interview, our model only includes data preparation and modelling costs, as well as the effectiveness of AATs in production planning, quality driver identification, and process control.
Results
shows the results from our DEA. Eight out of 31 AATs show an efficiency rating of θ∗ = 1. However, there are only seven BCC-efficient AATs that satisfy both θ∗ = 1 and (), namely (2.) visual, (4.) fully-supervised, (7.) supervised deep learning, (16.) time-series models, (21.) mathematical optimization, (23.) Markov decision process and (24.) hidden Markov models. Consequently, these AATs also represent the ERS for the remaining 24 inefficient AATs (λj-weights can be found in Supplementary Appendix D). Even though the AAT (17.) unsupervised learning reaches θ∗ = 1, it cannot be considered BCC-efficient because it still shows output shortfalls (5 units for production planning, 9.4 units for quality driver identification, and 0.5 units for process control). All remaining AATs must radially reduce all inputs by their θ∗-value while additionally decreasing present input excesses and increasing present output shortfalls.Footnote3
Table 1. DEA results for Geberit.
There are multiple interpretations of our findings. In line with our expectations, the DEA evaluates mathematical optimization as efficient because these techniques are suitable for process control tasks, for instance, the identification of ideal process parameters. Hidden Markov models are best suited to quality driver identification. These techniques can be used to monitor quality in sequential settings where individual process stages are unobservable. For time-series data, time-series models and Markov decision processes are needed to forecast expected demand from historical production volumes and then schedule the machine processes accordingly. Visual is evaluated to be efficient because these techniques entail relatively low modelling costs and allow for the easy communication of results to the management. Finally, fully-supervised and supervised deep learning are required in all of the above tasks and are therefore evaluated as BCC-efficient.
Empirical application 2: ABB Turbo Systems AG
In the following, we first provide background information on ABB Turbo Systems AG and report on our findings from the expert interview. Then we present the numerical results from our DEA.
Description
ABB Turbo Systems AG is part of ABB AG, a Swiss-Swedish multinational corporation operating mainly in the areas of robotics, power, heavy electrical equipment, and automation technology. ABB Turbo Systems AG produces turbochargers for vessels, diesel trains, power plant facilities, and large construction vehicles.
The most relevant application areas for the manufacturing branch of ABB Turbo Systems AG are quality inspection and maintenance planning. Quality inspection is especially important to identify potential fine fissures after the friction welding process. Maintenance planning is crucial to reduce production downtime because redundant assembly capacities do not exist. According to our interviews, data preparation and modelling are relevant cost drivers of analytics projects. Data preparation costs are critical because of multiple proprietary interfaces. Modelling costs are relevant because of limited expertise in the field of advanced analytics. Estimation costs are regarded as fairly negligible because of existing hardware capacities.
Based on our findings from the expert interview, our model only includes data preparation and modelling costs, as well as the effectiveness of AATs in quality inspection and maintenance planning.
Results
shows the results from our DEA. In this case, six out of 31 AATs show an efficiency rating θ∗ = 1. However, there are only five BCC-efficient AATs that satisfy both θ∗ = 1 and (), namely (2.) visual, (7.) supervised deep learning, (14.) image-based models, (16.) time-series models, and (23.) Markov decision process (λj-weights can be found in Supplementary Appendix E). Compared to the case of Geberit Produktions AG, the DEA yields a different selection of efficient AATs, which is tailored to the application requirements of ABB Turbo Systems AG.
Table 2. DEA results for ABB.
The selection can be interpreted as follows. Our decision model evaluates supervised deep learning and image-based models as efficient because these techniques are best suited to visual quality inspection tasks. Supervised deep learning techniques can automatically learn features from high-dimensional data and hence are especially suited to learning patterns from unstructured image or audio data (Wang et al. Citation2018; Wuest et al. Citation2016). Time-series models and Markov decision processes are suitable solutions for predictive maintenance. Finally, visual AATs are also evaluated to be efficient because these techniques allow one to easily communicate results to the management of a traditional manufacturing company.
Summary of findings
The numerical results of Geberit Produktions AG and ABB Turbo Systems AG demonstrate the ability of our decision model to provide customized recommendations regarding the set of efficient AATs to which resources should be allocated. Each DEA evaluates a selection of fairly different AATs. Both selections include visual, supervised deep learning, times-series models, and a Markov decision process. However, for Geberit Produktions AG, our decision model additionally incorporates fully-supervised, mathematical optimization and hidden Markov models into the selection of efficient AATs. This is due to their need for process control and quality driver identification in multi-stage process lines. For ABB Turbo Systems AG, image-based models are further determined to be efficient due to the firm’s requirement for inspection services.
Discussion
Contributions to research
For the production management literature, the DEA represents a powerful tool for multi-criteria decision-making. In the past, the DEA has been widely applied for (i) intra-organizational comparisons (e. g. projects, different sub-units), (ii) inter-organizational comparisons (e.g. companies operating in the same domain), and (iii) longitudinal, panel, or dynamic comparisons of a single unit (Liu, Lu, and Lu Citation2016). Our study contributes to category (i) by evaluating the relative efficiency of different AATs within a manufacturing company.
Our research extends the literature in at least two directions. First, we study common application areas in manufacturing where advanced analytics can add value. Second, we propose relevant cost drivers and effectiveness measures that can be used to assess the efficiency of different AATs. Ultimately, we address an important management decision problem: in which selection of AATs should a manufacturing company invest? To the best of our knowledge, we are the first to use a DEA model for this purpose.
Generalisability and extensibility
The proposed method builds upon different literature streams on advanced analytics in manufacturing and decision support systems. Hence, we see no theoretical reason, why the proposed model should not be generalizable beyond the cases presented in this paper. The application of the method in the two industrial cases illustrated that the method could be applied and yield concrete insights. Both cases showed how applying the model to the specific environments can support the decision-making on investments in AATs. Following the different modes of generalization as described by Lee and Baskerville (Citation2003), the goal of this study is to test and validate the utility of the presented approach in an actual business setting. Hence, even though the method was tested in only two cases, we posit that the approach is transferable to further use cases not only in manufacturing: Its flexible design can help to solve similar allocation problems for use cases outside of manufacturing management and thus ensures widespread applicability.
The generalisability is shown based on two existing cases. The industrial cases were chosen from the manufacturing sector; specifically from companies implementing digital technologies (i.e. first experience with it). For other companies in this setting, the method will demonstrate similar usability and applicability as in the presented cases.
Further, our approach has similar limitations to previous DEA applications (cf. Dyson et al. Citation2001). One key assumption for applying the DEA is that the DMUs under evaluation are homogeneous, meaning that they (i) undertake the same activity with similar objectives, (ii) have similar ranges of resources, and (iii) operate in similar environments (Cooper, Seiford, and Tone Citation2006). However, in our research, AATs are not expected to be fully homogeneous since they are based on different underlying technologies. As a remedy, Cook et al. (Citation2012) and Cook et al. (Citation2013) proposed to break the set of AATs into different groups with those that show the same outputs being in the same group. Within these different groups, separate DEA can be computed. However, the greater the number of required splits, the more difficult it is to estimate meaningful efficiency (Cook et al. Citation2012). Additionally, in many situations, inputs and outputs are volatile and complex so that they are difficult to measure in an accurate way. One way to include this volatility into the computation of the technology frontier is through stochastic frontier analysis (SFA) (Aigner, Lovell, and Schmidt Citation1977). SFA assumes stochastic relationships between the inputs used and the outputs produced. Specifically, it allows to assume that deviations from the frontier may reflect not only inefficiencies but also noise in the data. Although this approach seems intriguing, it comes with the drawback of making strong a priori assumptions about the function translating inputs to outputs and about the data generation process. These assumptions are specifically critical in cases with few DMUs, such as ours. It is expected that, with further advances in artificial intelligence, the range of suitable areas is likely to grow. Hence, users should carefully consider adaptations to their company-specific needs. We recommend leaving this task to domain experts (e.g., process engineers) with a background in analytics. They possess the relevant knowledge to assess the suitability of AATs for domain-specific problems.
The strength of our proposed decision model lies in its extensibility. We successfully demonstrate its flexibility by applying it to two manufacturing companies with different requirements. The capacity of our model to be customized according to companies’ needs is a key advantage. This allows management to include different application areas or cost drivers that better represent the decision-making process. Accordingly, the use of our decision model is not only limited to manufacturing management but could be extended to other business units in a straightforward manner.
Managerial implications
This work addresses an important management decision problem: in which advanced analytics techniques should a manufacturing company invest? By selecting a set of efficient AATs, our research addresses the complex task of allocating resources (e.g. financial and human resources) in the domain of advanced analytics.
Our research proposes an approach that can lead to valuable managerial guidance and actions for managers in manufacturing. The recommended selection of AATs can be used along various dimensions. First, managers can improve human resource allocation by hiring data scientists with the necessary qualifications (i.e. those that are part of the selection). Second, decision-makers can steer short-term financial investments into efficient AATs that solve present problems with respect to relevant application areas. Third, managers can later start to invest in AATs that were not found to be BCC-efficient but still show high-efficiency scores (e.g. >0.95). Accordingly, our approach not only benefits financial allocation in the short-term but also provides guidance for long-term strategic development to harness the full potential of advanced analytics in manufacturing.
In practice, choosing the right set of AATs in manufacturing is a complex task. We agree that it requires multiple approaches to do a final selection of AATs (e.g. Villanueva Zacarias, Reimann, and Mitschang Citation2018; Lechevalier et al. Citation2018). The proposed DEA model marks a starting point to support the decision process by suggesting efficient solutions. This is an important step as it reduces the complexity of the decision under uncertainty by suggesting a pre-selection out of the long list of existing AATs. However, as it remains as a decision support model, it cannot provide a final solution. Hence, from the pre-selected list of efficient AATs, practitioners need to further investigate with which they want to continue. We further recommend to embed this process in the cross-industry standard process for data mining, a well-established open standard process model for data mining in the industry.
Conclusion
Advanced analytics offers new ways to improve and innovate manufacturing processes. However, the practical implementation of advanced analytics is still in its early stages. Hence, decision-makers are left with the complex task of allocating resources (e.g. financial and human) to a set of efficient AATs that entails the highest company-specific economic benefit.
This paper proposes a multi-criteria decision model to identify a set of efficient AATs to address relevant, company-specific needs. Our research is a pivotal, yet heretofore missing, element to foster the use of advanced analytics in manufacturing. The effectiveness of our decision model was demonstrated in two manufacturing companies, Geberit Produktions AG and ABB Turbo Systems AG. Our numerical results identify a tailored set of efficient AATs for each company. Thereby, we offer a decision support tool that can effectively facilitate resource allocation in the domain of advanced analytics.
TPPC_2126951_Supplementary_Material
Download PDF (695.9 KB)Acknowledgements
The authors would like to thank Geberit Produktions AG in Jona and ABB Turbo Systems AG in Baden for their valuable input on this topic, which greatly assisted the research.
Additional information
Notes on contributors

Rafael Lorenz
Rafael Lorenz holds a Ph.D. from ETH Zurich where he graduated from the Chair of Production and Operations Management (POM). His doctoral thesis focused on the effective use of digital technologies to enhance lean production systems. His research was published in leading journals, including the International Journal of Operations & Production Management and the International Journal of Production Research.

Mathias Kraus
Mathias Kraus holds the Assistant Professorship for Data Analytics at the Institute of Information Systems at FAU Erlangen-Nürnberg. Before that, he worked as a research assistant at ETH Zurich and University of Freiburg. The main objective of his research is to develop innovative methodology from the fields of statistics, machine learning, and big data to contribute to further research developments in data-driven decision support across various tasks.

Hergen Wolf
Hergen Wolf studied Industrial Engineering at Technical University Dresden. For his master’s thesis, he joined the Chair of Management Information Systems (MIS) at ETH Zurich. His research focussed on applications of advanced analytics techniques in manufacturing and was published at the APMS. After his studies, Hergen joined Sunfire, a German clean-tech company that develops industrial electrolyzers for the production of renewable hydrogen. As Director Product Management, he is today responsible for Sunfire’s strategic product and service development.

Stefan Feuerriegel
Stefan Feuerriegel is a full professor at LMU Munich School of Management at LMU Munich, where he heads the Institute of AI in Management. Previously, he was an assistant professor at ETH Zurich. In his research, Stefan develops, implements, and evaluates Artificial Intelligence technologies that improve management decision-making.

Torbjørn H. Netland
Torbjørn H. Netland is the Head of Chair of Production and Operations Management (www.pom.ethz.ch) at ETH Zurich, Switzerland, and Co-founder of EthonAI. He is a Member of the World Economic Forum’s Global Future Council on Advanced Manufacturing and Value Chains and a Fellow of the European Academy for Industrial Management. His research on manufacturing excellence appears in leading scientific journals, such as Management Science, Journal of Operations Management, Production and Operations Management, MIT Sloan Management Review, International Journal of Operations & Production Management, and Production Planning and Control. He is co-author of the textbook Introduction to Manufacturing: An Industrial Engineering and Management Perspective (Routledge 2022). He is also the recipient of two Shingo Research Awards and numerous teaching awards.
Notes
1 In this paper, AATs subsume all algorithms from the wider realm of artificial intelligence and machine learning that aid data-driven decision-making.
2 In theory, process control represents a natural application for (safe) reinforcement learning techniques (Sutton and Barto Citation2018); however, research in this field is still in its infancy and, instead, problem-specific algorithms are usually developed.
3 For instance, in order to be considered BCC-efficient, the AAT (18.) reinforcement learning must decrease its inputs radially by 0.988 and additionally increase its output for production planning by 0.508 units and for quality driver identification by 1.14 units.
References
- Aigner, D., C. K. Lovell, and P. Schmidt. 1977. “Formulation and Estimation of Stochastic Frontier Production Function Models.” Journal of Econometrics 6 (1): 21–37. doi:10.1016/0304-4076(77)90052-5.
- Almohri, H., R. B. Chinnam, and M. Colosimo. 2019. “Data-Driven Analytics for Benchmarking and Optimizing the Performance of Automotive Dealerships.” International Journal of Production Economics 213: 69–80. doi:10.1016/j.ijpe.2019.03.004.
- Baker, R. C., and S. Talluri. 1997. “A Closer Look at the Use of Data Envelopment Analysis for Technology Selection.” Computers & Industrial Engineering 32 (1): 101–108. doi:10.1016/S0360-8352(96)00199-4.
- Bang, S. H., R. Ak, A. Narayanan, Y. T. Lee, and H. Cho. 2019. “A Survey on Knowledge Transfer for Manufacturing Data Analytics.” Computers in Industry 104: 116–130. doi:10.1016/j.compind.2018.07.001.
- Banker, R., A. Charnes, and W. W. Cooper. 1984. “Some Models for Estimating Technical and Scale Inefficiencies in Data Envelopment Analysis.” Journal of Manufacturing Science and Engineering 30: 1078–1092.
- Bishop, C. M. 2006. Pattern Recognition and Machine Learning. New York, NY: Springer.
- Bogetoft, P., and L. Otto. 2011. Benchmarking with DEA, SFA, and R. New York, NY: Springer.
- Boone, T., R. Ganeshan, R. L. Hicks, and N. R. Sanders. 2018. “Can Google Trends Improve Your Sales Forecast?” Production and Operations Management 27 (10): 1770–1774. doi:10.1111/poms.12839.
- Braglia, M., and A. Petroni. 1999. “Data Envelopment Analysis for Dispatching Rule Selection.” Production Planning & Control 10 (5): 454–461. doi:10.1080/095372899232984.
- Braglia, M., S. Zanoni, and L. Zavanella. 2003. “Measuring and Benchmarking Productive Systems Performances Using DEA: An Industrial Case.” Production Planning & Control 14 (6): 542–554. doi:10.1080/09537280310001621994.
- Carbonneau, R., K. Laframboise, and R. Vahidov. 2008. “Application of Machine Learning Techniques for Supply Chain Demand Forecasting.” European Journal of Operational Research 184 (3): 1140–1154. doi:10.1016/j.ejor.2006.12.004.
- Charnes, A., W. W. Cooper, and E. Rhodes. 1978. “Measuring the Efficiency of Decision Making Units.” European Journal of Operational Research 2 (6): 429–444. doi:10.1016/0377-2217(78)90138-8.
- Chehbi-Gamoura, S., R. Derrouiche, D. Damand, and M. Barth. 2019. “Insights from Big Data Analytics in Supply Chain Management: An All-Inclusive Literature Review Using the SCOR Model.” Production Planning & Control 7: 1–27.
- Chen, W. C., S. S. Tseng, and C. Y. Wang. 2005. “A Novel Manufacturing Defect Detection Method Using Association Rule Mining Techniques.” Expert Systems with Applications 29 (4): 807–815. doi:10.1016/j.eswa.2005.06.004.
- Chen, Y., W. D. Cook, and S. Lim. 2019. “Preface: DEA and Its Applications in Operations and Data Analytics.” Annals of Operations Research 278 (1–2): 1–4. doi:10.1007/s10479-019-03243-w.
- Cheng, Y., K. Chen, H. Sun, Y. Zhang, and F. Tao. 2018. “Data and Knowledge Mining with Big Data towards Smart Production.” Journal of Industrial Information Integration 9: 1–13. doi:10.1016/j.jii.2017.08.001.
- Choi, T. M., S. W. Wallace, and Y. Wang. 2018. “Big Data Analytics in Operations Management.” Production and Operations Management 27 (10): 1868–1883. doi:10.1111/poms.12838.
- Chong, A. Y. L., E. Ch’ng, M. J. Liu, and B. Li. 2017. “Predicting Consumer Product Demands via Big Data: The Roles of Online Promotional Marketing and Online Reviews.” International Journal of Production Research 55 (17): 5142–5156. doi:10.1080/00207543.2015.1066519.
- Choudhary, A. K., J. A. Harding, and M. K. Tiwari. 2009. “Data Mining in Manufacturing: A Review Based on the Kind of Knowledge.” Journal of Intelligent Manufacturing 20 (5): 501–521. doi:10.1007/s10845-008-0145-x.
- Chui, M., J. Manyika, M. Miremadi, N. Henke, R. Chung, P. Nel, and S. Malhotra. 2018. Notes from the AI Frontier: Insights from Hundreds of Use Cases.” McKinsey Global Institute.
- Cook, W. D., J. Harrison, R. Imanirad, P. Rouse, and J. Zhu. 2013. “Data Envelopment Analysis with Nonhomogeneous DMUs.” Operations Research 61 (3): 666–676. doi:10.1287/opre.2013.1173.
- Cook, W. D., J. Harrison, P. Rouse, and J. Zhu. 2012. “Relative Efficiency Measurement: The Problem of a Missing Output in a Subset of Decision Making Units.” European Journal of Operational Research 220 (1): 79–84. doi:10.1016/j.ejor.2012.01.022.
- Cook, W. D., M. Kress, and L. M. Seiford. 1993. “On the Use of Ordinal Data in Data Envelopment Analysis.” Journal of the Operational Research Society 44 (2): 133–140. doi:10.1057/jors.1993.25.
- Cooper, W. W., L. M. Seiford, and J. Zhu. 2011. Handbook on Data Envelopment Analysis. Boston, MA: Springer.
- Cooper, W. W., L. M. Seiford, and K. Tone. 2006. Introduction to Data Envelopment Analysis and Its Uses: With DEA-Solver Software and References. Boston, MA: Springer.
- Cui, R., S. Gallino, A. Moreno, and D. J. Zhang. 2018. “The Operational Value of Social Media Information.” Production and Operations Management 27 (10): 1749–1769. doi:10.1111/poms.12707.
- De-Arteaga, M., S. Feuerriegel, and M. Saar-Tsechansky. 2022. “Algorithmic Fairness in Business Analytics: Directions for Research and Practice.” Production and Operations Management.
- Dogan, A., and D. Birant. 2021. “Machine Learning and Data Mining in Manufacturing.” Expert Systems with Applications 166: 114060. doi:10.1016/j.eswa.2020.114060.
- Doyle, J. 1991. “Comparing Products Using Data Envelopment Analysis.” Omega 19 (6): 631–638. doi:10.1016/0305-0483(91)90012-I.
- Doyle, J., and R. Green. 1993. “Data Envelopment Analysis and Multiple Criteria Decision Making.” Omega 21 (6): 713–715. doi:10.1016/0305-0483(93)90013-B.
- Dyson, R. G., R. Allen, A. S. Camanho, V. V. Podinovski, C. S. Sarrico, and E. A. Shale. 2001. “Pitfalls and Protocols in DEA.” European Journal of Operational Research 132 (2): 245–259. doi:10.1016/S0377-2217(00)00149-1.
- Elwany, A. H., N. Z. Gebraeel, and L. M. Maillart. 2011. “Structured Replacement Policies for Components with Complex Degradation Processes and Dedicated Sensors.” Operations Research 59 (3): 684–695. doi:10.1287/opre.1110.0912.
- Emrouznejad, A., and G. I. Yang. 2018. “A Survey and Analysis of the First 40 Years of Scholarly Literature in DEA: 1978–2016.” Socio-Economic Planning Sciences 61: 4–8. doi:10.1016/j.seps.2017.01.008.
- Esmaeilian, B., S. Behdad, and B. Wang. 2016. “The Evolution and Future of Manufacturing: A Review.” Journal of Manufacturing Systems 39: 79–100. doi:10.1016/j.jmsy.2016.03.001.
- Feng, Q., and J. G. Shanthikumar. 2018. “How Research in Production and Operations Management May Evolve in the Era of Big Data.” Production and Operations Management 27 (9): 1670–1684. doi:10.1111/poms.12836.
- Ferreira, K. J., B. H. A. Lee, and D. Simchi-Levi. 2016. “Analytics for an Online Retailer: Demand Forecasting and Price Optimization.” Manufacturing & Service Operations Management 18 (1): 69–88. doi:10.1287/msom.2015.0561.
- Feuerriegel, S., Y. R. Shrestha, Georg von Krogh, and C. Zhang. 2022. “Bringing Artificial Intelligence to Business Management.” Nature Machine Intelligence 4 (7): 611–613. doi:10.1038/s42256-022-00512-5.
- Fink, O., T. H. Netland, and S. Feuerriegel. 2022. “Artificial Intelligence across Company Borders.” Communications of the ACM 65 (1): 34–36. doi:10.1145/3470449.
- Fleming, O., T. Fountaine, N. Henke, and T. Saleh. 2018. Ten Red Flags Signalling Your Analytics Program Will Fail. McKinsey Global Institute.
- Golany, B., and Y. Roll. 1989. “An Application Procedure for DEA.” Omega 17 (3): 237–250. doi:10.1016/0305-0483(89)90029-7.
- Goodfellow, I., Y. Bengio, and A. Courville. 2017. Deep Learning. Cambridge, MA: MIT Press.
- Hastie, T., R. Tibshirani, and J. H. Friedman. 2009. The Elements of Statistical Learning: Data Mining, Inference, and Prediction. New York, NY: Springer.
- Hazen, B. T., C. A. Boone, J. D. Ezell, and L. A. Jones-Farmer. 2014. “Data Quality for Data Science, Predictive Analytics, and Big Data in Supply Chain Management: An Introduction to the Problem and Suggestions for Research and Applications.” International Journal of Production Economics 154: 72–80. doi:10.1016/j.ijpe.2014.04.018.
- Henke, N., J. Bughin, M. Chui, J. Manyika, T. Saleh, B. Wiseman, and G. Sethupathy. 2016. The Age of Analytics: Competing in a Data-Driven World. McKinsey Global Institute.
- Hsu, S. C., and C. F. Chien. 2007. “Hybrid Data Mining Approach for Pattern Extraction from Wafer Bin Map to Improve Yield in Semiconductor Manufacturing.” International Journal of Production Economics 107 (1): 88–103. doi:10.1016/j.ijpe.2006.05.015.
- Jagoda, K., and P. Thangarajah. 2014. “A DEA Approach for Improving Productivity of Packaging Production Lines: A Case Study.” Production Planning & Control 25 (2): 193–202. doi:10.1080/09537287.2013.783150.
- Köksal, G., I. Batmaz, and M. C. Testik. 2011. “A Review of Data Mining Applications for Quality Improvement in Manufacturing Industry.” Expert Systems with Applications 38 (10): 13448–13467. doi:10.1016/j.eswa.2011.04.063.
- Kotsiantis, S. B., I. Zaharakis, and P. Pintelas. 2007. “Supervised Machine Learning: A Review of Classification Techniques.” Emerging Artificial Intelligence Applications in Computer Engineering 160: 3–24.
- Kraus, M., S. Feuerriegel, and A. Oztekin. 2020. “Deep Learning in Business Analytics and Operations Research: Models, Applications and Managerial Implications.” European Journal of Operational Research 281 (3): 628–641. doi:10.1016/j.ejor.2019.09.018.
- Kraus, M., and S. Feuerriegel. 2019. “Forecasting Remaining Useful Life: Interpretable Deep Learning Approach via Variational Bayesian Inferences.” Decision Support Systems 125: 113100. doi:10.1016/j.dss.2019.113100.
- Kusiak, A. 2017. “Smart Manufacturing Must Embrace Big Data.” Nature 544 (7648): 23–25. doi:10.1038/544023a.
- Lau, R. Y. K., W. Zhang, and W. Xu. 2018. “Parallel Aspect-Oriented Sentiment Analysis for Sales Forecasting with Big Data.” Production and Operations Management 27 (10): 1775–1794. doi:10.1111/poms.12737.
- LaValle, S., M. Hopkins, E. R. S. Lesser, and N. Kruschwitz. 2011. “Big Data, Analytics and the Path from Insights to Value.” MIT Sloan Management Review 52: 21–32.
- Lechevalier, D., A. Narayanan, S. Rachuri, and S. Foufou. 2018. “A Methodology for the Semi-Automatic Generation of Analytical Models in Manufacturing.” Computers in Industry 95: 54–67. doi:10.1016/j.compind.2017.12.005.
- LeCun, Y., Y. Bengio, and G. Hinton. 2015. “Deep Learning.” Nature 521 (7553): 436–444. doi:10.1038/nature14539.
- Lee, A. S., and R. L. Baskerville. 2003. “Generalizing Generalizability in Information Systems Research.” Information Systems Research 14 (3): 221–243. doi:10.1287/isre.14.3.221.16560.
- Lee, H. L. 2018. “Big Data and the Innovation Cycle.” Production and Operations Management 44: 87.
- Li, R., Y. Xia, and X. Yue. 2019. “Scrap or Sell: The Decision on Production Yield Loss.” Production and Operations Management 28 (6): 1486–1502. doi:10.1111/poms.13000.
- Liu, J. S., L. Y. Lu, and W. M. Lu. 2016. “Research Fronts in Data Envelopment Analysis.” Omega 58: 33–45. doi:10.1016/j.omega.2015.04.004.
- Lorenz, R., C. Benninghaus, T. Friedli, and T. H. Netland. 2020. “Digitization of Manufacturing: The Role of External Search.” International Journal of Operations & Production Management 40 (7/8): 1129–1152. doi:10.1108/IJOPM-06-2019-0498.
- Lorenz, R., J. Senoner, W. Sihn, and T. Netland. 2021. “Using Process Mining to Improve Productivity in Make-to-Stock Manufacturing.” International Journal of Production Research 59 (16): 4869–4880. doi:10.1080/00207543.2021.1906460.
- Mahmood, M. A., K. J. Pettingell, and A. I. Shaskevich. 1996. “Measuring Productivity of Software Projects: A Data Envelopment Analysis Approach.” Decision Sciences 27 (1): 57–80. doi:10.1111/j.1540-5915.1996.tb00843.x.
- Manyika, J., M. Chui, B. Brown, J. Bughin, R. Dobbs, C. Roxburgh, and A. H. Byers. 2011. Big Data: The Next Frontier for Innovation, Competition, and Productivity. McKinsey Global Institute.
- Mazhar, M., S. Kara, and H. Kaebernick. 2007. “Remaining Life Estimation of Used Components in Consumer Products: Life Cycle Data Analysis by Weibull and Artificial Neural Networks.” Journal of Operations Management 25 (6): 1184–1193. doi:10.1016/j.jom.2007.01.021.
- Misic, V. V., and G. Perakis. 2019. “Data analytics in Operations Management: A Review.” Manufacturing & Service Operations Management 22 (1): 158–169.
- Noroozi, A., H. Mokhtari, and IN. Kamal. 2013. “Research on Computational Intelligence Algorithms with Adaptive Learning Approach for Scheduling Problems with Batch Processing Machines.” Neurocomputing 101: 190–203. doi:10.1016/j.neucom.2012.08.011.
- Olde Keizer, M. C., R. H. Teunter, J. Veldman, and M. Z. Babai. 2018. “Condition-Based Maintenance for Systems with Economic Dependence and Load Sharing.” International Journal of Production Economics 195: 319–327. doi:10.1016/j.ijpe.2017.10.030.
- Park, J. K., B. K. Kwon, J. H. Park, and D. J. Kang. 2016. “Machine Learning-Based Imaging System for Surface Defect Inspection.” International Journal of Precision Engineering and Manufacturing-Green Technology 3 (3): 303–310. doi:10.1007/s40684-016-0039-x.
- Rudin, C. 2019. “Stop Explaining Black Box Machine Learning Models for High Stakes Decisions and Use Interpretable Models instead.” Nature Machine Intelligence 1 (5): 206–215. doi:10.1038/s42256-019-0048-x.
- Schuh, G., J. P. Prote, T. Busam, R. Lorenz, and T. Netland. 2019. “Using Prescriptive Analytics to Support the Continuous Improvement Process.” IFIP International Conference on Advances in Production Management Systems, 46–53. Springer.
- Senoner, J., T. H. Netland, and S. Feuerriegel. 2022. “Using Explainable Artificial Intelligence to Improve Process Quality: Evidence from Semiconductor Manufacturing.” Management Science 68 (8): 5704–5723. doi:10.1287/mnsc.2021.4190.
- Sharp, M., R. Ak, and T. Hedberg. 2018. “A Survey of the Advancing Use and Development of Machine Learning in Smart Manufacturing.” Journal of Manufacturing Systems 48: 170–179. doi:10.1016/j.jmsy.2018.02.004.
- Simar, L., and P. W. Wilson. 1998. “Sensitivity Analysis of Efficiency Scores: How to Bootstrap in Nonparametric Frontier Models.” Management Science 44 (1): 49–61. doi:10.1287/mnsc.44.1.49.
- Sivarajah, U., M. M. Kamal, Z. Irani, and V. Weerakkody. 2017. “Critical Analysis of Big Data Challenges and Analytical Methods.” Journal of Business Research 70: 263–286. doi:10.1016/j.jbusres.2016.08.001.
- Sony, M., and S. Naik. 2019. “Critical Factors for the Successful Implementation of Industry 4.0: A Review and Future Research Direction.” Production Planning & Control 40: 1–17.
- Stentoft, J., K. Adsbøll Wickstrøm, K. Philipsen, and A. Haug. 2021. “Drivers and Barriers for Industry 4.0 Readiness and Practice: empirical Evidence from Small and Medium-Sized Manufacturers.” Production Planning & Control 32 (10): 811–828. doi:10.1080/09537287.2020.1768318.
- Sutton, R. S., and A. Barto. 2018. Reinforcement Learning: An Introduction. Adaptive Computation and Machine Learning. Cambridge, MA: MIT Press.
- Tao, F., Q. Qi, A. Liu, and A. Kusiak. 2018. “Data-Driven Smart Manufacturing.” Journal of Manufacturing Systems 48: 157–169. doi:10.1016/j.jmsy.2018.01.006.
- Tobon-Mejia, D. A., K. Medjaher, N. Zerhouni, and G. Tripot. 2012. “A Data-Driven Failure Prognostics Method Based on Mixture of Gaussians Hidden Markov Models.” IEEE Transactions on Reliability 61 (2): 491–503. doi:10.1109/TR.2012.2194177.
- Villanueva Zacarias, A. G., P. Reimann, and B. Mitschang. 2018. “A Framework to Guide the Selection and Configuration of Machine-Learning-Based Data Analytics Solutions in Manufacturing.” Procedia CIRP 72: 153–158. doi:10.1016/j.procir.2018.03.215.
- Wang, J., Y. Ma, L. Zhang, R. X. Gao, and D. Wu. 2018. “Deep Learning for Smart Manufacturing: Methods and Applications.” Journal of Manufacturing Systems 48: 144–156. doi:10.1016/j.jmsy.2018.01.003.
- Weimer, D., B. Scholz-Reiter, and M. Shpitalni. 2016. “Design of Deep Convolutional Neural Network Architectures for Automated Feature Extraction in Industrial Inspection.” CIRP Annals 65 (1): 417–420. doi:10.1016/j.cirp.2016.04.072.
- Wolf, H., R. Lorenz, M. Kraus, S. Feuerriegel, and T. Netland. 2019. “Bringing Advanced Analytics to Manufacturing: A Systematic Mapping.” IFIP Advances in Information and Communication Technology.
- Wu, L., and J. Zhang. 2010. “Fuzzy Neural Network Based Yield Prediction Model for Semiconductor Manufacturing System.” International Journal of Production Research 48 (11): 3225–3243. doi:10.1080/00207540902795307.
- Wuest, T., D. Weimer, C. Irgens, and K. D. Thoben. 2016. “Machine Learning in Manufacturing: Advantages, Challenges, and Applications.” Production & Manufacturing Research 4 (1): 23–45. doi:10.1080/21693277.2016.1192517.
- Yin, R. K. 2011. Applications of Case Study Research. London: Sage.
- Zangiacomi, A., E. Pessot, R. Fornasiero, M. Bertetti, and M. Sacco. 2019. “Moving towards Digitalization: A Multiple Case Study in Manufacturing.” Production Planning & Control 450: 1–15.
- Zantek, P. F., G. P. Wright, and R. D. Plante. 2002. “Process and Product Improvement in Manufacturing Systems with Correlated Stages.” Journal of Manufacturing Science and Engineering 48: 591–606.
- Zhang, R., S. Song, and C. Wu. 2013. “A Hybrid Artificial Bee Colony Algorithm for the Job Shop Scheduling Problem.” International Journal of Production Economics 141 (1): 167–178. doi:10.1016/j.ijpe.2012.03.035.