Abstract
Neurophysiological and computational studies have proposed that properties of natural images have a prominent role in shaping selectivity of neurons in the visual cortex. An important property of natural images that has been studied extensively is the inherent redundancy in these images. In this paper, the concept of category-specific redundancies is introduced to describe the complex pattern of dependencies between responses of linear filters to natural images. It is proposed that structural similarities between images of different object categories result in dependencies between responses of linear filters in different spatial scales. It is also proposed that the brain gradually removes these dependencies in different areas of the ventral visual hierarchy to provide a more efficient representation of its sensory input. The authors proposed a model to remove these redundancies and trained it with a set of natural images using general learning rules that are developed to remove dependencies between responses of neighbouring neurons. Results of experiments demonstrate the close resemblance of neuronal selectivity between different layers of the model and their corresponding visual areas.
1. Introduction
One of the major challenges in studies of the ventral visual pathway is to determine the mechanism through which the input image representation is transformed from simple on-off representation of LGN cells to firings of inferotemporal cortex (IT) neurons that are sensitive to the presence of complex objects such as faces. Along the ventral visual pathway, which is thought to process object identity information, complexity of preferred stimulus and receptive field, size of neurons increases from lower to higher areas (Hubel and Wiesel Citation1962; Tanaka Citation1994; Pasupathy and Connor Citation2001; Hegdé and Van Essen Citation2003). In primary areas of this pathway, neurons are selective to specific configuration of intensity in their receptive field, with little or no tolerance to changes in its position (Hubel and Wiesel Citation1962). However, neurons in higher order areas such as V4 or IT are tuned to complex stimuli such as faces or hands and exhibit largely invariant responses to rotations or spatial changes of their preferred stimulus (Desimone Citation1991; Tanaka Citation1994; Logothetis, Pauls and Poggio Citation1995).
An indispensable factor in the development of neuronal selectivities in the visual cortex is the statistical redundancy in natural images. Natural sounds and images differ from white noise, which is comprised of statistically independent components. Natural images are highly structured and there exists statistical dependency between components of their representation in LGN cells (Dan, Atick and Reid Citation1996). Barlow Citation(1961), in his ‘efficient coding’ hypothesis, suggests that sensory cortices in brain remove these redundancies and produce an efficient representation of their input based on which higher order areas of brain operate. Similar theories have been proposed by other researchers in different contexts (Attneave Citation1954; Laughlin Citation1981; Atick Citation1992; Field Citation1994).
The simplest form of redundancy prevalent in natural images is the correlation between neighbouring pixels. Linear transformations such as ICA (Bell and Sejnowski Citation1997) and sparse coding (Olshausen and Field Citation1996), developed to remove these dependencies, produce band-pass filters similar to the selectivities of simple cells in the primary visual cortex. However, these methods can only remove linear dependencies in natural images. Several studies have reported ‘residual dependencies’ between coefficients of linear filters such as ICA basis functions (Zetzsche, Wegmann and Barth Citation1993; Simoncelli Citation1997). In these dependencies, the variance of responses of one linear filter changes as the responses of its spatially neighbouring filters change.
Hyvärinen, Hoyer and Inki Citation(2001) used these residual dependencies to produce a topographic representation of the input image. Wainwright and Simoncelli Citation(2000) used a Gaussian scale mixture (GSM) model to describe the variance dependencies observed in responses of linear filters to natural images. In GSM, a random variable known as common variance source is multiplied with independent Gaussian variables to produce signals that exhibit variance dependency. Schwartz and Simoncelli Citation(2001) used divisive normalisation to remove non-linear variance dependencies between responses of a set of ICA filters and could simulate the contrast invariant orientation tuning and gain control mechanism observed in V1 neurons. Hyvärinen and Hoyer Citation(2000) used energies of responses of filters in independent subspaces to model the shift and phase invariance properties of complex cells.
Top-down or generative models try to uncover the underlying factors of natural images and the mechanism through which they are combined to generate these images. Higher order factors or components, usually known as variance sources, are assumed to be statistically independent. A layer of non-linear transformation is applied to these variance sources to generate the pattern of responses observed in linear filters. These models can learn higher order structures in natural images by inferring the transformation matrix between variance sources and linear filters’ responses using a set of natural images (Karklin and Lewicki Citation2003; Valpola, Harva and Karhunen Citation2004; Park and Lee Citation2005). Recent generative models concern the problem of assigning variance sources to Gaussian signals based on the current context to account for the non-stationary distribution of linear filters’ responses to different natural images (Karklin and Lewicki Citation2005; Schwartz, Sejnowski and Dayan Citation2006).
Despite the great number of studies on statistical dependencies of linear filters and numerous models that simulate selectivities of neurons by removing redundancies in natural images, there has been no progress in extending these results to neuronal selectivities in extrastriate visual areas such as V2 and V4. In this paper, the concept of category-specific redundancies in natural images based on statistical properties of images from different object categories is proposed. A hierarchical neural network is proposed that applies a biologically plausible mechanism to remove these redundancies in different layers. The model is trained with a set of natural images from different object categories, and the neuronal selectivities developed in this model are compared with those observed in single cell recordings of visual areas V2 and V4. Results of experiments demonstrate the close similarity of neuronal selectivities in the proposed model with those observed in the visual cortex.
The rest of this paper is organised as follows. In the following section, category-specific redundancies in natural images are explained. In Section 3, the proposed model and derivation of learning rules are described. In Section 4, the selectivity of neurons in the proposed model is compared with the neurons in areas V2 and V4. Also, the results of object recognition using responses of the last layer of the model are mentioned. The final section gives concluding remarks.
2. Category-specific redundancies in natural images
Previous models of redundancy reduction in natural images assume a fixed neighbourhood region around each linear filter in which responses of filters exhibit variance dependency (Hyvärinin et al. 2001; Schwartz and Simoncelli Citation2001). Filters outside these neighbourhood regions are therefore assumed to be independent. Divisive normalisation, topographic ICA and other models try to remove these dependencies using a non-linear transformation of linear filters’ responses. The results of this non-linear transformation are assumed to be no more dependent all over the image and therefore an efficient representation of the input image is produced. However, these models do not specify the size of dependency neighbourhoods. As discussed below, this size depends on the bunch of images used to calculate the filters’ responses.
displays the joint histograms of three pairs of Gabor filters for three different sets of images from the Caltech101 data set (available at www.vision.caltech.edu/lmage_Datasets/caltech101). Each row displays the histograms for one relative spatial distance between filters. Theses distances are 7, 15 and 30 pixels for the first, the second and the third rows, respectively. Histograms in the first column are calculated using images of random objects. Those of the second and the third columns are calculated using face and airplane images, respectively. These object categories are displayed as thumbnail images above the histograms of each column. It is obvious that filters in the first row exhibit variance dependency over all sets of images. In the second row, filters display variance dependency for face and airplane images but not for images of different categories. The filters in the third row display dependency only for airplane images. It seems that filters in the second and third row are dependent only for specific images. Previous studies about the variance dependency did not use images from different categories to calculate the joint histograms. Here images were used from different categories to reveal the dependency between filters at large relative distances.
Figure 1. Joint histograms of three pairs of filters calculated from different sets of images. Each row displays the histograms of one pair of filters. These three pairs of filters differ in their relative distances with increasing distance from the upper to the lower row. Each column displays the histograms calculated using images of different categories (refer to text).
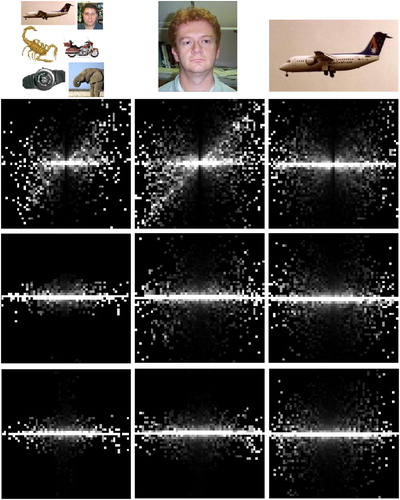
reveals the relation between variance dependency of linear filters and the set of images used to calculate their responses. It is clear that variance dependency between two filters is dependent on the set of images used to calculate their joint histogram. If the two filters are very close to each other, like the filters of the first row in , then their responses seem to be dependent for all classes of images. However, if their relative distance is large then their responses are dependent only for images of specific object categories. This is the case for the second and third rows in . This is similar to what Karklin and Lewicki Citation(2005) called non-stationary behaviour of linear filters. They found that responses of linear filters conform to exponential distribution, which is usually used to model the distribution of coefficients of linear filters responses to natural images. However, for specific regions in images, filters deviate from this a priori distribution.
Variance dependency has an intuitive explanation: dependent filters provide information about the responses of each other. Responses of edge-selective filters are dependent because edges in natural images usually vary smoothly. Therefore, based on the response of an edge-selective filter, it is possible to guess the responses of other filters in its neighbourhood. Whenever the images that are used to produce filters’ responses are selected from different categories, the size of this dependency neighbourhood reduces. However, if we limit the category of images, then this dependency neighbourhood becomes larger. If the images are from a specific category then one can guess about other filters’ responses in a fairly large area. This is the case shown in the second and third rows of .
Previous models used a limiting assumption about the variance dependency between filters’ responses: they assumed that dependency exists in a constant neighbourhood out of which filters are completely independent. Different sizes of dependency neighbourhoods were not observable in these studies because they used a narrow set of images to calculate responses of filters. However, it was shown that variance dependency in images is dependent on the set of images and their similarities. This complicated pattern of variance dependency between coefficients of linear filters results in statistical redundancies in the representation of natural images in the brain. This redundant representation can be transformed further to discard the unnecessary data. The question that arises here is: how does the brain remove these redundancies that are hidden in specific categories of images?
To understand better the brain mechanism of redundancy reduction, we can look at the selectivity of neurons along the ventral visual pathway. As mentioned earlier, the size of the RF and the complexity of preferred stimuli for neurons increase along the ventral visual pathway (Maunsell and Newsome Citation1987). This means that the set of images that can activate a V2 neuron is more limited than that of a V1 neuron. This set becomes even more limited for a V4 neuron. In IT, which is the highest pure sensory area of the visual cortex, neurons respond only to the images of specific objects. It seems that the visual cortex gradually categorises the input images using neurons with increasingly complex preferred stimuli.
We propose that neurons in successive areas of the ventral visual pathway reveal redundancies that were hidden in the previous areas. Neurons in area V1 have a very simple preferred stimulus, which is prevalent in almost all images. Therefore, dependencies exist between V1 neurons in small spatial neighbourhoods, similar to the first row of . When the complexity of neuronal selectivities increases from V1 to IT, the brain classifies images into more limited groups using responses of neurons. This means that a V2 neuron is activated by a set of images that is more limited in size compared with that of a V1 neuron. Therefore, redundancies in images are revealed in the responses of V2 neurons in a larger area. With a more limited set of images, V4 neurons can reveal redundancies in larger areas compared with V2 neurons. We propose that the brain removes the redundancies revealed in each area of the ventral visual cortex using horizontal connections. In successive stages of ventral visual pathway, neurons with similar preferred stimuli are clustered in spatial neighbourhoods, which makes it possible to remove the category-specific redundancies in natural images (Kiani, Esteky, Mirpour and Tanaka Citation2007). Therefore, the role of hierarchical processing in the visual cortex is to remove redundancies in different spatial extents and to provide a more efficient representation of the input image.
One remaining question is how such selectivities develop in extrastriate neurons. It is well known that neurons in the ventral visual cortex have two types of receptive field: classical RF (CRF) and extra classical RF (eCRF). The configuration of the CRF preferred stimulus is determined mainly by afferent connections from the previous area. For example, CRF selectivities of V1 neurons are determined by afferent connections from LGN cells. There is increasing evidence that eCRF selectivities are formed by interactions between neighbouring neurons through horizontal connections (Seriès, Lorenceau and Frégnac Citation2003). An important point to note is that eCRF selectivity of a neuron develops after its CRF selectivity has developed (Zhang, Zheng, Watanabe, Maruko, Bi, Smith III, and Chinom 2005). Another point is that CRF selectivity in an area develops after the eCRF selectivity of neurons in the previous area has been established, e.g. V2 neuronal selectivities develop after eCRF selectivities of V1 neurons are established (Zhang et al. Citation2005). The order of CRF and eCRF development may help to describe selectivity of neurons in the ventral visual cortex. To develop the model that is described in the following section, we adapted this order of development in different areas.
3. Proposed model
In this section, a model is described that is designed to remove category-specific redundancies in natural images. The proposed model corresponds to the foveal processing pathway in the ventral visual cortex. This pathway processes objects at the centre of attention and the receptive fields of its neurons largely overlap. The model, shown in , is a hierarchical neural network with three layers that correspond to the visual areas V1, V2 and V4. Each layer receives its bottom-up input from its immediately previous layer, except for the first layer, which receives the image as input. In each layer, a non-linear mechanism is applied to remove dependencies between neighbouring neurons. This is accomplished through horizontal connections between neighbouring neurons. The weights of these connections are learned from a set of natural images using a procedure that is described later. summarises the dimensions of each layer and the size of horizontal and bottom-up neuronal receptive fields of the model.
Figure 2. The proposed model is composed of three layers connected in a hierarchical manner. Neurons in each layer receive their input from both the previous layer neurons and neighbouring neurons in the same layer. Bottom-up RF sizes are expressed in image pixels for each layer.
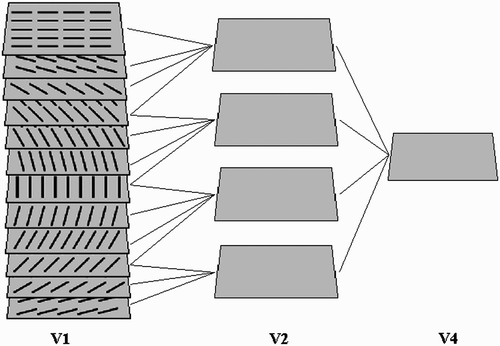
Table 1. Model parameters.
Neurons in the first layer of the proposed model are implemented using a set of Gabor filters with different orientations. The Gabor function is the product of a Gaussian function and a sinusoidal grating (Jones and Palmer Citation1987):
Bottom-up connections between different layers of the model are learned using a simple Hebbian learning rule, in which the change in weight of the connection between two neurons in different layers is proportional to the activity level of each neuron. Learning of horizontal connections is described in the following section.
3.1 Learning horizontal connections
To remove dependencies between responses of neighbouring neurons, we adapted the divisive normalisation method proposed by Schwartz and Simoncelli Citation(2001). We used this mechanism because the normalisation behaviour has been observed in responses of neurons in different areas of the visual cortex (Carandini, Heeger and Movshon Citation1997; Reynolds, Chelazzi and Desimone Citation1999; Zoccolan, Cox and DiCarlo Citation2005). In their work, Schwartz and Simoncelli assumed that variance of responses of each neuron can be modelled as a weighted sum of rectified responses of its neighbouring neurons:
In their original work, Schwartz and Simoncelli used the maximum likelihood estimate to learn the weights of connections between neighbouring neurons. However, maximum likelihood estimation is a very time-consuming process. As an alternative, we used a more time-efficient learning rule, which is based on variance estimation for random variables. Given a set of N samples of a random variable Z, unbiased estimates for its mean and variance are:
Training the horizontal and bottom-up connections is performed successively for each layer. We first train the horizontal weights of V1 using EquationEquations (7) and Equation(8)
. After that, bottom-up connections of layer V2 are trained using Hebbian learning rule:
The gradient descent method in the proposed algorithm converges to the global minimum of the function in EquationEquation (6). One should note that here the error is a quadratic function of the parameters w
xy
and σ
x
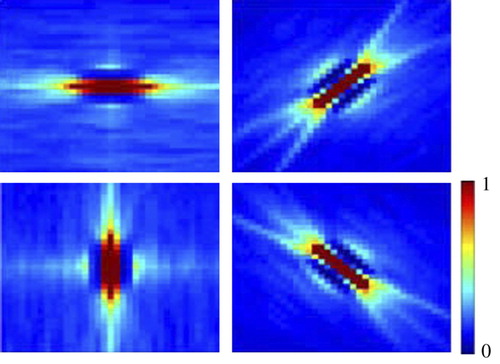
. Quadratic functions have a smooth surface with a global minimum and no local minima. Therefore, our gradient descent algorithm never sticks at a local minimum and always converges to its global minimum. displays a set of horizontal weights developed in area V1 of the proposed model. It is clear that these weights are very similar to the pattern of horizontal connections observed in edge-selective neurons of visual area V1.
Figure 3. A set of horizontal connections learned by four V1 neurons of the proposed model using the learning rule of EquationEquation (7). The preferred direction of each neuron is displayed as a red bar in the centre of each picture. These weights are very similar to the pattern of horizontal weights observed in visual area V1.
4. Results of experiments
In order to verify the proposed hypothesis, we compared the selectivity of neurons in the proposed model with those of extrastriate visual areas V2 and V4. To do this, we adapted the stimulus sets used previously to probe the selectivities of neurons in different single cell recording experiments on macaque visual cortex. We also performed a set of experiments to demonstrate the ability of the model to perform object recognition. We used two sets of images to test the model's generalisation and specificity.
4.1 Similarity to visual area V2
Visual area V2 is an intermediate stage in the ventral visual pathway. It is proposed that neurons in this area are tuned to complex visual features such as contours and junctions (Hegdé and Van Essen Citation2003). Despite the importance and relatively large size of area V2, there are few studies that have probed its neuronal selectivities with a carefully selected set of stimuli (Hegdé and Van Essen Citation2000, 2003, 2007; Ito and Komatsu Citation2004). Hedge and Hoyer used a set of gratings and contours to compare the responses of V2 neurons with textures and contours in images (Hegdé and Van Essen Citation2000, 2003, 2007). In the first experiment, we used this set, which consists of sinusoidal gratings with different frequencies and also sharp and acute curved lines and angles. Responses of three typical model neurons are shown in . The first row in displays the responses of a neuron selective to contours. This neuron does not show any response to grating stimuli. The second neuron is provoked largely by gratings but not with contours and angles. The third neuron shows no specific pattern of selectivity and a large number of stimuli elicited response from this neuron. The same three types of neuron were reported by Hegdé and Van Essen Citation(2003).
Figure 4. Responses of three model neurons to the stimulus set used by Hedge and Hoyer. The first row displays the responses of a neuron selective to contour stimuli. The second row is responses of a neuron selective to gratings. Responses in the third row depict a neuron with no specific selectivity to stimuli. These three types of neuron were observed in macaque visual area V2 (Hedgé and Van Essen 2003).
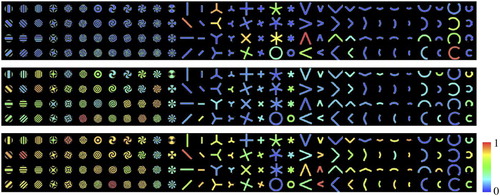
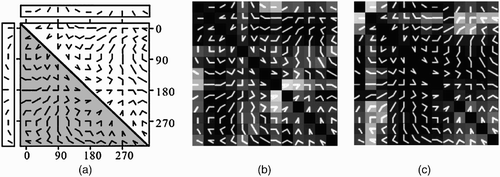
One of the most influential studies of visual area V2 is the work done by Ito and Komatsu Citation(2004), who examined the selectivity of neurons in this area using a set of angle stimuli. They used a set of angles with different orientations and sizes to test whether angle stimuli can evoke strong V2 neuronal responses. They found that most of the V2 neurons were responsive to these stimuli and some neurons demonstrated sharp selectivity to a specific angle stimulus. We adapted their stimulus set ( to examine the selectivity of units in the second layer of the proposed model. This stimulus set is composed of 66 angles each comprising of two half lines. These half lines vary from 0 to 330° with 30° steps. Angles in the upper triangle in are replicated in the lower triangle for better visualisation. ,c shows the responses of two typical neurons in the model to this stimulus set. The neuron in exhibited maximum response to a 30° angle leaning towards the left. The neuron in is selective to a horizontal half line and its responses are extended along the second row of this figure. Similar neurons were observed in the experiment done by Ito and Komatsu Citation(2004). A more complete comparison of V2 neurons with neurons in the second layer of the proposed model was described previously by Malmir and Shiry Citation(2009).
Figure 5. (a) Set of angles used by Ito and Komatsu to probe the selectivity of macaque V2 neurons. (b, c) Response of two model V2 neurons to this stimulus set. The neuron in (b) is tuned to a sharp angle, while the neuron in (c) is most activated by a straight 0° half line.
4.2 Contour coding for natural images in V2 neuronal responses of the proposed model
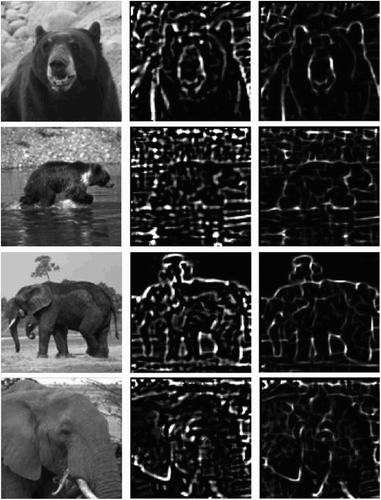
Accumulated evidence from neurophysiological experiments confirms the role of V2 neurons in coding object contours (Hegdé and Van Essen Citation2003, 2007). It is proposed that neurons along the ventral visual pathway code object contours in images (Schwartz, Desimone, Albright and Gross Citation1983). The results of single cell recordings also provide evidence that V2 neurons prefer contour stimuli over gratings (Hegdé and Van Essen Citation2007). To this end, we designed an experiment to inspect object contour coding in area V2 of the proposed model. We have to measure and compare the responses of V2 neurons with different image parts containing object contours. One way to do this is to provide the model area V1 with a feedback signal from the most activated model V2 neurons. A set of natural images, previously used to test the contour integration of V1 neurons (Gigorescu, Petkov and Westenberg 2004), was provided as input to the model. For each image, we calculated the final V2 neuronal activities and then provided the model V1 neurons with feedback from active V2 neurons. Further interactions between areas V1 and V2 were avoided because a dynamically interacting feedback mechanism is out of the scope of this paper. The weights of connections for feedback signals from V2 to V1 were the same as the bottom-up weights from V1 to V2 because V1–V2 connections in the visual cortex are assumed to be reciprocal (Neumann and Sepp Citation1999). The activity of V1 neurons was then modulated if they were both active and receiving strong feedback signals from area V2. The results of this experiment are shown in . It is obvious that feedback signals from area V2 to V1 strengthened the response of V1 neurons that were along the edges of objects.
Figure 6. Neurons in area V2 of the proposed model prefer object contours over textures in natural images. The leftmost column is the input image to the model. The middle column is the activity of model V1 neurons before feedback from area V2. The right column is the activity of V1 neurons after being modulated by feedback signals from model area V2.
4.3 Position-specific tuning for boundary curves in model V4 neurons
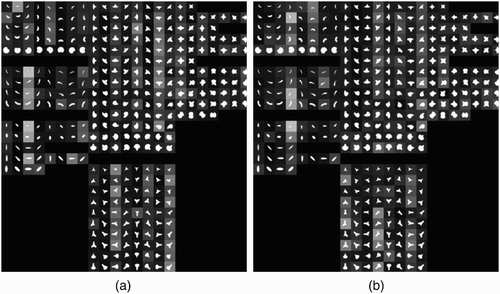
Several studies have shown that V4 neurons are selective to complex shapes such as gratings and contour elements (Desimone and Schein Citation1987; Gallant, Connor, Rakshit, Lewis and Van Essen Citation1996; Pollen, Przybyszewski, Rubin and Foote Citation2002). Pasupathy and Connor (Citation1999, Citation2001) have shown that neurons in visual area V4 are tuned to the boundary elements of specific curvatures arranged in closed shapes. They created a set of stimuli with systematically changing curvature of elements and changing their relative position to the centre of closed shapes. It was observed that most V4 neurons are selective to the specific combination of boundary elements and their relative position to the centre of shapes. Moreover, these neurons exhibited invariant responses to the positional changes of the optimal and suboptimal stimuli in their receptive fields.
To examine the selectivity of neurons in area V4 of the proposed model, we adapted the set of stimuli used by Pasupathy and Connor Citation(2001). displays the responses of two model neurons selected randomly in area V4 of the proposed model to this stimulus set. The neuron in is selective to a convex angle at 135°. The stimulus on the seventh row and the third column, which has a sharp convex boundary element at its left, has evoked the strongest response of this neuron. Other stimuli that contain a convex boundary element at 135° have also evoked relatively strong responses of this neuron. displays the responses of a neuron that is selective to two sharp convex elements at 90° and 235°. The maximum response in this figure belongs to the stimulus at the second row and the fourth column. This neuron also exhibits relatively weak responses to shapes that have a sharp angle at 235° but not on 90°; however, its strongest responses are to a combination of these curvatures.
Figure 7. Responses of two model V4 neurons to the stimulus set in Pasupathy and Connor Citation(1999). (a) This neuron is evoked strongly by a sharp convex element at the left of the shape centre. (b) Strongest responses for this neuron are to the shapes that have two sharp convex projections at 90° and 235° in the object centre coordinates.
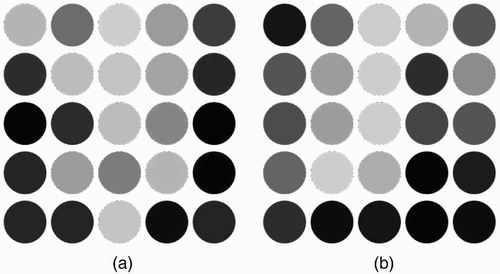
We also examined the invariance property of responses of neurons in area V4 of the proposed model to changes in preferred stimulus position. exhibits the responses of the neuron in for optimal and suboptimal stimuli placed in different positions of its receptive field. The receptive field of this neuron was divided into a 5×5 grid in which stimuli were placed and the responses of the neuron were recorded. Brightness of the circles in demonstrates the strength of the neuron's response to the stimulus placed in that position. It is evident that the neuron is selective to both optimal and suboptimal stimulus within a wide range of spatial locations.
Figure 8. Invariance property of responses of the neuron in to spatial changes of (a) the optimal and (b) the suboptimal stimulus. The receptive field of this neuron is divided into a 5×5 grid and the stimulus is presented in each location to the neuron. The strength of response in each location is indicated by the brightness of its corresponding circle.
4.4 Object recognition results
In the above experiments, the selectivity of neurons in the proposed model was compared with the visual cortex neurons. We also need to measure the efficiency of the features learned in the proposed model. One way to do this is to use the responses of the last layer of the model to perform object recognition. Images of objects are provided as input to the model and responses of the last layer are then classified using a linear classifier such as SVM (Cristianini and Shawe-Taylor Citation2000). For the choice of objects, we used a set of objects previously used in @Home robotics competitions for different tests such as Fetch and Carry (RoboCup@Home 2009). We generated a set of images from six custom objects, shown in , in different distances, viewpoints and backgrounds. Sample images for one object are shown in . For each object, we used two-thirds of images for training and one-third for testing. In the first experiment, images for training were selected from all backgrounds. The results are shown in the second column of . In the second experiment, we used images with two backgrounds for training; the third background was used only for testing. The results are shown in the third column of . It is clear that the average performance of the model is above 95%. The same set of experiments was performed using the HMax model (Serre, Wolf, Bileschi, Riesenhuber and Poggio Citation2007), and the results are also reported in . It is obvious that the proposed model is quite competitive compared with the HMax model.
Figure 9. Six objects used to test the recognition rates of the proposed model.
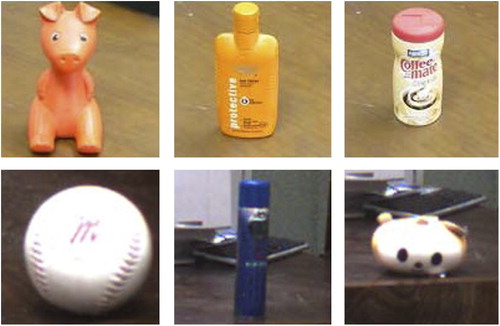
Figure 10. Sample images of an object used to test the recognition rates of the proposed model.
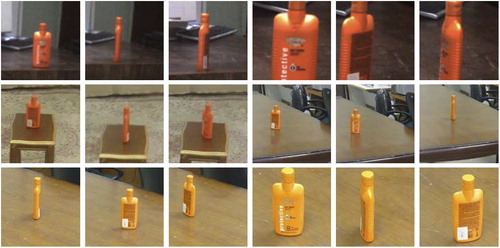
Table 2. The results of object recognition with responses of the model area V4 compared with the HMax model (Serre et al. Citation2007).
5. Conclusion
Statistical properties of natural images are very important in the development of neuronal selectivities in the visual cortex. It has been hypothesised that sensory neurons are developed to remove the statistical redundancies in natural images. Several models have been developed to remove the statistical dependencies and to provide more efficient representation of natural images. These models have simulated different properties of neurons in the primary visual cortex; however, there has been no effort to extend these results to higher order visual areas such as V2 and V4. In this paper, we proposed the idea of category-specific redundancies in natural images by observing the pattern of dependencies between responses of linear filters for different image categories. It was observed that dependencies in responses of linear filters to natural images from different object categories are not limited to a constant spatial neighbourhood and vary based on the class of images used.
It was proposed that the visual cortex removes these dependencies in a gradual process in different areas of the ventral visual pathway. In each area, redundancies are removed using horizontal connections between neighbouring neurons. Higher areas remove redundancies that can be seen in images of more limited object categories and are not eliminated in the lower areas. A model was implemented based on this idea and learning rules were developed to remove variance dependency between neighbouring neurons using horizontal connections. This model simulated the selectivity of neurons in areas V2 and V4 and also achieved high recognition rates in different object recognition experiments.
An interesting extension to the work presented in this paper is to develop a generative model based on category-specific redundancies in natural images. Such a model contains different layers of linear or non-linear transformations that convert higher level representation of object components to low-level two-dimensional representation of images in pixels. In such a model, each node in higher order areas determines the common variance of responses of a group of neighbouring neurons in lower areas. However, unlike previous models (Karklin and Lewicki Citation2005; Schwartz et al. Citation2006), this model would contain more than one layer of variance generation. In fact, each variance node will also have a variance dependency neighbourhood in which the variance is determined by the activity of nodes in higher order areas.
Other work that is currently being conducted is to add another layer corresponding to IT and to investigate the properties of IT neurons in response to different object categories. In this work, we seek to find the emergence of object category columns in area IT of the model when the model is trained using images of different object categories. It has been observed that neurons in IT of the macaque visual cortex are organised in columns in which neighbouring neurons are tuned to similar objects and each object category is represented by a combination of these columns (Tsunoda, Yamane, Nishizaki and Tanifuji Citation2001; Kiani et al. Citation2007). We seek to find whether the learning rules developed here can lead to the emergence of these properties in area IT of the proposed model.
References
- Angelucci , A. and Bullier , J. 2003 . Reaching Beyond the Classical Receptive Field of V1 Neurons: Horizontal or Feedback Axons? . Journal of Physiology-Paris , 97 : 141 – 154 .
- Atick , J. 1992 . Could Information Theory Provide an Ecological Theory of Sensory Processing? . Network: Computation. Neural Systems , 3 : 213 – 251 .
- Attneave , F. 1954 . Some Informational Aspects of Visual Perception . Psychological Review , 61 : 183 – 193 .
- Barlow , H. B. 1961 . “ Possible Principles Underlying the Transformation of Sensory Messages ” . In Sensory Communication Edited by: Rosenblith , W A . 217 – 234 .
- Bell , A. J. and Sejnowski , T. J. 1997 . The “Independent Components” of Natural Scenes are Edge Filters . Vision Research , 37 : 3327 – 3338 .
- Caltech, 101 Object Categories www.vision.caltech.edu/Image_Datasets/Caltech101/
- Carandini , M. , Heeger , D. J. and Movshon , J. A. 1997 . Linearity and Normalization in Simple Cells of the Macaque Primary Visual Cortex . Journal of Neuroscience , 17 : 8621 – 8644 .
- Cristianini , N. and Shawe-Taylor , J. 2000 . An Introduction to Support Vector Machines and other Kernel-based Learning Methods , Cambridge : Cambridge University Press .
- Dan , Y. , Atick , J. J. and Reid , R. C. 1996 . Efficient Coding of Natural Scenes in the Lateral Geniculate Nucleus: Experimental Test of a Computational Theory . Journal of Neuroscience , 16 : 3351 – 3362 .
- Desimone , R. 1991 . Face-selective Cells in the Temporal Cortex of Monkeys . Journal of Cognitive Neuroscience , 3 : 1 – 8 .
- Desimone , R. and Schein , S. J. 1987 . Visual Properties of Neurons in Area V4 of the Macaque: Sensitivity to Stimulus Form . Journal of Neurophysiology , 57 : 835 – 868 .
- Field , D. 1994 . What is the Goal of Sensory Coding? . Neural Computation , 6 : 559 – 601 .
- Gallant , J. L. , Connor , C. E. , Rakshit , S. , Lewis , J. W. and Van Essen , D. C. 1996 . Neural Responses to Polar, Hyperbolic, and Cartesian Gratings in Area V4 of the Macaque Monkey . Journal of Neurophysiology , 76 : 2718 – 2739 .
- Grigorescu , C. , Petkov , N. and Westenberg , M. A. 2004 . Contour and Boundary Detection Improved by Surround Suppression of Texture Edges . Image and Vision Computing , 22 : 609 – 622 .
- Hegdé , J. and Van Essen , D. C. 2000 . Selectivity for Complex Shapes in Primate Visual Area V2 . Journal of Neuroscience , 20 : 1 – 6 .
- Hegdé , J. and Van Essen , D. C. 2003 . Strategies of Shape Representation in Macaque Visual Area V2 . Visual Neuroscience , 20 : 313 – 328 .
- Hegdé , J. and Van Essen , D. C. 2007 . A Comparative Study of Shape Representation in Macaque Visual Areas V2 and V4 . Cerebral Cortex , 17 : 1100 – 1116 .
- Hubel , D. H. and Wiesel , T. N. 1962 . Receptive Fields, Binocular Interaction and Functional Architecture in the Cat's Visual Cortex . Journal of Physiology , 160 : 106 – 154 .
- Hyvärinen , A. and Hoyer , P. O. 2000 . Emergence of Phase- and Shift-invariant Features by Decomposition of Natural Images into Independent Feature Subspaces . Neural Computation , 12 : 1705 – 1720 .
- Hyvärinen , A. , Hoyer , P. and Inki , M. 2001 . Topographic Independent Component Analysis . Neural Computation , 13 : 1527 – 1558 .
- Ito , M. and Komatsu , H. 2004 . Representation of Angles Embedded within Contour Stimuli in Area V2 of Macaque Monkeys . Journal of Neuroscience , 24 : 3313 – 3324 .
- Itti , L. , Koch , C. and Braun , J. 2000 . Revisiting Spatial Vision: Towards a Unifying Model . Journal of Optical Society of America , 17 : 1899 – 1917 .
- Jones , J. P. and Palmer , L. A. 1987 . An Evaluation of the Two-dimensional Gabor Filter Model of Simple Receptive Fields in Cat Striate Cortex . Journal of Neurophysiology , 58 : 1233 – 1258 .
- Karklin , Y. and Lewicki , M. S. 2003 . Learning Higher-order Structures in Natural Images . Network: Computation. Neural Systems , 14 : 483 – 499 .
- Karklin , Y. and Lewicki , M. S. 2005 . A Hierarchical Bayesian Model for Learning Nonlinear Statistical Regularities in Nonstationary Natural Signals . Neural Computation , 17 : 397 – 423 .
- Kiani , R. , Esteky , H. , Mirpour , K. and Tanaka , K. 2007 . Object Category Structure in Response Patterns of Neuronal Population in Monkey Inferior Temporal Cortex . Journal of Neurophysiology , 97 : 4296 – 4309 .
- Laughlin , S. 1981 . A Simple Coding Procedure Enhances a Neuron's Information Capacity . Zeitschrift für Naturforschung , 36 : 910 – 912 .
- Logothetis , N. K. , Pauls , J. and Poggio , T. 1995 . Shape Representation in the Inferior Temporal Cortex of Monkeys . Current Biology , 5 : 552 – 563 .
- Malmir , M. and Shiry , S. Class Specific Redundancies in Natural Images: A Theory of Extrastriate Visual Processing . International Joint Conference on Neural Networks (IJCNN) . Atlanta , GA
- Maunsell , J. H.R. and Newsome , W. T. 1987 . Visual Processing in Monkey Extrastriate Cortex . Annual Review Neuroscience , 10 : 363 – 401 .
- Neumann , H. and Sepp , W. 1999 . Recurrent V1–V2 Interactions in Early Visual Boundary Processing . Biological Cybernetics , 81 : 425 – 444 .
- Olshausen , B. A. and Field , D. J. 1996 . Emergence of Simple Cell Receptive Field Properties by Learning a Sparse Code for Natural Images . Nature , 381 : 607 – 609 .
- Park , H. J. and Lee , T. W. 2005 . Unsupervised Learning of Nonlinear Dependencies in Natural Images . International Journal of Imaging Systems. Technology , 15 : 34 – 47 .
- Pasupathy , A. and Connor , C. E. 1999 . Responses to Contour Features in Macaque Area V4 . Journal of Neurophysiology , 82 : 2490 – 2502 .
- Pasupathy , A. and Connor , C. E. 2001 . Shape Representation in Area V4: Position-specific Tuning for Boundary Conformation . Journal of Neurophysiology , 86 : 2505 – 2519 .
- Plebe , A. and Domenella , R. G. 2007 . Object Recognition by Artificial Cortical Maps . Neural Networks , 20 : 763 – 780 .
- Pollen , D. A. , Przybyszewski , A. W. , Rubin , M. A. and Foote , W. 2002 . Spatial Receptive Field Organization of Macaque V4 Neurons . Cerebral Cortex , 12 : 601 – 616 .
- Reynolds , J. H. , Chelazzi , L. and Desimone , R. 1999 . Competitive Mechanisms Subserve Attention in Macaque Areas V2 and V4 . Journal of Neuroscience , 19 : 1736 – 1753 .
- RoboCup@Home Competitions Rule Book (2009), www.robocup.org/robocup-home/
- Schwartz , E. L. , Desimone , R. , Albright , T. D. and Gross , C. G. Shape Recognition and Inferior Temporal Neurons . Proceedings of the National Academy of Science . Vol. 80 , pp. 5776 – 5778 .
- Schwartz , O. , Sejnowski , T. J. and Dayan , P. 2006 . Soft Mixer Assignment in a Hierarchical Generative Model of Natural Scene Statistics . Neural Computation , 18 : 2680 – 2718 .
- Schwartz , O. and Simoncelli , E. P. 2001 . Natural Signal Statistics and Sensory Gain Control . Nature Neuroscience , 4 : 819 – 825 .
- Seriès , P. , Lorenceau , J. and Frégnac , Y. 2003 . The “Silent” Surround of V1 Receptive Fields: Theory and Experiments . Journal of Physiology-Paris , 97 : 453 – 474 .
- Serre , T. , Wolf , L. , Bileschi , S. , Riesenhuber , M. and Poggio , T. 2007 . Robust Object Recognition with Cortex-like Mechanisms . IEEE Transactions on Pattern Analysis and Machine Intelligence , 29 ( 3 )
- Simoncelli , E P. Statistical Models for Images: Compression, Restoration and Synthesis . 31st Asilomar Conference on Signals, Systems and Computers .
- Tanaka , K. 1994 . Inferotemporal Cortex and Object Vision . Annual Review of Neuroscience , 19 : 109 – 139 .
- Tsunoda , K. , Yamane , Y. , Nishizaki , M. and Tanifuji , M. 2001 . Complex Objects are Represented in Macaque Inferotemporal Cortex by the Combination of Feature Columns . Nature Neuroscience , 4 : 832 – 838 .
- Valpola , H. , Harva , M. and Karhunen , J. 2004 . Hierarchical Models of Variance Sources . Signal Processing , 84 : 267 – 282 .
- Wainwright , M. J. and Simoncelli , E. P. 2000 . Scale Mixtures of Gaussians and the Statistics of Natural Images . Advances in Neural Information Processing Systems , 12 : 855 – 861 .
- Zetzsche , C. , Wegmann , B. and Barth , E. Nonlinear Aspects of Primary Vision: Entropy Reduction Beyond Decorrelation . Proceedings of the SID, Society for Information Display . Edited by: Morreale , J. pp. 933 – 936 .
- Zhang , B. Delayed Maturation of Receptive Field Center-Surround Mechanisms in V2 . Proceedings of the National Academy of Sciences . Vol. 2 , pp. 5862 – 5867 .
- Zoccolan , D. , Cox , D. and DiCarlo , J. 2005 . Multiple Object Response Normalization in Monkey Inferotemporal Cortex . Journal of Neuroscience , 25 : 8150 – 8164 .