
 ?Mathematical formulae have been encoded as MathML and are displayed in this HTML version using MathJax in order to improve their display. Uncheck the box to turn MathJax off. This feature requires Javascript. Click on a formula to zoom.
ABSTRACT
Cancer is a disease with a complex genome of altered functions. However, most existing driver gene identification approaches rarely consider driver genes may have the same functional properties. To overcome this issue, we propose the gamma distribution test for the driver gene identification based on similarity networks, termed GASN, which identifies driver genes by combining machine learning and distributional statistics methods. Similarity networks are able to learn gene similarities and key features that represent the functional impact of genes. In addition, we classify genes into different cellular compartments and use the gamma distribution test within cellular compartments to identify significant driver genes. The experimental results show that our method outperforms the other 17 comparative methods.
1. Introduction
Cancer cells have the ability of unlimited proliferation, infiltration, and destruction ofnormal human tissues (L. Zhang et al., Citation1997). Compared to normal cells, cancer cells have a great number of mutations, and only a small fraction of these mutations and genes contribute to cancer development, which is called driver mutations and driver genes (Y. Chen et al., Citation2014). How to effectively identify these driver genes from a large number of genes is of great importance to fundamentally understand the mechanistic study of cancer and is beneficial to discover new therapeutic targets.
In recent years, thanks to the vigorous development of high-throughput sequencing technology, some large-scale cancer genome projects, such as the International Cancer Genome Consortium (ICGC) (Joly et al., Citation2012) and the Cancer Genome Atlas (TCGA) (J. Liu et al., Citation2018), have systematically recorded DNA sequence data and clinical data of thousands of tumours. The establishment of this kind of database makes it possible for us to deeply discover driver genes. Moreover, due to the accumulation of data, provides a good experimental data basis for researchers to apply modern machine-learning methods for driver genes identification. Several driver genes identification methods have been developed (Isik & Ercan, Citation2017; Joly et al., Citation2012; J. Liu et al., Citation2018; Rahimi et al., Citation2019).
One of the most common approaches is to identify the driver genes by analysing a set of genes and finding genes that are frequently mutated in somatic cells. However, gene-specific characteristics such as mutation frequency, mutation type, and mutant gene length may have an impact on the acquisition of mutations in genes. Therefore, methods based on mutation frequency are often compared with background mutation rates (BMR) to identify significantly mutated genes. For example, MuSic (Dees et al., Citation2012) selected genes with mutation frequencies higher than the BMR as driver genes, and MutSigCV (Lawrence et al., Citation2013) used patient-specific mutation frequencies and spectra to obtain more accurate BMRs by taking into account tumour heterogeneity and genome. Although some driver genes mutate at high frequencies (>20), most cancer mutations occur at intermediate frequencies (2–20
) or lower than expected (Gu et al., Citation2020). If the evaluation of the background mutation rate is too high, some driver genes with significant mutations are difficult to be identified. By contrast, some genes with non-significant mutations will be misidentified.
The other one is based on the effect of gene function. Some researchers combine the known protein action network or evaluate the functional impact of mutations on proteins to determine driving mutations and driver genes by improving the sensitivity to driver genes with low mutation frequency (Bertrand et al., Citation2015; Leiserson et al., Citation2014; Mularoni et al., Citation2016). For example, Hierarchical HotNet (Reyna et al., Citation2018) used the protein interaction network to calculate the influence between paired genes and identify the sub-network containing cancer mutant genes. MaxMIF (Y. Hou et al., Citation2018) proposed a way to identify driver genes by integrating somatic mutation data and molecular interaction data using a maximum mutation impact function. NetSig (Horn et al., Citation2018) examined the nearest directly adjacent genes at each vertex and assigned scores to a ‘star-shaped subnet’ centered on each vertex to identify the driver genes. DawnRank (J. P. Hou & Ma, Citation2014) ranked potential driver genes according to their impact on the overall differential expression of their downstream genes in a network of molecular interactions.
Furthermore, with the discovery of more and more driver genes through experimental verification, based on these known driver genes, researchers began to combine machine learning algorithms to predict new driver genes (Anandanadarajah et al., Citation2021; B. Chen et al., Citation2016; Gu et al., Citation2020; Han et al., Citation2019; He et al., Citation2022). These methods usually train classifiers with gene characteristics. DriverML (Han et al., Citation2019) used statistical methods to quantify the impact scores of different mutation types on protein function and then combined it with a machine learning model to identify the cancer genes. FInet (Gu et al., Citation2020) used an artificial neural network to estimate the functional impact score of gene mutation, and then combined it with a hierarchical clustering algorithm to obtain the distribution of each gene in the class to identify the driver genes. ParsSNP (Kumar et al., Citation2016) used an unsupervised functional impact predictor with an expectation-maximising framework to find mutations that broadly explain tumour incidence.
However, the existing driver genes recognition methods based on machine learning still have the following problems: In the topology of the gene similarity network, some nodes with highly similar attributes usually have similar functions, or they complete a certain function together (Xing et al., Citation2020). For example, genes CCND1 and CCND2 with high sequence similarity have mechanisms involved in cell cycle regulation and affect cell proliferation (X. Wang et al., Citation2020). Gene TFEB, TFE3, and TFEC all have highly similar domains and are involved in the activation of target gene transcription (Xie et al., Citation2019). In addition, many methods do not strike the best balance between accuracy and sensitivity. Some methods are too ambitious and produce too many false positive driver genes, while others are too conservative and may miss many of the true driver genes.
Based on the aforementioned observations, this paper proposes a gamma distribution test driver genes identification method based on similarity networks (GASN). First, a gene similarity network is constructed using key feature information to describe the impact of gene function. Second, since some nodes with highly similar properties in the topology of similarity networks usually have similar functions, this work uses convolutional neural networks to learn the topology of gene similarity networks to predict the functional impact score of gene mutations, which can fully learn the similarity of genes, and it can also discover the key feature information by characterising the impact of gene functions. As proteins must be localised in the appropriate subcellular compartment to fulfill their function, the same genes in different biological modules play different roles in cell production and development. We have therefore classified genes according to the subcellular compartment in which they are located. On this basis, we fit the distribution of functional effects in the different subcellular compartments with a gamma distribution, compared the observed functional effect scores with the fitted distribution to obtain a p-value for each gene, and select genes with significant deviations as driver genes. We apply our method to the10 TCGA datasets, and the experimental results show that GASN's performance is generally superior to the other 17 comparative methods.
The main contributions of this paper are as follows:
First, the gene similarity network combined with the convolutional neural network is used to predict the functional impact score of a gene mutation for the first time. That the convolutional neural network can not only learn the key characteristic information by characterising the impact of gene function but also fully exploit the information on the gene similarity network, genes with high similarity usually have similar functions or complete a certain function together, which improves the accuracy of the model.
In this paper, by classifying genes into different cellular compartments and using distribution tests to identify driver genes in cellular compartments. GASN has superior performance in 10 cancers compared to 17 other state-of-the-art methods.
In the rest of the paper, Section 2 describes the proposed method, Sections 3 and 4 are our experimental and analytical results, and Section 5 draws some conclusions.
2. Method
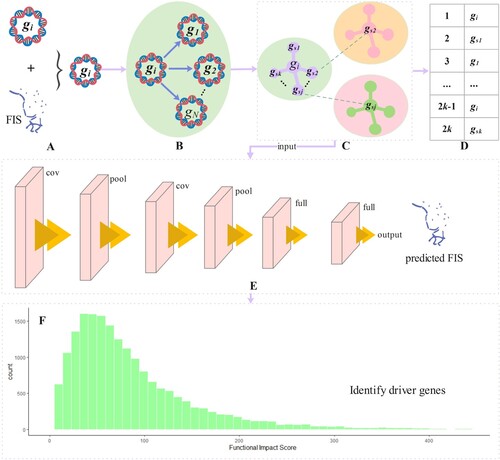
In this section, we propose a Gamma distribution test based on similarity networks for driver gene identification, as shown in Figure . We construct a gene similarity network and use it as an input to a convolutional neural network to predict the functional impact score of genes. Secondly, as genes function in different subcellular compartments, we group genes according to whether they are in the same subcellular compartment or not. Finally, we use the predicted gene functional impact scores and Gamma distributions to model the background distribution of gene function and obtained significant driver genes by comparing the background distribution with the observed functional impact.
Figure 1. The workflow of GASN is divided into 6 steps. Specifically, (a) is used to predict the genetic characteristics of gene mutation function influence score and the observed FIS, which are fused as the feature vector for constructing a similarity network. (b) Taking gene as an example, the similarity between
and other genes is calculated. (c) The top k-nearest neighbor genes
in the similarity ranking of each gene are selected to form the topology. (d) Taking gene
as an example, the gene similarity network is constructed, and its order is
, the similarity network of all genes is used as the input of convolutional neural network. (e) It shows the 5-layer basic structure of the convolutional neural network used in this paper, including the input layer, convolution layer, pooling layer, full connection layer, and output layer. (f) The gene background distribution is fitted by gamma distribution in the subclass, and the observed FIS is compared with the predicted FIS in the background distribution, to obtain the p value of each gene and select the gene with significant deviation as the driver gene.
2.1. Calcuate the observed FISs for genes
It is worth noting that some values of these 12 genetic characteristics may be missing. Therefore, these missing values are imputed according to the method of paper (Gu et al., Citation2020). First, the distance between gene and gene
is defined, as shown in Equation (Equation1
(1)
(1) ), as the basis for selecting nearest neighbor genes:
(1)
(1) where
is a set of feature vectors of gene
deletion, and
is the feature l of gene
.
We use Equation (Equation2(2)
(2) ) to complement the deletion feature l of gene
.
(2)
(2) let
be the M nearest neighbor gene of gene
without deletion feature l. In this article, M is set to 100.
Similarly, because some observed FIS cannot be evaluated by the mutation assessor, we map the variant classification of MAF file mutation (such as silent, synchronous, non-stop, nonsense, and frame deletion) to the corresponding mutation effect (null, silent, non-silent and non-coding ) according to the paper (Gu et al., Citation2020). According to Equation (Equation3(3)
(3) ), the observed FIS of the average compensation of mutation r with mutation effect t can be obtained as follows:
(3)
(3) where
is the mutation set of mutation effect t,
is the FIS of mutation r with mutation effect t, and
is the number of mutations with mutation effect t.
Notice that most existing methods to evaluate the functional impact of mutations always focus on non-synonymous somatic mutations, such as mutation suppressors, polymers, and screening factors. Synonymous mutations and some mutations affect proteins. If nonsense mutations and small index fission deletion, the average FIS of mutations with silencing and ineffective effects cannot be calculated from the mutant synthon. In general, silent, non-coding, non-silent, and null mutations have a progressively more significant effect on proteins. Silent mutation does not affect the amino acids of protein sequence, and its FIS should be the smallest. Although non-coding mutation does not change amino acids, it will promote the development of cancer cells. For example, the non-coding mutation in the 3'-untranslated region (3'-UTR) can change the binding efficiency of microRNA (miRNA), resulting in the loss/increase of gene function (Akdeli et al., Citation2014). The non-silent mutation changes the amino acid sequence of the protein and has a significant functional impact on protein, accelerating tumour progression. For example, the R132 mutation in the IDH1 gene was found to be associated with early glioma formation (Cui et al., Citation2016). Null mutation, including “nonsense mutation”, “splice site”, “frameshift insertion”, and “frameshift deletion” will lead to continuous changes in amino acid sequences and have a more significant impact on organisms. For example, Waldenberg syndrome is caused by splicing mutation of PAX3 (Barber et al., Citation1999), and exon mutation is caused by nonsense/frameshift mutation of DMD gene, resulting in Becker muscular dystrophy (Al-Zaidy et al., Citation2015). Based on the above analysis, when the average FIS effect t cannot be calculated, the deletion FIS of mutation r with mutation effect t can be obtained as shown in Equation (Equation4(4)
(4) ):
(4)
(4)
The observed FIS of gene
is obtained by accumulating the FIS of all mutation effects t of cumulative mutation r as follows:
(5)
(5) where
is the total number of all mutation effects of mutation r.
2.2. Network-based convolution
In recent years, network models have been widely used in biological systems (Gu et al., Citation2020; Han et al., Citation2019). In network science, a widely recognised and partially experimentally verified hypothesis is that the topology of complex networks can fully reflect the connection properties of the corresponding real complex system, and nodes with highly similar topology usually have similar functions or close connections to perform a certain function (Jiang et al., Citation2022; C. Liu et al., Citation2022; Xing et al., Citation2020). To characterise the similarity relationship between genes, the Pearson correlation coefficient is used to calculate the similarity between genes, as shown in Equation (Equation6(6)
(6) ):
(6)
(6) where
is the feature l of gene
, L is the number of features in a gene,
is the average value of a set of feature vectors of gene
, and the similarity network is constructed byk-nearest neighbor algorithm, in which each gene relates to the top k genes in its similarity ranking, as shown in Figure. (c).
Figure (d) shows the similarity network composed of the eigenvectors of a given gene
and its k similar neighbours
. where
, L is the characteristic dimension of genes, and N is the total number of genes. The similarity network of N genes constitute
as the input data of the input layer. In
, the feature attributes between similar features are close to each other, so they can share the same filter in the convolution layer (Jiang et al., Citation2021).
2.3. Similarity neural network
Convolutional Neural Network (CNN) is a fundamental approach in the fields of image recognition, speech analysis, text recognition, and so on Le and Nguyen (Citation2019). In the prediction of gene mutation function influence score, the traditional input data contains significant features representing different attributes of genes, which cannot be directly applied to CNN (X. Chen et al., Citation2022; Le & Ho, Citation2022; Lin et al., Citation2021). How to apply the input data containing the significant characteristics of different attributes of genes to CNN is the problem we need to solve at present. We find that the pixels in the same small area in the network share the same filter because they have similar gray levels. In the gene similarity network, genes and their adjacent genes also have similar properties (de Vries, Citation2020; Luo et al., Citation2019). If we reconstruct these traditional input data to make the characteristics of similar genes close to each other, the neural network can be applied to these reconstructed data. Based on this, the gene similarity network, according to the reconstructed data in Section 2.2 constructed, so that the convolutional neural network can learn the topology of the similarity network and the characteristic information characterising the impact of mutation function to improve the prediction accuracy of functional impact score.
As shown in Figure (e), the convolution neural network model based on a similarity network is composed of five layers: input layer, convolution layer, pooling layer, full connection layer, and output layer. The similarity network is composed of the eigenvectors of a given gene
and its k similar neighbours
, where L is the characteristic dimension of genes.
composed of the similarity network of N genes is used as the input data of the input layer. According to Equation (Equation7
(7)
(7) ), the output result of the convolution layer is used as the nonlinear mapping, and the
is used as the input of the pooling layer.
(7)
(7) where
represents the offset and
,
is the weight parameter, and f is the activation function.
2.4. Delineat cellular subdivisions
It can be seen from biological studies that nonsense mutations that generate stop codons, missense mutations caused by single amino acid residue replacement, non-silent mutation changes such as in-frame insertion or deletion, and frameshift of transcript reading frame will change the amino acid sequence of corresponding proteins, resulting in abnormal protein products, that is, gene mutations will affect protein function. These functional effects are usually evaluated by secondary and tertiary structural characteristics, evolutionary conservation, biochemical similarity of amino acids before and after replacement, position of side chains in three-dimensional protein structure, and so on Heinemann et al. (Citation2001). Compared with passenger mutation, driver mutation has a greater impact on protein function.
Some researchers have attempted to identify driver genes by assessing differences in the distribution of the functional impact of passenger and driver mutations in subclasses delineated by clustering algorithms (Bashashati et al., Citation2012; Gu et al., Citation2020; Mai et al., Citation2020). However, this approach does not take into account that the same gene can play different roles in different cellular compartments, which results in a poor simulation of the background distribution of functional gene effects. Therefore, we divide the cells according to the cellular compartment in which the gene is located, as shown in Equation (Equation8(8)
(8) ).
(8)
(8) where
denotes the kth cell compartment and
denotes the kth subclass.
2.5. Construct a background distribution in a subclass
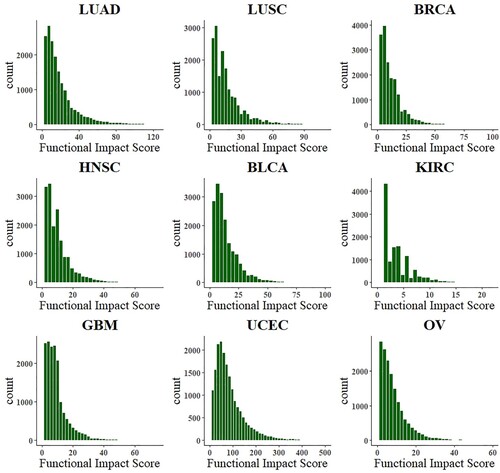
In this section, we need to judge which distribution the functional impact of mutation obeys. The histogram in Figure shows the functional impact distribution of 9 cancer types. From Figure , the functional impact of mutations generally follows the gamma distribution, so the estimated distribution of FIS can be used to fit the gamma distribution.
Figure 2. Histogram of gene background distribution in 9 cancer types.
Since the gamma distribution belongs to the normal skew distribution (Fay & Feuer,Citation1997), we replace the abnormal value with a smaller estimated FIS. Therefore, we use 5 truncation to estimate FIS instead of all data to fit the distribution. Specifically, the estimated FIS below the 5
quantile is removed. For non-positive FIS estimates, an overall adjustment is made to ensure that all estimated FIS is within the range of distribution. The
of genes
with non-positive FIS in the cell compartment
is adjusted to:
(9)
(9) where
is the minimum estimated FIS in the cell compartment
. ε belongs to the estimation deviation, and ε is set to 0.05.
The shape parameters of gamma distribution and scale parameters
in cell compartment
, then it is estimated by the maximum likelihood function, as shown in Equation (Equation10
(10)
(10) ):
(10)
(10) where
(11)
(11) and
(12)
(12)
is the number of genes in the cell compartment
and
is the density function of gamma distribution in the cell compartment
.
2.6. Identification of driver genes
After obtaining the distribution of genes in each subclass through the gamma distribution, we need to evaluate genes with significant differences in the background distribution. First, the p-value significantly lower than FIS is set to 0. To test the significance level of genes, we use the following null hypothesis that the observed FIS of gene
is assumed to obey the above parameters
. The p-value of gene
in
is given in Equation (Equation13
(13)
(13) ).
(13)
(13) where
(14)
(14) where
is the cumulative function of the gamma distribution in
and
is the observed functional impact score of gene i in
.
After obtaining the p-value of each gene, we further assign the q-value to each gene using the Benjamin-Hochberg error detection rate algorithm. Since there are k cell compartments and some genes may appear in more than one subcellular compartment, we choose the value with the largest mutation score calculated from Eq(15) as the final result. Genes whose q value exceeded the significance threshold () are identified as driver genes.
(15)
(15)
3. Experiments
We compare GASN with 17 other commonly used methods for driver gene identification in 10 TCGA cancers. The commonly used methods include: FINet (Gu et al., Citation2020), DriverML (Han et al., Citation2019), ActiveDriver (Reimand & Bader, Citation2013), Dendrix (Vandin et al., Citation2012), MDPFinder (Zhao et al., Citation2012), OncodriverFM (Gonzalez-Perez & Lopez-Bigas, Citation2012), MutSigCV (Lawrence et al., Citation2013), MEMO (Ciriello et al., Citation2012), CoMDP (J. Zhang et al., Citation2014), DawnRank (J. P. Hou & Ma, Citation2014), DriverNet (Bashashati et al., Citation2012), HotNet2(Leiserson et al., Citation2014), e-Driver (Porta-Pardo & Godzik, Citation2014), OncodriveCLUST (Tamborero et al., Citation2013). In addition, the other three top tools, OncodriveFML (Mularoni et al., Citation2016), rDriver (Z. Wang et al., Citation2018), and SCS (Guo et al., Citation2018), are also evaluated. For those methods that could generate p-values, an adjusted p-value ≤ 0.05 (i.e. FDR≤0.05) is used as the threshold for claiming driver genes. For those methods that can not produce p-values, the same criteria as for the DriverDB database are used instead.
3.1. Data source
We evaluate ten cancer types annotated by the TCGA, which consist of lung squamous cell carcinoma (LUSC), lung adenocarcinoma (LUAD), breast invasive carcinoma (BRCA), head and neck squamous cell carcinoma (HNSC), urothelial bladder carcinoma (BLCA), kidney renal clear cell carcinoma (KIRC), uterine corpus endometrioid carcinoma (UCEC), acute myeloid leukemia (LAML), ovarian serous cystadenocarcinoma (OV), and glioblastoma multiforme (GBM), with information on the proteins subcellular compartments including the nucleus, golgi apparatus, cytoskeleton, cytoplasm, endoplasmic reticulum, lysosome, peroxisome, extracellular gap, mitochondria, endonucleosome, plasma membrane and 11 other cellular compartments from Binder et al. (Citation2014). The observation FIS used by GASN comes from FISs of mutation assessor (Gnad et al., Citation2013), which evaluates the functional impact of mutations based on the evolutionary protection of affected amino acids in protein homologs. The more significant the score of mutation assessment, the greater the impact of the mutation on function. To evaluate the predictive power of our model, ideally, we need an accurate, comprehensive, and unbiased gold-standard cancer gene set. Unfortunately, such a cancer gene set is not available, so we collect annotated cancer genes as comparison benchmarks from different publicly available sources, where 2,372 protein-coding cancer genes are downloaded from NCG 6.0 (Repana et al., Citation2019), and 729 driver genes are downloaded from Cancer Gene Census (CGC) (Sondka et al., Citation2018).
To construct the gene similarity network, we also use 12 genetic features from multi-omics data sources (epigenomics, transcriptomics, and genomics) as the feature vector of the similarity network. These features have been proved to affect the mutation-based function influence score as shown in Table :
Table 1. 12 genetic characteristics of multimers data sources.
3.2. Experimental parameters
As shown in Figure (e), the SCN structure in this work is mainly composed of a 2-layer convolution layer, 2-layer pooling layer, and 2-layer full connection layer. In addition, we use zero filling in the second convolution layer. The filter size, the window size of the aggregation layer, and the step size used in the convolution and the full connection layer are set to 2, according to experience. To measure the effectiveness of the similarity network and select the number of best nearest neighbor genes, we set the value of k as (0, 4–10). When k is equal to 0, SCN degenerates back to the general convolutional neural network. This paper uses the evaluation index and root mean square error (RMSE) commonly used in machine learning. The definition of these two indicators is shown in Equations (Equation16
(16)
(16) ) and (Equation17
(17)
(17) ).
(16)
(16)
(17)
(17)
where
represents the true value,
represents the predicted value, and
represents the average value of y.
Table shows the gene function influence scores predicted by SCN under different k values. From the table, we can see that the of SCN on all data sets is close to 1, which shows the effectiveness of our method. At the same time, no matter which cancer type, SCN performs better than CNN in performance indicators
and RMSE, which shows that after adding the similarity network, it can learn the similarity of genes and the attributes of the original input data, to improve the accuracy of gene function impact score. We select the K value with the best
and RMSE in Table as the number of nearest neighbor genes of the similarity network and the best k value, such as the bold part.
Table 2. Performance indexes of gene similarity network convolution neural network under different k values.
4. Result analysis
4.1. Comparison of the number and accuracy of driver genes identified by different methods
Due to the wide heterogeneity of tumours, the number of driver genes varies in different types of cancers. The driver genes identification method based on sequencing data analysis can narrow the research scope of medical experiments. Therefore, it is extremely important to identify enough driver genes. If too few driver genes are identified, some key driver targets may be missed. If too many driver genes are identified, it will cause difficulties for subsequent medical experimental verification and further research.
The box plots in Figures show the number and precision and recall of different methods for driver genes in 10 cancer types with NCG6.0 as the known driver gene benchmark. The number of driver genes obtained by GASN is mostly concentrated between 60 and 120 in these ten cancer types, much higher than the other 17 compared methods. The second-ranked method is ActiveDriver, which obtained driver gene counts in the range of 30–80. Most of the other methods identified no more than 30 genes in the ten cancer types. Similarly, when NCG is used as the baseline driver benchmark, GASN has a much higher recall rate in 10 cancers than other comparative methods. In addition, our proposed method can maintain high accuracy while identifying a large number of driver genes. GASN's accuracy in identifying driver genes across the 10 cancer types ranged from 75% to 80%, much higher than other comparative algorithms.
Figure 3. The number of NCG6.0 genes identified by different methods in 10 cancer types.
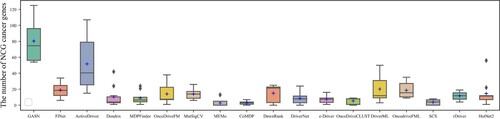
Figure 4. The precision of NCG6.0 genes identified by different methods in 10 cancer types.
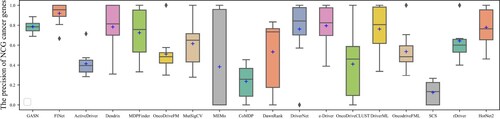
Figure 5. The recall of NCG6.0 genes identified by different methods in 10 cancer types.
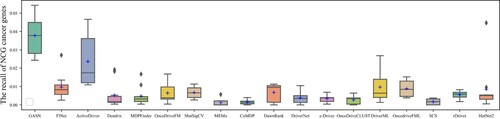
We also use CGC as a benchmark for known driver genes, which is currently the most widely used and accurate benchmark for known driver genes. The box plots in Figures show the number, precision, and recall of different methods for the 10 cancer types for which CGC is used as a benchmark for known driver genes. as can be seen in Figure , the number of CGC driver genes obtained by GASN ranges from 20 to 30 across the 10 cancer types, just below that of ActiveDriver. Figure shows the recall rates of the 18 methods across the 10 cancer types, with the mean recall rate of GASN being higher than the other methods compared to the other algorithms, although in individual cancers the recall rate of GASN is slightly worse than that of ActiveDriver. This does not mean that our method is ineffective, as the number of genes identified by other methods is much lower than the number of genes obtained by our proposed method.
Figure 6. The number of CGC genes identified by different methods in 10 cancer types.
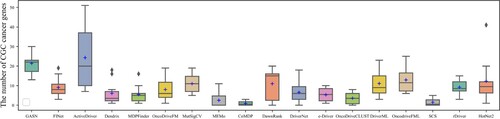
Figure 7. The precision of CGC genes identified by different methods in 10 cancer types.
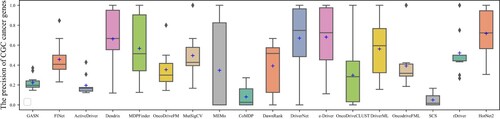
Figure 8. The recall of CGC genes identified by different methods in 10 cancer types.
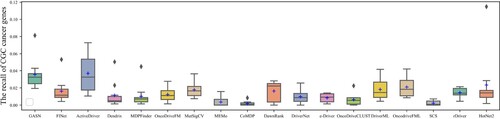
Based on the above analysis, we can see that the number and accuracy of driver genes identified by our method outperform other comparative methods, whether NCG6.0 or CGC is the known driver gene benchmark.
4.2. Enrichment analysis
The function of the enrichment analysis is to assess whether the identified driver genes have a common biological function. It is found that somatic mutations always target a set of cancer genes in regulatory and signaling pathways. Furthermore, these cancer-related driver gene mutations occur repeatedly in functional regions of proteins (e.g. kinase structural domains and binding domains), thereby disrupting key biological functions. In this study, we choose to enrich the three cancer types with the most identified candidate genes, BLRA, LUAD, and LUSC, and perform KEGG pathway enrichment analysis and gene ontology enrichment analysis using DAVID 6.8.
We select the top 118 candidate driver genes obtained from the identification of BLCA for enrichment analysis. In terms of biological processes, the selected genes focused on cell adhesion, bio-adhesion, cell development, and cellular component morphogenesis. In cellular components, these genes are mainly enriched in supramolecular complexes, extracellular matrix, protein extracellular matrix, neuronal fractions, and cytoplasmic regions, among others. In terms of molecular function, the selected genes are mainly enriched in ATP-dependent microtubule motor activity, minus-end-directed, structural molecule activity, calcium ion binding, actin binding, etc. Regarding the pathway analysis of the selected genes, these genes mainly affect the PI3K-Akt signaling pathway, Thyroid hormone signaling pathway, HIF-1 signaling pathway, FoxO signaling pathway, etc. Most of these pathways have been shown to be involved in cancer production and development. For example, the transcriptional activity of FoxO transcription factors is negatively regulated by PI3K/Akt, a the family mainly comprises FoxO1, FoxO3, and FoxO4, which are central molecules in the regulation of cellular stress responses and tissue-specific oncogenic molecules
For LUAD, we select the top 157 candidate driver genes for enrichment analysis. In terms of biological processes, the selected genes are mainly focused on cell adhesion, bio-adhesion, nervous system development, and cell development. In terms of cellular components, these genes are mainly enriched in cell bodies, cell-cell junctions, extracellular matrix, and supramolecular complexes, among others. In terms of molecular function, the selected genes are mainly enriched in calcium ion binding, ATP-dependent microtubule motor activity, minus-end-directed, macromolecular complex binding, ATP binding, etc. From the results of the pathway analysis of the selected genes, we know that they are mainly enriched in the PI3K-Akt signaling pathway, Apelin signaling pathway, Calcium signaling pathway, and Oxytocin signaling pathway.
In addition, for LUSC cancer, the selected genes are mainly enriched in cell adhesion, biological adhesion, cell development, cellular developmental process, etc. In terms of cellular composition, these genes are concentrated in the neuronal fraction, plasma membrane region, cell-cell junctions and cell bodies, etc. In terms of cellular composition, these genes are concentrated in neuronal fractions, plasma membrane regions, cell-cell junctions, and cell bodies, among others. In terms of biological function, the genes identified by GASN are mainly enriched in calcium ion binding, structural molecule activity, ATP-dependent microtubule motor activity, minus-end-directed, protein complex binding, cadherin, and cadherin. The pathway analysis of the selected genes showed that they mainly affect the PI3K-Akt signaling pathway.
5. Conclusions
In this study, we present the gamma distribution test for driver gene identification based on similarity networks (GASN), which identifies driver genes by combining machine learning and distributional statistics methods. A similarity network is employed to learn gene similarities and key feature information characterising the functional impact of genes. In addition, considering the modularity of driver genes, we classify genes into different cellular compartments and use gamma distribution tests within cellular compartments to identify important driver genes. Experimental results show that our method outperforms other comparison methods.
Our proposed method is easy to be clinically accepted and applied by comparing the differences between the simulated distribution of gene function impact scores observed and the simulated distribution of gene function impact scores obtained by prediction, which is well interpretable. Furthermore, because of the use of machine learning methods to predict driver genes, driver genes can be more easily identified in a large number of passenger genes, which provides great convenience for the ensuing biological experiments. However, we should recognise some limitations of this paper. For example, we did not consider the interactions between proteins in the expression regulatory network when constructing the similarity network. Instead, the stronger the interaction between two genes, the greater the likelihood that they will also have a greater similarity.
Acknowledgments
The authors would like to thank anonymous reviewers for their very detailed and helpful reviews. Dazhi Jiang: Conceptualization, Programming and writing. Runguo Wei: Conceptualization, Methodology, Writing and proofreading. Zhihui He: Programming and proofreading. Cheng Liu: Methodology, Writing and proofreading. Senlin Lin: Writing and proofreading. Yingqing Lin: Conceptualization, Methodology, Writing and proofreading.
Disclosure statement
No potential conflict of interest was reported by the authors
Additional information
Funding
References
- Acemel, R. D., Tena, J. J., Irastorza-Azcarate, I., Marlétaz, F., Gómez-Marín, C., & Gómez-Skarmeta, J. L. (2016). A single three-dimensional chromatin compartment in amphioxus indicates a stepwise evolution of vertebrate Hox bimodal regulation. Nature Genetics, 48(3), 336–341. https://doi.org/10.1038/ng.3497
- Akdeli, N., Riemann, K., Westphal, J., Hess, J., Siffert, W., & Bachmann, H. S. (2014). A 3′ UTR polymorphism modulates mRNA stability of the oncogene and drug target Polo-like Kinase 1. Molecular Cancer, 13(1), 1–10. https://doi.org/10.1186/1476-4598-13-87
- Al-Zaidy, S. A., Sahenk, Z., Rodino-Klapac, L. R., Kaspar, B., & Mendell, J. R. (2015). Follistatin gene therapy improves ambulation in becker muscular dystrophy. Journal of Neuromuscular Diseases, 2(3), 185–192. https://doi.org/10.3233/JND-150083
- Anandanadarajah, N., Chu, C. H., & Loganantharaj, R. (2021). An integrated deep learning and dynamic programming method for predicting tumor suppressor genes, oncogenes, and fusion from PDB structures. Computers in Biology and Medicine, 133, Article 104323. https://doi.org/10.1016/j.compbiomed.2021.104323
- Barber, T. D., Barber, M. C., Cloutier, T. E., & Friedman, T. B. (1999). PAX3 gene structure, alternative splicing and evolution. Gene, 237(2), 311–319. https://doi.org/10.1016/S0378-1119(99)00339-X
- Bashashati, A., Haffari, G., Ding, J., Ha, G., Lui, K., Rosner, J., & Shah, S. P. (2012). DriverNet: Uncovering the impact of somatic driver mutations on transcriptional networks in cancer. Genome Biology, 13(12), 1–14. https://doi.org/10.1186/gb-2012-13-12-r124
- Bertrand, D., Chng, K. R., Sherbaf, F. G., Kiesel, A., Chia, B. K., Sia, Y. Y., & Nagarajan, N. (2015). Patient-specific driver gene prediction and risk assessment through integrated network analysis of cancer omics profiles. Nucleic Acids Research, 43(7), e44-e44. https://doi.org/10.1093/nar/gku1393
- Binder, J. X., Pletscher-Frankild, S., Tsafou, K., Stolte, C., O'Donoghue, S. I., Schneider, R., & Jensen, L. J. (2014). COMPARTMENTS: Unification and visualization of protein subcellular localization evidence. Database, 2014. https://doi.org/10.1093/database/bau012.
- Chen, B., Shang, X., Li, M., Wang, J., & Wu, F. X. (2016). Identifying individual-cancer-related genes by rebalancing the training samples. IEEE Transactions on Nanobioscience, 15(4), 309–315. https://doi.org/10.1109/TNB.2016.2553119
- Chen, X., Feng, H. Y., & Wang, J. L. (2022). Robust coal granularity estimation via deep neural network with an image enhancement layer. Connection Science, 34(1), 472–491. https://doi.org/10.1080/09540091.2021.2015290
- Chen, Y., McGee, J., Chen, X., Doman, T. N., Gong, X., Zhang, Y., & Kouros-Mehr, H. (2014). Identification of druggable cancer driver genes amplified across TCGA datasets. PloS One, 9(5), Article e98293. https://doi.org/10.1371/journal.pone.0098293
- Ciriello, G., Cerami, E., Sander, C., & Schultz, N. (2012). Mutual exclusivity analysis identifies oncogenic network modules. Genome Research, 22(2), 398–406. https://doi.org/10.1101/gr.125567.111
- Cui, D., Ren, J., Shi, J., Feng, L., Wang, K., Zeng, T., & Gao, L. (2016). R132H mutation in IDH1 gene reduces proliferation, cell survival and invasion of human glioma by downregulating Wnt/β-catenin signaling. The International Journal of Biochemistry & Cell Biology, 73, 72–81. https://doi.org/10.1016/j.biocel.2016.02.007.
- Dees, N. D., Zhang, Q., Kandoth, C., Wendl, M. C., Schierding, W., Koboldt, D. C., & Ding, L. (2012). MuSiC: Identifying mutational significance in cancer genomes. Genome Research, 22(8), 1589–1598. https://doi.org/10.1101/gr.134635.111
- de Vries, P. H. (2020). Conditions for cognitive self-organisation implied by visual-word processing. Connection Science, 32(3), 292–332. https://doi.org/10.1080/09540091.2019.1682520
- Fay, M. P., & Feuer, E. J. (1997). Confidence intervals for directly standardized rates: A method based on the gamma distribution. Statistics in Medicine, 16(7), 791–801. https://doi.org/10.1002/(SICI)1097-0258(19970415)16:7¡¿1.0.CO;2-J
- Gnad, F., Baucom, A., Mukhyala, K., Manning, G., & Zhang, Z. (2013). Assessment of computational methods for predicting the effects of missense mutations in human cancers. BMC Genomics, 14(3), 1–13. https://doi.org/10.1186/1471-2164-14-S3-S7
- Gonzalez-Perez, A., & Lopez-Bigas, N. (2012). Functional impact bias reveals cancer drivers. Nucleic Acids Research, 40(21), e169-e169. https://doi.org/10.1093/nar/gks743
- Gu, H., Xu, X., Qin, P., & Wang, J. (2020). FI-net: Identification of cancer driver genes by using functional impact prediction neural network. Frontiers in Genetics, 11, Article 564839. https://doi.org/10.3389/fgene.2020.564839
- Guo, W. F., Zhang, S. W., Liu, L. L., Liu, F., Shi, Q. Q., Zhang, L., & Chen, L. (2018). Discovering personalized driver mutation profiles of single samples in cancer by network control strategy. Bioinformatics (Oxford, England), 34(11), 1893–1903. https://doi.org/10.1093/bioinformatics/bty006
- Han, Y., Yang, J., Qian, X., Cheng, W. C., Liu, S. H., Hua, X., & Lu, Y. (2019). DriverML: A machine learning algorithm for identifying driver genes in cancer sequencing studies. Nucleic Acids Research, 47(8), e45-e45. https://doi.org/10.1093/nar/gkz096
- He, Z., Lin, Y., Wei, R., Liu, C., & Jiang, D. (2022). Repulsion and attraction in searching: A hybrid algorithm based on gravitational kernel and vital few for cancer driver gene prediction. Computers in Biology and Medicine, 151, 106236. https://doi.org/10.1016/j.compbiomed.2022.106236.
- Heinemann, U., Illing, G., & Oschkinat, H. (2001). High-throughput three-dimensional protein structure determination. Current Opinion in Biotechnology, 12(4), 348–354. https://doi.org/10.1016/S0958-1669(00)00226-3
- Horn, H., Lawrence, M. S., Chouinard, C. R., Shrestha, Y., Hu, J. X., Worstell, E., & Lage, K. (2018). NetSig: Network-based discovery from cancer genomes. Nature Methods, 15(1), 61–66. https://doi.org/10.1038/nmeth.4514
- Hou, J. P., & Ma, J. (2014). DawnRank: Discovering personalized driver genes in cancer. Genome Medicine, 6(7), 1–16. https://doi.org/10.1186/s13073-014-0056-8
- Hou, Y., Gao, B., Li, G., & Su, Z. (2018). MaxMIF: A new method for identifying cancer driver genes through effective data integration. Advanced Science, 5(9), Article 1800640. https://doi.org/10.1002/advs.v5.9
- Huntley, R., Dimmer, E., Barrell, D., Binns, D., & Apweiler, R. (2009). The gene ontology annotation (goa) database. Nature Precedings, 10, 1–1. https://doi.org/10.1038/npre.2009.3154.1
- Isik, Z., & Ercan, M. E. (2017). Integration of RNA-Seq and RPPA data for survival time prediction in cancer patients. Computers in Biology and Medicine, 89, 397–404. https://doi.org/10.1016/j.compbiomed.2017.08.028
- Jiang, D., Lin, Y., Zhu, W., & He, Z. (2022). A parallel based evolutionary algorithm with primary-auxiliary knowledge. Information Sciences, 610, 1122–1142. https://doi.org/10.1016/j.ins.2022.08.016
- Jiang, D., Tu, G., Jin, D., Wu, K., Liu, C., Zheng, L., & Zhou, T. (2021). A hybrid intelligent model for acute hypotensive episode prediction with large-scale data. Information Sciences, 546, 787–802. https://doi.org/10.1016/j.ins.2020.08.033
- Joly, Y., Dove, E. S., Knoppers, B. M., Bobrow, M., & Chalmers, D. (2012). Data sharing in the post-genomic world: The experience of the international cancer genome consortium (ICGC) data access compliance office (DACO). PLoS Computational Biology, 8(7), Article e1002549. https://doi.org/10.1371/journal.pcbi.1002549
- Khan, J., Wei, J. S., Saal, L. H., Ladanyi, M., & Meltzer, P. S. (2001). Classication and diagnostic prediction of cancers using gene expression proling and articial neural networks. Nature Medicine, 7(6), 673–679. https://doi.org/10.1038/89044
- Kumar, R. D., Swamidass, S. J., & Bose, R. (2016). Unsupervised detection of cancer driver mutations with parsimony-guided learning. Nature Genetics, 48(10), 1288–1294. https://doi.org/10.1038/ng.3658
- Lawrence, M. S., Stojanov, P., Polak, P., Kryukov, G. V., Cibulskis, K., Sivachenko, A., & Getz, G. (2013). Mutational heterogeneity in cancer and the search for new cancer-associated genes. Nature, 499(7457), 214–218. https://doi.org/10.1038/nature12213
- Le, N. Q. K., & Ho, Q. T. (2022). Deep transformers and convolutional neural network in identifying DNA N6-methyladenine sites in cross-species genomes. Methods (San Diego, Calif.), 204, 199–206. https://doi.org/10.1016/j.ymeth.2021.12.004
- Le, N. Q. K., & Nguyen, B. P. (2019). Prediction of FMN binding sites in electron transport chains based on 2-D CNN and PSSM profiles. IEEE/ACM Transactions on Computational Biology and Bioinformatics, 18(6), 2189–2197. https://doi.org/10.1109/TCBB.2019.2932416
- Leiserson, M. D., Vandin, F., Wu, H. T., Dobson, J. R., & Raphael, B. R. (2014). Pan-cancer identification of mutated pathways and protein complexes. Cancer Research, 74(19), 5324–5324. https://doi.org/10.1158/1538-7445.AM2014-5324
- Lin, S., Song, X., Xu, Z., Zhang, X., Lin, Y., Zhang, R., & Wan, X. (2021). Moment invariants with data augmentation for tongue image segmentation. In 2021 IEEE international conference on bioinformatics and biomedicine (BIBM) (pp. 988–993).
- Liu, C., Wu, S., Jiang, D., Yu, Z., & Wong, H. S. (2022). View-aware collaborative learning for survival prediction and subgroup identification. IEEE Transactions on Biomedical Engineering, 70(1), 301–314. https://doi.org/10.1109/TBME.2022.3190050
- Liu, J., Lichtenberg, T., Hoadley, K. A., Poisson, L. M., Lazar, A. J., Cherniack, A. D., & Cope, L. (2018). An integrated TCGA pan-cancer clinical data resource to drive high-quality survival outcome analytics. Cell, 173(2), 400–416. https://doi.org/10.1016/j.cell.2018.02.052
- Luo, P., Ding, Y., Lei, X., & Wu, F. X. (2019). deepDriver: Predicting cancer driver genes based on somatic mutations using deep convolutional neural networks. Frontiers in Genetics, 10, 13. https://doi.org/10.3389/fgene.2019.00013
- Mai, G., Hong, Y., Fu, S., Lin, Y., Hao, Z., Huang, H., & Zhu, Y. (2020). Optimization of Lennard-Jones clusters by particle swarm optimization with quasi-physical strategy. Swarm and Evolutionary Computation, 57, Article 100710. https://doi.org/10.1016/j.swevo.2020.100710
- Mularoni, L., Sabarinathan, R., Deu-Pons, J., Gonzalez-Perez, A., & López-Bigas, N. (2016). OncodriveFML: A general framework to identify coding and non-coding regions with cancer driver mutations. Genome Biology, 17(1), 1–13. https://doi.org/10.1186/s13059-016-0994-0
- Porta-Pardo, E., & Godzik, A. (2014). e-Driver: A novel method to identify protein regions driving cancer. Bioinformatics (Oxford, England), 30(21), 3109–3114. https://doi.org/10.1093/bioinformaticsbtu499
- Rahimi, M., Teimourpour, B., & Marashi, S. A. (2019). Cancer driver gene discovery in transcriptional regulatory networks using influence maximization approach. Computers in Biology and Medicine, 114, Article 103362. https://doi.org/10.1016/j.compbiomed.2019.103362
- Reimand, J., & Bader, G. D. (2013). Systematic analysis of somatic mutations in phosphorylation signaling predicts novel cancer drivers. Molecular Systems Biology, 9(1), 637. https://doi.org/10.1038/msb.2012.68
- Repana, D., Nulsen, J., Dressler, L., Bortolomeazzi, M., Venkata, S. K., Tourna, A., & Ciccarelli, F. D. (2019). The network of cancer genes (NCG): A comprehensive catalogue of known and candidate cancer genes from cancer sequencing screens. Genome Biology, 20(1), 1–12. https://doi.org/10.1186/s13059-018-1612-0
- Reyna, M. A., Leiserson, M. D., & Raphael, B. J. (2018). Hierarchical HotNet: Identifying hierarchies of altered subnetworks. Bioinformatics (Oxford, England), 34(17), i972–i980. https://doi.org/10.1093/bioinformatics/bty613
- Sondka, Z., Bamford, S., Cole, C. G., Ward, S. A., Dunham, I., & Forbes, S. A. (2018). The COSMIC cancer gene census: Describing genetic dysfunction across all human cancers. Nature Reviews Cancer, 18(11), 696–705. https://doi.org/10.1038/s41568-018-0060-1
- Tamborero, D., Gonzalez-Perez, A., & Lopez-Bigas, N. (2013). OncodriveCLUST: Exploiting the positional clustering of somatic mutations to identify cancer genes. Bioinformatics (Oxford, England), 29(18), 2238–2244. https://doi.org/10.1093/bioinformatics/btt395
- Vandin, F., Upfal, E., & Raphael, B. J. (2012). De novo discovery of mutated driver pathways in cancer. Genome Research, 22(2), 375–385. https://doi.org/10.1101/gr.120477.111
- Wang, X., Wang, C., Yan, G., Kang, Y., Sun, G., Wang, S., & Zhao, Y. (2020). BAP18 is involved in upregulation of CCND1/2 transcription to promote cell growth in oral squamous cell carcinoma. EBioMedicine, 53, Article 102685. https://doi.org/10.1016/j.ebiom.2020.102685
- Wang, Z., Ng, K. S., Chen, T., Kim, T. B., Wang, F., Shaw, K., & Chen, K. (2018). Cancer driver mutation prediction through Bayesian integration of multi-omic data. PloS One, 13(5), Article e0196939. https://doi.org/10.1371/journal.pone.0196939
- Wendl, M. C., Wallis, J. W., Lin, L., Kandoth, C., Mardis, E. R., Wilson, R. K., & Ding, L. (2011). PathScan: A tool for discerning mutational significance in groups of putative cancer genes. Bioinformatics (Oxford, England), 27(12), 1595–1602. https://doi.org/10.1093/bioinformatics/btr193
- Wyckoff, G. J., Malcom, C. M., Vallender, E. J., & Lahn, B. T. (2005). A highly unexpected strong correlation between fixation probability of nonsynonymous mutations and mutation rate. Trends in Genetics, 21(7), 381–385. https://doi.org/10.1016/j.tig.2005.05.005
- Xie, L., Zhang, Y., & Wu, C. L. (2019). Microphthalmia family of transcription factors associated renal cell carcinoma. Asian Journal of Urology, 6(4), 312–320. https://doi.org/10.1016/j.ajur.2019.04.003
- Xing, H., Kembel, S. W., & Makarenkov, V. (2020). Transfer index, NetUniFrac and some useful shortest path-based distances for community analysis in sequence similarity networks. Bioinformatics (Oxford, England), 36(9), 2740–2749. https://doi.org/10.1093/bioinformatics/btaa043
- Zhang, J., Wu, L. Y., Zhang, X. S., & Zhang, S. (2014). Discovery of co-occurring driver pathways in cancer. BMC Bioinformatics, 15(1), 1–14. https://doi.org/10.1186/1471-2105-15-S10-P1
- Zhang, L., Zhou, W., Velculescu, V. E., Kern, S. E., Hruban, R. H., Hamilton, S. R., & Kinzler, K. W. (1997). Gene expression profiles in normal and cancer cells. Science (New York, N.Y.), 276(5316), 1268–1272. https://doi.org/10.1126/science.276.5316.1268
- Zhao, J., Zhang, S., Wu, L. Y., & Zhang, X. S. (2012). Efficient methods for identifying mutated driver pathways in cancer. Bioinformatics (Oxford, England), 28(22), 2940–2947. https://doi.org/10.1093/bioinformatics/bts564