
 ?Mathematical formulae have been encoded as MathML and are displayed in this HTML version using MathJax in order to improve their display. Uncheck the box to turn MathJax off. This feature requires Javascript. Click on a formula to zoom.
Abstract
Asset price jumps are very common in financial markets, and they are essential to accurately predict volatility. This article focuses on 50 randomly selected stocks from the Chinese stock market, utilising high-frequency data to construct two jump models, the heterogeneous autoregressive quarticity jump model (HARQ-J) and the full heterogeneous autoregressive quarticity jump model (HARQ-F-J), which take into account jump variables based on existing models (HARQ and HARQ-F). To further enhance the accuracy of our volatility forecasts, the study combines the newly constructed models with the machine learning (ML) to form a hybrid model. Finally, the empirical research shows that the new hybrid model performs better than existing traditional prediction methods. In particular, the long- and short-term memory (LSTM) function is significantly better than other machine learning functions. Among all the LSTM models tested by the model confidence set (MCS), the HARQ-F-J-LSTM model has the highest prediction accuracy, followed by the HARQ-J-LSTM model.
1. Introduction
Volatility is one of the most important indicators of the financial market. It is directly related to market risk and can effectively reflect the quality and efficiency of the financial market. Volatility has a close impact on the formulation of enterprise trading strategies and leverage decisions, consumer behaviour and patterns, option pricing and related macroeconomic variables. Therefore, the prediction of volatility plays an important role in asset pricing and risk management. For many financial market practitioners and regulators, it is important to obtain accurate volatility forecasts.
Meanwhile, in the era of big data, people can easily and quickly obtain high-frequency data and ultra-high-frequency data, such as the financial time series with the frequency of minutes or seconds. However, since the information in the internet financial market continuously affects the value fluctuation process of the entire securities market, the discrete collection of data will inevitably lead to the loss of information in varying degrees. Compared with the low-frequency data, the (ultra) high-frequency data can help us understand the market rules better. Therefore, the use of high-frequency data in predicting volatility has become one of the hotspots in the academic and financial industry.
In recent years, researchers have conducted a variety of studies on the volatility model prediction based on high-frequency data and improved the prediction accuracy. Müller et al. (Citation1997) proposed the heterogeneous market hypothesis and adopted different prices to trade facing different market operations, and the changes and fluctuations of market prices are different. Merton (Citation1976) believed that in most normal trading situations, asset prices follow a continuous sample path, but in the event of significant or abnormal information, asset prices will jump, which also causes dramatic changes in yield volatility, resulting in jump behaviour. Andersen et al. (Citation2003) firstly put forward the estimation of volatility on the basis of high-frequency data called realised volatility (RV). Then Corsi (Citation2008) proposed a heterogeneous autoregression model (HAR) based on the heterogeneous market hypothesis and the long memory of volatility. Bollerslev et al. (Citation2016) proposed volatility-based forecasting models Full Heterogeneous Autoregressive quarticity jump model (HARQ) and Full Heterogeneous Autoregressive quarticity jump model (HARQ-F) that allow the (estimated) parameters of the model to change explicitly with the degree of measurement error.
Jumps are very common in the financial field – which can cause significant fluctuations in the stock market, even leading to a collapse of the entire securities market. Huizhen et al. (Citation2011) argued that for short-term forecast, the prediction result of jump and continuous volatility component separation model is better than other volatility prediction models. Empirical results in Wu Hengyu and Fuqiang (Citation2015) show that in the short-term, jump and continuous volatility have significant differences in the prediction of future realised volatility, so the impact of jump on volatility cannot be ignored. Based on the quadratic power variation, Wang Chunfeng et al. (Citation2008) conducted jump screening on the data in the Shanghai Stock Exchange Index and they found that the model with jump can better predict the volatility of China's financial asset market for a long time. The empirical results of Buraschi et al. (Citation2007) indicate that the existence of jump variables is inevitable, and the occurrence of jump behaviour will to some extent increase the market risk of financial markets. Andersen et al. (Citation2007) clearly noted the importance of jump in financial prices for pricing and volatility prediction. The heterogeneous autoregression jump model (HAR-J) is proposed by them to further improve the accuracy of prediction, considering jump variables. The impact of jumps on volatility prediction results cannot be ignored; therefore, inspired by Andersen, we will add jump variables to the existing HARQ and HARQ-F models to construct HAR-J and HARQ-F-J models and conduct volatility prediction analysis.
Compared with traditional metrological prediction, machine learning is a non-parametric method that has fewer limitations and assumptions in modelling. As long as there is enough data, modelling and prediction can be carried out. For example, the research of Ormoneit and Neuneier (Citation1996), Miranda and Burgess (Citation1997), Baruník and Křehlík (Citation2016) and Oliveira et al. (Citation2017) showed that the machine learning method can capture the characteristics of the nonlinear relationship that is helpful to predict the volatility. With the continuous innovation of machine learning technology, deep learning is more and more widely used. Maknickienė and Maknickas (Citation2012) improved the prediction performance of feedforward neural network by using a special type of Recurrent Neural Network(RNN) LSTM model, which was widely used later. Chen et al. (Citation2015) used LSTM model to predict the return of China's stock market, and confirmed that LSTM model has better performance than random prediction method. Fischer and Krauss (Citation2018) used LSTM neural network to predict the Standard and Poor's 500 index component stocks out of the sample, the results showed that LSTM neural network was much better than random forest (RAF), deep neural network (DNN) and logistic regression classifier (LOG) in predicting portfolio returns. Sun et al. (Citation2018) proposed AdaBoost-LSTM ensemble learning method and found that this algorithm is superior to traditional single prediction, especially in nonlinear and irregular data series. Bukhari et al. (Citation2020) combined LSTM and ARFIMA to find that the prediction effect and accuracy of the mixed model were better than that of the traditional model. Weihua (Citation2018) used MCS detection method to comprehensively evaluate the prediction effect of the model. It is found that the prediction effect based on LSTM neural network model is the best. Kim and Won (Citation2018) predicted the volatility of stock price index based on multivariate GARCH model, and found that the prediction effect of the integrated LSTM neural network was better than that of existing econometric models. Guangying et al. (Citation2021) predicted the realised volatility based on LSTM neural network and found that the prediction effect was better than the traditional model. Chuan and Yanhui (Citation2022) used LSTM to predict the newly constructed variables found that compared with the traditional econometric economic model, LSTM prediction improves the accuracy of prediction and has better Goodness of fit. Dongyang and Ling (Citation2022) used the LSTM to predict high-dimensional and high-frequency data, and found that the data features were effectively described and the prediction accuracy of each dimension was significantly improved. Petrozziello et al. (Citation2022) used LSTM to predict daily stock fluctuations and found that LSTM has a better prediction ability than univariate parameter methods. Given that machine learning has some advantages over traditional methods in predicting volatility and can predict long-term memory time series well, we combine the machine learning with models for forecasting analysis.
The research on the accuracy of volatility prediction is still in progress. In recent years, the field of realised volatility modelling has witnessed significant improvements in prediction performance through the development of advanced models such as HARQ and HARQ-F. To further enhance predictive ability, we propose constructing two new models, namely HARQ-J and HARQ-F-J, by incorporating jump variables. Given the predictive advantages of machine learning in various fields, we explore the potential benefits of combining the new constructed models with machine learning techniques. In addition, while many scholars have conducted research and analysis on stock indices, few have focused on high-frequency data of individual stocks in the Chinese stock market. Therefore, we aim to improve the accuracy of the realised volatility forecast with high-frequency data of individual stocks. Based on the above issues, we conducted the research. In this article, we randomly selected 50 effective high-frequency stock data from numerous stocks in Shanghai and Shenzhen Stock Exchanges, excluding missing values and outlier and established HARQ-J and HARQ-F-J models by adding jumps to the HARQ and HARQ-F models. At the same time, through prediction and analysis using machine learning methods (including RNN, Decision Tree (DT), KNN, LSTM, etc.), we obtained the best prediction results from the LSTM model. We combine the jump model with the LSTM model, which is the hybrid model, to predict the realised volatility based on stock data in China's stock market, and compared and analysed the results of traditional measurement models and machine learning algorithms. In addition, we attempt to provide a practical guide for studying the volatility of securities in financial markets.
The article structure is as follows: Section 2 introduces the theoretical framework of the model. Section 3 describes the HAR model and introduces the jump as an independent variable into the HARQ and HARQ-F volatility model frameworks to establish HARQ-J and HARQ-F-J models. Section 4 gives model evaluation, including MCS testing. Section 5 using the high frequency data from Shanghai and Shenzhen 300 stock index; Moreover, MCS test is used to analyse and compare the prediction ability of the models. Section 6 gives conclusions.
2. Theoretical framework
Let be the true logarithm price of assets at time t, it is generally assumed that asset pricing has a continuous time semi-martingale process. The continuous time jump diffusion process traditionally used for asset pricing can be expressed as:
(1)
(1) Where
is the drift, which is a continuous and bounded local variation process.
is a local martingale process, where
is a non-negative random process,
is the standard Brown motion.
denotes the poisson counting process with time change intensity
, where
.
is the size of the jump at time t, that is, the size of the discrete jump in the logarithmic price, where
.
Assuming that the change of the rate of return is observable, its quadratic variation at the time t is:
(2)
(2) where
is referred to as the integral volatility and represents the continuous part,
represents the discrete jumping part.
2.1. High-frequency data, quadratic variation and jump
Among the realised volatility of intraday high-frequency data income proposed by Andersen et al. (Citation2003), the income in period of discrete samples is expressed as
, and the realised volatility in a day is expressed as:
(3)
(3)
Accordingly, Realised Quality (RQ) can be expressed as:
(4)
(4)
For generality and simplicity, is usually assumed to be a positive integer. When
,
(5)
(5)
Barndorff-Nielsen (Citation2004) proposed Bi-Power Variation (BPV), BPV can better describe the continuous part of the quadratic variation, with unbiased estimation of integral fluctuation, and better robustness in jump description, as follows:
(6)
(6) where
.
When ,
(7)
(7)
Combining (Equation3(3)
(3) ) and (Equation7
(7)
(7) ), the difference between
and
is the estimate of discrete jump, namely:
(8)
(8)
Usually, the result of the (Equation8(8)
(8) ) may be negative. we use the following processing methods are adopted to ensure that the discrete jump part is not negative:
(9)
(9)
3. Jump modelling based on HAR
The model prediction is based on the daily realised volatility. The heterogeneous autoregression model (HAR) proposed by Andersen et al. (Citation2003) can better consider the heterogeneity and model factors, which is expressed as follows:
(10)
(10) where
.
and
represent the weekly and monthly cumulative average realised volatility respectively. Andersen et al. (Citation2007) introduced jump variables into HAR model to build HAR-J model and HAR-CJ model, where HAR-J model is represented as follows:
(11)
(11)
(12)
(12)
Bollerslev et al. (Citation2016) allowed the parameters of the model to change with the degree of (estimated) measurement error, and added the measurement error to the existing model, which is specifically expressed as follows: (13)
(13)
(14)
(14) where
. Formula (Equation13
(13)
(13) ) is “HARQ” model, and formula (Equation14
(14)
(14) ) is “Full HARQ” or “HARQ-F” model. Motivated by Andersen et al. (Citation2007) adding jump variables and building models, this paper adds jump variables to HARQ and HARQ-F models to build HARQ-J and HARQ-F-J, which are respectively expressed as follows:
(15)
(15)
(16)
(16)
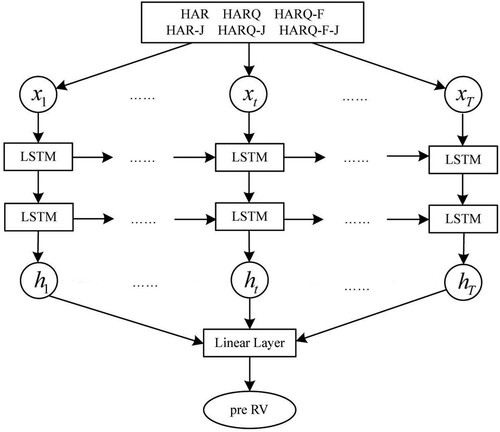
4. Machine learning (ML)
Machine learning is a non-parametric method that has fewer limitations and assumptions in modelling. As long as there is enough data, modelling and prediction can be carried out. Machine learning algorithms include LSTM, RNN, KNN and TD, etc. This paper uses the machine learning to predict volatility model using the vector ,
,
,
,
,
and
as input variables, namely:
(17)
(17) where d, w, and m represent day, week, and month, respectively.
,
,
,
,
,
,
. Where ts is the test step.
The architecture of the model is given below. x and h represent the input and output values of the hidden layer, respectively (Figure ).
Figure 1. The architecture of models.
5. Model evaluation
Patton (Citation2011) and Hansen (Citation2005) employed a variety of methods to compare the accuracy of volatility prediction, but the optimal loss function has not been determined, so many literature studies use partial loss function to evaluate the prediction effect of the model. The following 6 loss functions are selected to measure the prediction effect within and outside the sample of empirical data , namely, Mean Squared Error (MSE), Heterogeneous Mean Squared Error (HMSE), Mean Absolute Error (MAE), Heterogeneous Mean Absolute Error (HMAE), Quasi likelihood (QLIKE).
(18)
(18) where T is the number of predicted samples and
is the predicted value of
by different models.
However, the conclusion obtained by judging the value of the loss function is not rigorous. For example, when there is an outlier in the data, it often affects the value of the loss function. Therefore, MCS test will be adopted (referred to Feng et al., Citation2015), which is a process of testing the significance between different models based on equivalence testing and exclusion criteria, thereby deleting the models with poor prediction ability in the set, and ranking the prediction accuracy of the models, and make the conclusion more robust and rigorous.
The steps for MCS inspection are as follows:
Given
,Where
at the significance level α, use equivalence test to test null hypothesis; If we accept the null hypothesis, then define
The survival condition that must be met in model testing is that the p-value of the model must be greater than the significance level, that is, the larger the p-value under the model, the higher the prediction accuracy of the model, and the more accurate the prediction results of the model.
6. Empirical research
6.1. Data source and relevant characteristics
The sample data studied in this paper is the 5 minFootnote1 high-frequency data from 2015-01-01 to 2020-04-28 of 50 stocksFootnote2 screened from the main board of Shanghai and Shenzhen Stock Exchange, including opening price, closing price and trading volume (excluding holidays, a total of 1296 trading days). On the premise of 5 min high-frequency data, the sample of each trading day is 48, and the total observation is 62,208. Since the empirical results of 50 stocks show two different results, they are divided into two groups: A and B, according to the results after considering jump variables. Group A stock data have a much better prediction effect after adding jump variables, while Group B stock data results show that the prediction results deteriorate after adding jump variables, so we choose one stock in the two groups, respectively: Shanxi Coking Coal and Angang Steel, as examples to explore.
Table shows the descriptive statistical characteristics of the return rate data of six randomly selected stocks in different industries. PAB stands for Ping An Bank, SZP for Shenzhen property, ZG for Zhongcheng Shares, YTP for Yantian port, WCP for Weichai Power and HTH for Huatian Hotel. This table shows that there is a large gap between the maximum value and the minimum value, and the return rate has strong volatility. The kurtosis is much higher than the normal distribution and the kurtosis and skewness indicate that the returns of each series have a significant ‘biased’ and ‘peak’ non-normal state.
Table 1. Descriptive statistics of return rate of stock data of six different industries.
The following is a detailed analysis of the data of Shanxi Coking coal. Figure shows the fluctuation trend of log return data of 5 min in the observed trading day. Figure shows the realised volatility trend.
Figure 2. 5-min logarithmic Income Fluctuation Trend.
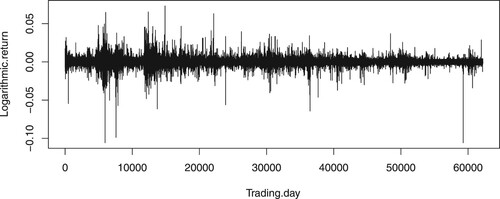
Figure 3. Realised volatility trend.
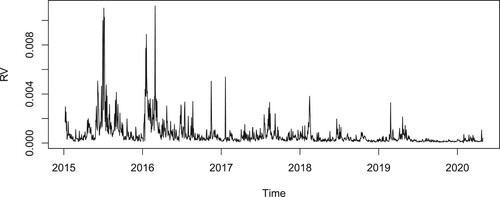
It can be seen from Figures and that the fluctuation trend of logarithmic return and realised volatility are relatively stable and the fluctuation is clustered. In addition, the data trend of 2015 and 2016 is more prominent than those of other periods.
Table shows the regression results of six models based on the stock data of Shanxi coking coal. It can be seen that is negative in any model, and as the value of RQ increases, the information of current RV on future RV is lower, and the value of
tends to zero, which is consistent with Bollerslev's analysis results. It is observed that the jump coefficient estimated by HAR-J is not significant, while the jump in HARQ-J and HARQ-F-J is significant, which indicates the data of some stocks in China do not conform to the theory proposed by Andersen et al. (Citation2007) pointed out that this phenomenon is due to the existence of real jump and false jump in the jump, and the real jump has a significant impact on the volatility. However, in group A, the coefficient of jump in 30 stocks is significant in each model. Therefore, in most cases, the prediction error is smaller when jump is added to the model, and the goodness of fit value of the model with jump factor is significantly larger than that without jump factor. That is, adding jump variable to the model can improve the fitting accuracy of the model.
Table 2. Estimation results of various volatility model parameters of Shanxi coking coal sample population.
Table gives the result of the model regression parameter estimation of Angang. It can be seen that under the same conclusion in Tables and , the jump variable is not significant in the three models HAR-J, HARQ-J and HARQ-F-J, and the fitting of the model is not very good. The results of other stock data in group B are the same as above. It can be inferred from Tables and that not all individual stock in China's stock market are suitable for the model and they need further processing. There may be noise in the data, and even the definition of jump is too simple. More factors need to be considered, such as true and false jump, noise, etc.
Table 3. Parameter estimation results of various volatility models of Angang stock sample population.
6.2. Comparison of prediction results
To investigate the impact of jump on the realised volatility prediction, the data of Shanxi coking coal is still taken as an example to study. In the prediction of each model, the prediction effect is evaluated for the data within and outside the sample. The total sample size of realised volatility is 1274, and the window size is fixed at 1037. Meanwhile, machine learning is used for prediction. The out-of-sample prediction uses the rolling time window method, taking 637 trading days as the training set in the neural network, and the last 50 days as the out-of-sample testing data. The specific operation can be found in Guangying et al. (Citation2021). Each model evaluates and predicts the data within and outside the sample, and the results are as follows:
Table is the prediction effect of volatility model under various models based on Shanxi coking coal stock data. For comparison, MSE in the sample is multiplied by 10-6, MAE outside the sample is multiplied by 10-2, MSE outside the sample multiplied by 10-8, At the given significance level, all parameters pass the significance test at the level of 0.05. From the data in Table , it can be seen that the prediction effect of the model with jump variables is generally much better, indicating that the accuracy of volatility prediction has been improved. Among them, the effect of MSE predicted out-of-sample prediction is particularly good, which is also consistent with the conclusion of Fulvio Corsi, that is, the out of sample prediction effect of the model is significant, stable and significantly superior to the standard model. However, in the case of HAME, the prediction effect of HAR-J is worse than that of HAR, which is inconsistent with the conclusion of Andersen et al. (Citation2007). Among the 50 stocks, the data of 32 stocks with jump is better than the model without jump, so it is still meaningful to consider jump into the model.
Table 4. Prediction effect of volatility model under each model.
Compared with a traditional econometric model, machine learning method is simpler and more efficient. Table shows the prediction results of volatility based on different machine learning models for high-frequency data. It can be found that except for the MSE data in the sample, the other loss function values of the LSTM model are the smallest. Thus, we combine the LSTM model in machine learning and the traditional model with jump into a combined model to predict the volatility, and the corresponding loss function is calculated to further compare the results.
Table 5. Prediction effect of volatility based on different machine learning models.
Table shows the results of hybrid model for rolling window prediction. Comparing Tables and , it is not difficult to find that: (1) The prediction conclusion of the hybrid model is consistent with that of the traditional model, that is, the HARQ-F-J-LSTM model is optimal. (2) Whether within or outside the sample (except QLIKE), the volatility prediction error of each model based on LSTM neural network is small (the results of 50 stocks are the same), and the error is smaller. Since the premise of QLIKE is that the error is subject to normal distribution, the value of QLIKE in the neural network model is generally larger than that in the traditional model. In conclusion, it is better to use a neural network to predict the volatility of stock data.
Table 6. Prediction effect of mixed models based on LSTM.
However, it is not rigorous to evaluate the prediction effect of the model only by using the size of the loss function. Next, MCS test is adopted, in which the significance level is 0.01. According to the principle of MCS test, volatility models with p-value less than 0.01 will be deleted in the test, and the prediction accuracy of such models is relatively poor. On the contrary, volatility prediction models with p-value greater than 0.01 will be retained. The MCS test results of each model are given in Table . It is not difficult to find that compared with the model without jump, the volatility prediction ability of the model with jump is significantly improved, and the corresponding loss function values of the latter are all greater than or equal to the former, that is, adding jump variables can improve the prediction ability of the model to a certain extent. For the value of the loss function, the value of HARQ-J is 1 except MAE, HMAE and LOG; and the HAR-F-J and HARQ-F are equal to 1, which also shows that its prediction ability is very good. It can be found that the prediction of HAR and HAR-J is far inferior to the latter. Therefore, MCS test is conducted for the latter four models, see Table .
Table 7. MCS test results of prediction results of traditional models with different volatility.
Table 8. MCS test results of prediction results of traditional models of the last four volatility.
Combined with Tables and , it is shown that HARQ-F-J model has the best prediction ability under any loss function, and HARQ-F model is second best.
However, the prediction result of the LSTM combined model based on the traditional model data considering jumping is better than that of the traditional model. Therefore, we also perform MCS test on the data predicted by LSTM, and the results are in Table .
Table 9. MCS test results based on prediction results of different volatility models under LSTM.
According to Tables and , it can be seen that the HARQ-F-J model has the best result and the HARQ-F ranks in the second, which is the same as the result of the traditional model. Combined with the results in Tables and , it can be concluded that the prediction accuracy of the combined model based on the traditional model with LSTM is better than that of the traditional model.
Table 10. MCS test results based on the prediction results of the last four volatility models under LSTM.
To sum up, it can be found that the analysis of stock data is very different due to the different main businesses of different industries. For the stock data of group A enterprises such as trade, real estate, financial financing, luxury goods, machinery and other industries, the impact of jump variables on the accuracy of volatility prediction can not be ignorable, and it is greatly affected by external factors, such as the epidemic, tariffs, trade wars and so on. For group B enterprises, such as, electric power, iron and steel smelting, planting, clean energy, etc., their products are indispensable in life, and meet the needs of high-quality development, the enterprises operate stably. The introduction of jump variables increases the error of the prediction of stock data volatility. Therefore, while considering individual stock, we need to divide the industry and fully consider various influencing factors of the industry, so as to better decide whether to consider multiple variables.
7. Conclusion and prospect
Volatility is an important indicator for measuring financial risk, and the accuracy of predictions directly affects investors' budget decisions. Therefore, the accuracy of volatility has always been a concern. Based on high-frequency individual stock data, this paper constructs HARQ-J and HARQ-F-J models by introducing jump variables into HARQ and HARQ-F models, combines traditional models with machine learning to perform out-of-sample prediction, and compares and analyses the results with traditional models. The following conclusions are drawn: (1) The prediction accuracy of HARQ-J and HARQ-F-J models is significantly better than the original model, However, not all stock data are used to reduce volatility prediction errors by adding jump variables to the model. Therefore, a specific analysis is required based on the characteristics of individual stocks. (2) The traditional method and hybrid model can find that the latter has significantly better volatility prediction results after adjusting parameters compared to the traditional model, and its performance is more stable. (3) From the MCS test results, we can find that HARQ-F-J-LSTM model has the highest prediction accuracy among the six models, with HARQ-F-LSTM model taking the second place six models, with HARQ-F-LSTM model taking the second place.
The test methods and empirical conclusions have certain practical significance for the research of individual stock data in China. By combining machine learning with traditional models to consider jump variables in the model, certain results have been achieved in the analysis of volatility prediction effects. During the research process of this article, further exploration can be conducted, such as: (1) The calculation of jump variables is a challenge that needs further improvement. Asymmetric sign jumps can be considered to further improve the prediction accuracy of volatility. (2) The prediction of volatility not only depends on the closing price but also is affected by other trading information in the market, such as trading volume, trading rate, market sentiment, etc. Therefore, incorporating transaction information into the model will help further improve the prediction accuracy of volatility. (3) At present, deep learning is also very helpful for prediction, and the CNN and LSTM in our manuscript are the models in deep learning, which have many improved versions, such as Gated Recurrent Unit (GRU). In the future, we can further improve the prediction accuracy of research problems by designing and improving deep learning neural networks.
Disclosure statement
No potential conflict of interest was reported by the author(s).
Additional information
Funding
Notes
1 since there is noise in the price itself, the shorter the data interval, the more unreliable the estimated value of the Volatility Prediction, which will lead to a large accuracy error. According to the literature studies, Yong (Citation2012) and Wuyi and Baiqi (Citation2012).
2 50 stocks in Shanghai and Shenzhen Stock Exchange: group A: Shanxi coking coal, Shenzhen energy, Desai battery, Yantian port, Zoomlion Heavy Technology, Financial Street, Tongcheng Holdings, Dong'e Ejiao, Huatian Hotel, Jiangling Automobile, Taishan Petroleum, Fiberhome Electronics, Su Changchai a, Guofeng new materials, Jilin Aodong, SHUNFA Hengye, Yanjing Beer, Sichuan Meifeng, Guangfa Securities, ultrasonic electronics, Luxi Chemical, Zhangyu a, Weichai heavy machinery, Emeishan a, Jinling pharmaceutical Hisense home appliances, China Resources Sanjiu, Siyuan electric, Huafu fashion, Huate dyne, Ping An Bank, Shenzhen property, Liugong, Shantui shares, Zhenghong technology; Group B: Angang Steel, Zhongcheng, Hunan investment, yuehongyuan a, Gujing gongjiu, Xingrong environment, Jinkong electric power, Tieling new city, Shandong Haihua, Chengde Lulu, Changyuan electric power, Denghai seed industry, state machinery Seiko, Hainan expressway, and China nuclear technology.
References
- Andersen, T. G., Bollerslev, T., & Diebold, F. X. (2007, November). Roughing it up: Including jump components in the measurement, modeling, and forecasting of return volatility. Review of Economics and Statistics, 89(4), 701–720. https://doi.org/10.1162/rest.89.4.701
- Andersen, T. G., Bollerslev, T., Diebold, F. X., & Labys, P. (2003, March). Modeling and forecasting realized volatility. Econometrica, 71(2), 579–625. https://doi.org/10.1111/ecta.2003.71.issue-2
- Barndorff-Nielsen, O. E. (2004, December). Power and bipower variation with stochastic volatility and jumps. Journal of Financial Econometrics, 2(1), 1–37. https://doi.org/10.1093/jjfinec/nbh001
- Baruník, J., & Křehlík, T. (2016, August). Combining high frequency data with non-linear models for forecasting energy market volatility. Expert Systems with Applications, 55, 222–242. https://doi.org/10.1016/j.eswa.2016.02.008
- Bollerslev, T., Patton, A. J., & Quaedvlieg, R. (2016, May). Exploiting the errors: A simple approach for improved volatility forecasting. Journal of Econometrics, 192(1), 1–18. https://doi.org/10.1016/j.jeconom.2015.10.007
- Bukhari, A. H., Raja, M. A. Z., Sulaiman, M., Islam, S., Shoaib, M., & Kumam, P. (2020). Fractional neuro-sequential ARFIMA-LSTM for financial market forecasting. IEEE Access, 8, 71326–71338. https://doi.org/10.1109/Access.6287639
- Buraschi, A., Trojani, F., & Vedolin, A. (2007). The joint behavior of credit spreads, stock options and equity returns when investors disagree. Workin paper, Imperial College, London.
- Chen, K., Zhou, Y., & Dai, F. (2015, October). A LSTM-based method for stock returns prediction: A case study of China stock market. In 2015 IEEE International Conference on Big Data (Big Data). IEEE
- Chuan, L., & Yanhui, C. (2022). Prediction of realized intraday volatility of stock indexes based on EMD-SE-LSTM model -- taking the China Securities 500 Index as an example. Technology and Industry, 22(8), 385–391.
- Corsi, F. (2008, November). A simple approximate long-memory model of realized volatility. Journal of Financial Econometrics, 7(2), 174–196. https://doi.org/10.1093/jjfinec/nbp001
- Dongyang, Q., & Ling, D. (2022). Price prediction of shanghai and shenzhen 300 stock index futures based on multidimensional high frequency data and LSTM model. Journal of Chongqing University of Technology (Social Sciences), 36(3), 55–69. http://clgsk.qks.cqut.edu.cn/CN/Y2022/V36/I3/55
- Feng, M., Yu, W., Dengshi, H., & Pengyun, Z. (2015). HAR-RV prediction model based on jump and sign jump variation and its MCS test. Journal of System Management, 24(5), 700–710. http://xtglxb.sjtu.edu.cn/CN/Y2015/V24/I5/700
- Fischer, T., & Krauss, C. (2018, October). Deep learning with long short-term memory networks for financial market predictions. European Journal of Operational Research, 270(2), 654–669. https://doi.org/10.1016/j.ejor.2017.11.054
- Guangying, L., Hongchao, W., & Xinbing, K. (2021). Deep learning LSTM modeland VaR risk management. Statistics and Decision making, 2021, 37 (08): 136–140. DOI: 10.13546/j.cnki.tjyjc.2021.08.030
- Hansen, P. R. (2005, October). A test for superior predictive ability. Journal of Business & Economic Statistics, 23(4), 365–380. https://doi.org/10.1198/073500105000000063
- Huizhen, L., Chenghu, Z., & Yulin, L. (2011). Prediction of the volatility of financial asset returns – based on the jumping behavior of China's stock market. Contemporary Economic Science (5), 109–118. http://www.ir.xjtu.edu.cn/item/232671
- Kim, H. Y., & Won, C. H. (2018, August). Forecasting the volatility of stock price index: A hybrid model integrating LSTM with multiple GARCH-type models. Expert Systems with Applications, 103(1), 25–37. https://doi.org/10.1016/j.eswa.2018.03.002
- Maknickienė, N., & Maknickas, A. (2012). Application of neural network for forecasting of exchange rates and forex trading. In The 7th International Scientific Conference Business and Management (pp. 10–11).
- Merton, R. C. (1976, January). Option pricing when underlying stock returns are discontinuous. Journal of Financial Economics, 3(1–2), 125–144. https://doi.org/10.1016/0304-405X(76)90022-2
- Miranda, F. G., & Burgess, N. (1997, June). Modelling market volatilities: The neural network perspective. The European Journal of Finance, 3(2), 137–157. https://doi.org/10.1080/135184797337499
- Müller, U. A., Dacorogna, M. M., Davé, R. D., Olsen, R. B., Pictet, O. V., & von Weizscker, J. E. (1997, June). Volatilities of different time resolutions: Analyzing the dynamics of market components. Journal of Empirical Finance, 4(2–3), 213–239. https://doi.org/10.1016/S0927-5398(97)00007-8
- Oliveira, N., Cortez, P., & Areal, N. (2017, May). The impact of microblogging data for stock market prediction: Using Twitter to predict returns, volatility, trading volume and survey sentiment indices. Expert Systems with Applications, 73, 125–144. https://doi.org/10.1016/j.eswa.2016.12.036
- Ormoneit, D., & Neuneier, R. (1996). Experiments in predicting the German stock index DAX with density estimating neural networks. In IEEE/IAFE 1996 Conference on Computational Intelligence for Financial Engineering (CIFER) (pp. 66–71). https://doi.org/10.1109/CIFER.1996.501825
- Patton, A. J. (2011, January). Volatility forecast comparison using imperfect volatility proxies. Journal of Econometrics, 160(1), 246–256. https://doi.org/10.1016/j.jeconom.2010.03.034
- Petrozziello, A., Troiano, L., Serra, A., Jordanov, I., Storti, G., Tagliaferri, R., & La Rocca, M. (2022). Deep learning for volatility forecasting in asset management. Soft Computing, 26(17), 8553–8574. https://doi.org/10.1007/s00500-022-07161-1
- Sun, S., Wei, Y., & Wang, S. (2018). AdaBoost-LSTM ensemble learning for financial time series forecasting. In Lecture notes in computer science (pp. 590–597). Springer International Publishing.
- Wang Chunfeng, F. Z., Yao, N., & Ye, L. (2008). Research on the jumping behavior of realized volatility in China's Stock Market. Systems Engineering, 26(2), 1–6.
- Weihua, C. (2018). A comparative study on the prediction effect of shanghai composite index volatility based on deep learning. Statistics and Information Forum, 33(5), 99–106. https://www.cnki.com.cn/Article/CJFDTotal-TJLT201805015.htm
- Wu Hengyu, X. Z., & Fuqiang, N. (2015). Prediction of realized volatility of chinese stock market with jump and structure transformation: Based on extended HAR-RV model. Mathematical Statistics and Management, 34(6), 1111–1128. https://www.cnki.com.cn/Article/CJFDTotal-SLTJ201506017.htm
- Wuyi, Y., & Baiqi, M. (2012). CVaR estimation under realized volatility and intraday price difference. Journal of Management Science, 15(8), 60–71.
- Yong, T. (2012). Empirical comparison of jump test methods for financial assets. China Management Science (S1), 290–299.