
 ?Mathematical formulae have been encoded as MathML and are displayed in this HTML version using MathJax in order to improve their display. Uncheck the box to turn MathJax off. This feature requires Javascript. Click on a formula to zoom.
Abstract
Although machine learning classifiers have been successfully used in the medical and engineering fields, there is still room for improving the predictive accuracy of model classification. The higher the accuracy of the classifier, the better suggestions can be provided for the decision makers. Therefore, in this study, we propose an ensemble machine learning approach, called Feature generation-based Ensemble Support Vector Machine (FESVM), for classification tasks. We first apply the feature selection technique to select the most related features. Next, we introduce an ensemble strategy to aggregate multiple base estimators for the final prediction using the meta-classifier SVM. During this stage, we use the classification probabilities obtained from the base classifier to generate new features. After that, the generated features are added to the original data set to form a new data set. Finally, this new data set is utilised to train the meta-classifier SVM to obtain the final classification results. For example, for a binary classification task, each base classifier has two probabilities (p for one class and 1−p for the other class). In this case, two new features are generated from the combination of probabilities based on these base classifiers. One is the sum of p as new feature 1, and the other is the sum of 1−p as new feature 2. These two new features are then added to the original data set to form the new data set. In the same way, our feature generation method can be easily extended for a multi-class task for generating new features, where the number of features depends on the number of classes. Those generated features from the base estimators (first layer) are added to the original data set to form a new data set. This new data set is used as the input to the second layer (meta-classifier) to obtain the final model. Experiments based on the 20 data sets show that our proposed model FESVM has the best performance compared to the other machine learning classifiers under comparison. In addition, our FESVM has better performance than the original stacking method in the multi-class classification tasks. Statistical results based on the Wilcoxon–Holm method also confirms that our FESVM can significantly outperform the other models. These indicate that our FESVM can be a useful tool for classification tasks, especially multi-classification tasks.
1. Introduction
With the rapid development of information technology, a large amount of raw data has been accumulated from various industries of national economy and social life. How to efficiently and accurately extract the useful information from these data with different format has become the key to promote the in-depth development of industry business and achieve intelligent enhancement. In addition, with the growth of computing power and optimissation of algorithms, artificial intelligence technologies represented by machine learning, deep learning, etc., have been developed tremendously in data processing and analysis. They have also been widely used in many fields of social and economic life. The classification tasks are commonly existing in our daily life and machine learning models are widely used to implement inductive classification tasks for the real-world problems. The target of a classification task is to determine a sample belongs to which class. For examples, Gadde et al. (Citation2021) used email titles and contents to distinguish whether an email is spam or not. Their results showed that the model they proposed outperforms previous models in spam detection with an accuracy of 98.5. Gaikwad et al. (Citation2021) utilised magnetic resonance imaging scan results to quickly and accurately distinguish whether a tumour is malignant or benign. Machine learning classification is also widely used in other many real-world applications (Chen & Qian, Citation2021; Gao et al., Citation2022; Li et al., Citation2019). The more accurate the classification is, the more valuable the results can be obtained, which is important to improve the classification performance.
Based on the structural risk minimisation principle and statistical learning theory, the Support Vector Machine (SVM) (Vapnik, Citation1995) has shown high generalisation performance. It is able to effectively solve traditional challenges in machine learning, such as dimensional catastrophe and overfitting. It has outstanding advantages in solving small-scale, nonlinear and high-dimensional pattern recognition problems. It has been successfully applied to solve probability density estimation (Vapnik, Citation2000), automatic text classification (Ukey & Alvi, Citation2012), handwritten digit recognition (Katiyar & Mehfuz, Citation2015), face detection (Jee et al., Citation2004), etc. Therefore, further research to improve the generalisation ability and practical applicability of SVM is of great importance.
In addition, the ensemble learning (Zhou, Citation2021) provides a good solution to improve the generalisation ability of classification systems. Its basic idea is to combine multiple classifiers to learn the same problem, and then combine the learning results of each classifier according to a certain strategy. Ensemble learning improves the generalisation ability and reliability by exploiting the diversity of classifiers. With the diversity of the base model (classifier), the ensemble model (classifier) is less prone to overfitting (Fan et al., Citation2023). In this study, we propose an ensemble model by combining the ensemble learning and SVM. Specifically, multiple classification models with high variability are selected in the first layer and the SVM is used as the last layer to decide the final result. By doing so, a good ensemble learning model can be achieved and the generalisation ability can be further improved. Therefore, our proposed ensemble model not only has the theoretical significance, but also has practical applications in many fields (Liu et al., Citation2021; Oloso et al., Citation2018; Sun & Fu, Citation2022).
2. Related work
The ensemble learning approach was proposed by Hansen and Salamon (Citation1990) in 1990. It provides a good solution to improve the generalisation ability of classification systems. As one of the important research directions in the field of machine learning (Dietterich, Citation1997), its basic idea is to combine multiple classifiers to learn from the same issue, and synthesise the learning results of each classifier based on certain strategies. The main combination strategies are averaging method, voting method, and learning method. For the learning method, the most representative method is stacking (Breiman, Citation1996; Wolpert, Citation1992). Instead of using simple logical processing (e.g. voting) on the results of the weak classifiers, we apply the combination strategy of stacking (K. Wang et al., Citation2020). That is, the learning results of several weak classifiers are used as the input to another learner to retrain this classifier and get the final result. In this case, the weak classifier is called the base classifier (estimator), and the classifier used for combination is called the meta-classifier. Specifically, for a data set, each base classifier is used to obtain its classification results, and the classification results are combined in some way to form an input of next layer, which are fed into the meta-classifier. Finally, the meta-classifier is utilised to predict the final result. In this case, ensemble learning improves the generalisation ability and reliability by using the difference of classifiers and is less prone to overfitting.
Faiz (Citation2021) proposed an ensemble SVM-based model for Android malware detection. Their results proved that this ensemble model could effectively detect malware and slightly outperformed the individual SVM model. Das et al. (Citation2021) used an ensembled SVM for in EEG-based person identification. Their experimental results demonstrated that the model not only improved the identification accuracy, but also ensured its robustness and reliability. Mounica et al. (Citation2019) used the ensemble SVM for learning disability detection in school-age children. Their study showed that the proposed multilayer ensemble model had better accuracy in detecting the presence of learning disability problems in children compared to individual algorithms. Naqi et al. (Citation2018) used the ensemble SVM model for the detection of pulmonary nodules where experiments showed that the ensemble SVM method not only improved the sensitivity but also reduced other workloads. The ensemble algorithms have also been applied in other fields with good results (Chatzimparmpas et al., Citation2021; Nekouei & Sartoli, Citation2019; Zhang & Li, Citation2021).
Besides the ensemble strategies, the feature selection techniques are also important for improving a model's prediction performance. For example, Sohail et al. (Citation2022) selected most related features for intrusion detection in smart homes to improve the model's efficiency and accuracy. To identify the digital capabilities in university courses, Fan and Chiong (Citation2022) extracted the features from the text and applied the term frequency-inverse document (TF-IDF) technique for feature processing. They found that it is essential to include appropriate number of features in the prediction models. Chiong et al. (Citation2022) utilised the sentiment analysis technique to extract the most important features for stock market prediction. Their results showed that even with a few important features for traditional machine learning model training, their results could outperform the deep learning models with thousands of features used from the TF-IDF. In addition, feature generation is another way to improve a model's performance. J. Wang et al. (Citation2022) proposed a high-quality proposal feature generation pedestrian detection algorithm to improve detection performance. Experiments demonstrate that their method could achieve 5.9 AP and 1.5
MR-2 improvement compared to the baseline in crowded pedestrian detection. Guo (Citation2021) proposed a method of scene classification prototype calibration for remote sensing images with few shots based on feature generation model. The proposed model is able to improve the representativeness of each category's features. Their results show that the proposed method can deliver excellent classification accuracy for scene classification.
Although the proper ensemble strategy, feature selection technique, or feature generation approach has been used to improve the model's classification performance, to the best of our knowledge, there is no research that combines these three techniques in a model. Thus, in this paper, we propose a novel approach for classification tasks by design appropriate ensemble strategy, feature selection and feature generation techniques.
3. An ensemble machine learning approach for classification tasks
Based on the above research work, we propose an ensemble machine learning approach for classification tasks using feature generation in order to further improve the prediction accuracy. In this method, there are three modules. The first module is the classifier integration module, in which an integrated model is built on the basis of the stacking ensemble model. The second module is for model selection, including the selection of base classifier and meta-classifier. The third module is the data feature processing module, which performs feature selection and new feature generation.
3.1. Stacking ensemble model
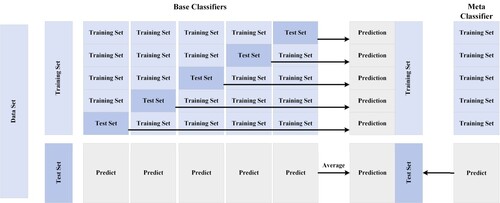
The original idea of stacking is to train multiple base classifiers using an initial training set, and each of these base classifiers generates a new training set to train the meta-classifier (Woods et al., Citation1997). Figure shows the schematic diagram of the stacking algorithm. The first layer of the stacking algorithm has different types of base classifiers, and the correlation between different base classifier algorithms is low. The meta-classifier is generally a multiple linear regression (MLR) algorithm. The training samples are generally used by cross-validation methods. As shown in Figure , the data set is first divided into a training set and a test set with 70% samples used for training and the remaining samples for testing. The training set is used for hyper-parameter tuning based on the 5-fold cross-validation. Specifically, for the 5-fold cross validation, 1/5 of the samples are selected as the test set and the remaining samples are used as the training set. The training set is cross-validated where the base classifier is trained and predicted. The prediction result of each base classifier is used as a feature of the meta-classifier training data, and the label of the new sample remains the same as the original one. After training all the base classifiers, a new data set is generated for the training of our meta-classifier. Similarly, the test set serves directly as input to each trained base classifier to get the prediction, and the average of the prediction results is used as a feature of the new sample, which is then predicted using the meta-classifier. Note that the reasons for using 5-fold cross validation are that (1) the model performance is closely related to the training samples used. If we use the randomly split samples for training, we cannot achieve the best hyper-parameters for model testing; (2) as we run the experiments for 5 times, we can avoid some randomness and compare the results with other models with fairness. As can we can see from Figure , the original data set is completely discarded in this process. The final result of the classification depends only on the classification of the base classifiers. In this study, we draw on the idea of original stacking ensemble learning. We make use of the information generated by the base classifier while retaining some of the information from the original data set.
Figure 1. Framework of our stacking model.
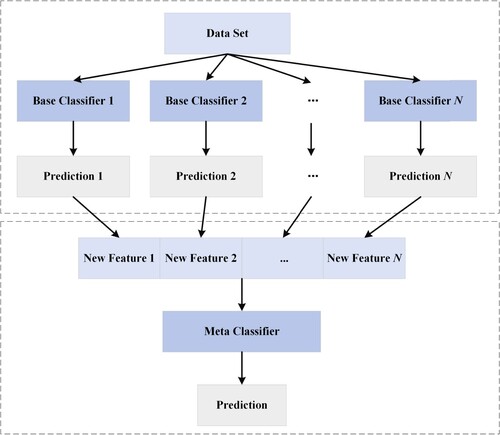
Figure 2. The first layer of a single model using 5-fold cross-validation.
3.2. Selection of base classifier and meta-classifier
The stacking integration method is a method that combines theoretical knowledge of statistics with machine learning algorithms to obtain better prediction performance by combining different algorithms together and exploiting the advantages of each algorithm. For the building of the stacking integration model, the first step is to determine the base classifiers. In this stage, the selection of base classifiers needs to be considered in terms of accuracy and diversity. In this paper, models with excellent prediction performance are selected. In order to obtain the best ensemble model, the correlation between the base classifiers also needs to be considered. Different algorithms are used as base classifiers. By doing so, our proposed model is able to explore the intrinsic connections existing between data from different spatial and structural perspectives, and then combine their respective algorithmic principles to build different prediction models. Therefore, choosing algorithms with less correlation can take the advantages of different machine algorithms and achieve the purpose of complementarity.
3.2.1. Random forests (RF)
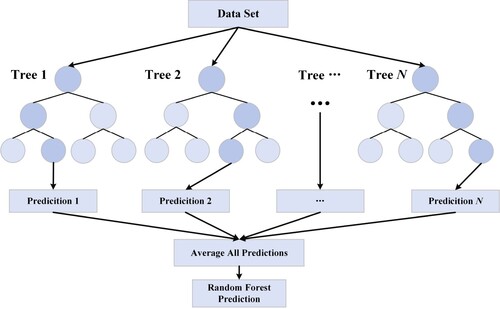
The RF (Breiman, Citation2001) is a technique for modelling prediction and behaviour analysis. It is an ensemble method based on bagging, which is built on decision trees. An RF is composed of multiple decision trees, and there is no correlation between different decision trees. When we perform the classification task, each decision tree evaluates the input and classifies them separately. As shown in Figure , each decision tree gets a classification result of its own, and the RF takes the classification result which has the highest number of results among all decision trees as the final result. Each tree in the classification takes input from the samples in the initial data set. Then features are randomly selected for growing the tree at each node. Each tree in the forest should not be pruned until the prediction is reached decisively at the end of the exercise. In this way, the RF enables any classifier with weak associations to create a stronger classifier. It is relatively fast to train, easy to make into a parallel method, simple to implement, and easy to balance the error for unbalanced data sets. However, its classification performance is not good for small sample data and low-dimensional data (with a small amount of features) because of the overfitting problem.
Figure 3. The framework of RF.
3.2.2. Logistic regression (LR)
The LR (Cramer, Citation2003) belongs to the generalised linear model, therefore it has a lot in common with multiple linear regression analysis. They have essentially the same form with , where w and b are the parameters to be sought. The difference lies in their different dependent variables, where multiple linear regression takes
as the dependent variable directly
, while LR takes
as the dependent variable through the function
, which corresponds to a hidden state p,
. Then the value of the dependent variable is determined according to the magnitude of p versus 1−p. Generally, S is a Sigmod function, which maps a real number to the interval
, LR can be dichotomous or multi-categorical in its dependent variable. The essence of LR is based on the assumption that the data obey this distribution, and then using great likelihood estimation to do the estimation of the parameters. The idea of LR is to fit a decision boundary (not limited to linear, but also polynomial). Next, it establishes a probability link between this boundary and the classification for obtaining the probability in the dichotomous case. LR has a simple form and is faster to train, but the accuracy is not insufficient.
3.2.3. Gaussian Naive Bayes (GNB)
The Bayesian classification (Cheeseman & Stutz, Citation1996) algorithm is a statistical classification method, which is a class of algorithms that use knowledge of probability statistics for classification. In many occasions, the Naive Bayes (NB) classification algorithm is comparable to decision trees and neural network classification algorithms. It can be applied to large databases with the high classification accuracy and high speed. Gaussian Naive Bayes (GNB) is a classification technique for machine learning based on probabilistic methods and Gaussian distributions. The GNB assumes that the input eigenvalues are continuous and follow a Gaussian distribution, and that each parameter (also called a feature or predictor variable) has the independent ability to predict the output variable. The predictive combination of all parameters is the final prediction, which returns the probability of the dependent variable being classified into each group. The final classification with highest probability is assigned to the group (class).
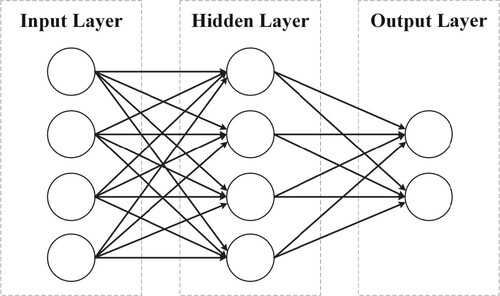
3.2.4. Multilayer perceptron (MLP)
The MLP (Kothari & Oh, Citation1993) is a generalisation of the Perceptron Learning Algorithm (PLA), which is described by the structure of neurons as a single. The neural network of the perceptron is represented as follows: as shown in Figure , the PLA is a linear binary classifier, but it cannot classify the nonlinear data effectively. Therefore, there is a deepening of the network hierarchy. Theoretically, a multilayer network can model any complex function. The MLP does not specify the number of hidden layers, so the number of layers can be chosen according to the respective needs. The structural model of MLP neural network is shown below. There is only one hidden layer involved in Figure , with only three variables and one bias in the input, and three neurons in the output layer. The neuron model is ensemble compared to the neuron model in the perceptron algorithm.
Figure 4. Neuronal structure diagram of the perceptual machine.
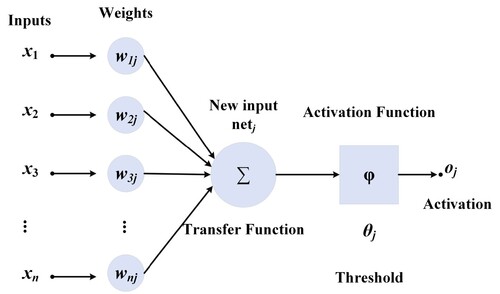
Figure 5. Structure of a multilayer neural network with only one hidden layer.
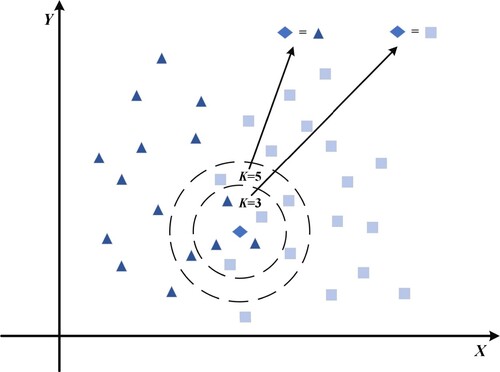
3.2.5. K-nearest neighbour (KNN)
The KNN method originally proposed by Cover and Hart (Citation1967) in 1967, is a theoretically mature method and one of the simplest machine learning algorithms. The idea of KNN is very simple and intuitive: given a sample, if the K most similar (i.e. the nearest neighbour) samples in the feature space belonging to a certain class, then this sample also belongs to that class. As shown in Figure , the selection of different of K directly affect the classification result of that sample. This method decides the class to which the sample to be classified belongs based on the class of the nearest sample or samples only in the class determination decision. The KNN method is simple, easy to understand, easy to implement, and does not require estimation of parameters.
Figure 6. When K takes values of 3 and 5, the samples belong to different classifications.
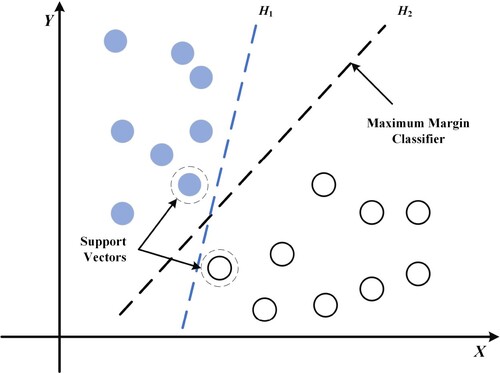
3.2.6. SVM
The SVM is a kernel-based method with high computational power for classification and regression tasks. Compared to other machine learning methods, the SVM has better generalisation capabilities (Fan & Gou, Citation2023). It has a solid theoretical foundation and its learning strategy is interval maximisation, which can be formalised as a problem of solving convex quadratic programming. In this case, it is also equivalent to the problem of minimising a regularised hinge loss function. The learning algorithm of SVM is an optimisation algorithm for solving convex quadratic programming. The basic idea of SVM learning is to solve for the separation that correctly partitions the training data set and maximises the geometric interval hyperplane. The separation hyperplane is shown in Figure . There are an infinite number of such hyperplanes for linearly divisible data sets (i.e. perceptron), but the geometrically spaced separation hyperplane is the only one. SVM can also classify nonlinear data by moving the data to a higher dimensional space through a method called the kernel trick. Often, data that cannot be linearly separated in the original input space can be separated in a high-dimensional feature space. The SVM can obtain accurate classification results with a small amount of samples and provides more accurate results than other algorithms in many applications.
Figure 7. Schematic diagram for finding the maximum interval hyperplane.
3.3. Feature processing
In this section, we conduct the data feature processing in order to improve the prediction performance of our proposed model. There are two main steps: the first step is to eliminate unimportant features through feature selection. The second step is to use base classifier to generate new data features. On the one hand, the data dimension is reduced to improve the computing speed; on the other hand, after the data dimension is reduced, the feature importance of the new features created in Step 2 can be improved in the data set.
3.3.1. Feature selection
Feature selection is an important technique in feature engineering, whose goal is to find the optimal subset of features. Its purpose is to eliminate irrelevant or redundant features, thereby reducing the number of features, improving model accuracy, and reducing runtime. On the other hand, the selection of truly relevant features simplifies the model and assists in understanding the process of data generation. Feature selection, as an important data preprocessing process, has two main advantageous functions: (1) it can reduce the number of features and reduce the dimensionality, which makes the model more generalisable and reduces overfitting; (2) it can enhance the understanding between features and feature values.
In this study, a feature selection method using model-based feature ranking is applied, the idea of this method is to use a machine learning algorithm directly to build a prediction model for each individual feature and response variable. Tree-based methods are easier to use because they model nonlinear relationships better and do not require much debugging. The overfitting problem can be avoided by using cross-validation methods while ensuring that the depth of the tree is not too large.
The XGBoost (Friedman, Citation2001) is an ensemble algorithm based on boosting, and its main idea is to combine hundreds of tree models into one model with high accuracy, and this model generates new trees by iteration. The importance of a feature is the sum of the number of times it appears in all trees. This means that the more an attribute is used in the model to build a decision tree, the more important it is. There are several types of importance in the XGBoost, it can be computed in several different ways. There are three major ways to calculate the importance of a feature: weight, gain and cover. The weight shows the number of times the feature is used to split data. The gain type shows the average gain across all splits where feature was used. The cover shows the sum of the second-order derivatives of the samples segmented to that node. There are also total_gain, total_cover types of importance. The XGBoost model used in this study is constructed using scikit-learn. Under this model, the XGBoost built-in feature importance uses gain as the evaluation method of importance by default. In the situation where gain is used, the feature importance score is obtained. By setting a threshold, the data set is transformed into multiple subsets with the selected features. By separately putting the subsets into the XGBoost for training and prediction, we can make all the features in the subset with the highest accuracy of XGBoost to be the important features we need to select.
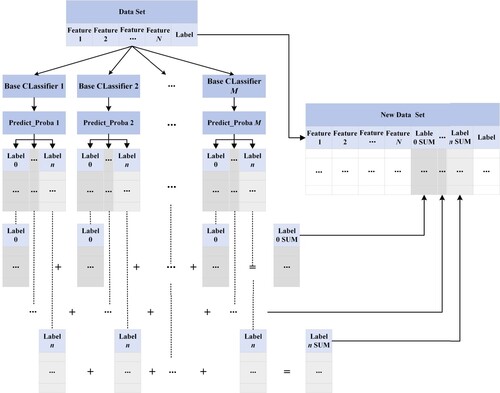
3.3.2. Feature generation
Feature generation is the process of constructing new features from the original data, also known as variable selection, attribute selection, or variable subset selection in machine learning or statistics. It is the process of selecting relevant features and forming a subset of features in model construction. Generating new features based on existing features increases the non-literary of the features. Common data transformations are polynomial-based, exponential function-based, and logarithmic function-based. The new features introduced in feature engineering need to be verified that it can indeed improve the prediction accuracy, rather than adding a useless feature to increase the complexity of algorithm operations.
The feature generation method in this study is different from the original stacking framework. In the original stacking framework, only the prediction results of the base classifier (usually label information) are ensemble into the new data set as the input of the meta-classifier, as shown in Figures and . In this study, in order to improve the positive impact brought by the base classifiers, the classification probabilities predicted by all base classifiers. Taking binary classification tasks as an example, the probability of classification as 0 and the probability of classification as 1, are superimposed to obtain the sum of 0 and 1 probabilities of classification of data by all base classifiers. These two pieces of information are added to the data set as constructed new features before putting them into the model for learning and prediction. The same with multi-class classification tasks as shown in Figure .
Figure 8. Schematic diagram of the feature generation process.
3.4. Detailed process of our proposed approach for classification tasks
Considering the medical and engineering data collected from the internet may not always clean or some features might not be relevant to the problems, we propose a novel ensemble model based on the techniques of ensemble learning, feature selection, and feature generation. The feature selection technique is first used to select the most important features to improve the prediction accuracy. Next, the feature generation approach is applied to improve the representativeness of each category's features. Finally, the stacking strategy is utilised to achieve the final prediction results. As our proposed FESVM records every possible probability, which remains the probability of positive correct classification, this makes the model somewhat stable.
The complete process of our proposed ensemble model, the FESVM, is shown in Figure . As can be observed from the figure, we perform three main modules for a classification data set. The first module is data preprocessing. In this module, we take the input for data normalisation and select important features using the XGBoost, and finally, we get the
which only contains important features. The second module is the generation of new features. In this module, we use multiple heterogeneous machine learning models to generate prediction probabilities for the corresponding classifications, and add the obtained sum of probabilities to
to obtain
. In the third module, we perform the final training and prediction. The latest
is injected into the SVM to obtain the final prediction results. The default parameters of each algorithm in scikit-learn are used throughout the model. Our proposed ensemble machine learning approach combines these three modules for classification tasks using feature generation.
Figure 9. Schematic diagram of the experimental model frame structure.
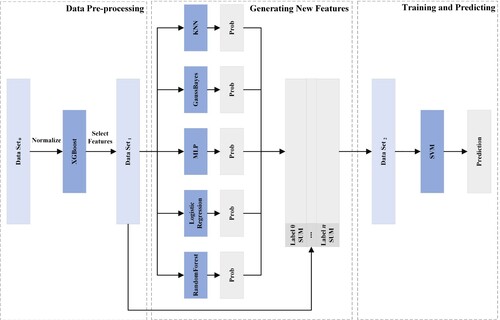
For the classification tasks, the idea of ensemble learning is to correct the incorrect prediction of a weak classifier using the correct prediction of other weak classifiers. It is clear that the heterogeneity of classifiers (i.e. individual variability) facilitates the classification performance. As shown in Figure , the RF, LR, MLP, GNB, and KNN are chosen as the base classifiers while the SVM is selected as the meta-classifier in this study. After the data normalisation, the K-fold cross-validation is applied with feature selection and feature generation used, followed by the meta-classifier training to get the final model.
4. Experimental results and analyses
4.1. Data description and organisation
The 20 data sets used for our experiments were downloaded from the UCI and Kaggle for binary classification and multi-classification problems, covering several domains and different number of features and samples, as shown in Table for detailed information. The smallest data set has 116 samples while the biggest data set has 65,532 samples. The number of features ranges from 3 to 60.
Table 1. Data set information where #Instances is the number of instances and #Features is the number of features.
Table shows the relationship between the original features, the important features, and the newly generated features in the data set. The most important features are selected to ensure the highest accuracy of the model. The ‘Important features’ in the table is the number of important features left. ‘New Features’ is the number of new features obtained from the base classifier, which is as many as the number of categories in the data set. ‘Proportion of Reservation’ shows the proportion of important features retained in the number of original features. ‘Proportion of New Features’ shows the proportion of new features among all features (i.e. Important features and New features).
Table 2. Data set information after preprocessing.
Our proposed FESVM is proposed to deal with the classification tasks. In the experiments, the evaluation metrics considered were accuracy, precision, recall and F1-score. We pay more attention to the performance results of accuracy. Based on the above-mentioned metrics, we compare the single machine learning model used in this study, the original stacking model, and the FESVM model. In order to make an effective comparison, we do not optimise the parameters for each method and use the default parameters with 10-fold cross validation.
4.2. Experimental results and analyses
Tables – show the experimental results from the RF, LR, GNB, MLP, KNN, SVM, Stacking, and FESVM based on the 20 data sets. From these tables, it is clear to see that our proposed FESVM algorithm has excellent results. To be specific, our proposed FESVM has the best performance among 16 of the 20 data sets in terms of accuracy; our proposed FESVM has the best performance among 15 of the 20 data sets in terms of precision; and our proposed FESVM has the best performance among 16 of the 20 data sets in terms of F1-score. This is mainly due to the use of the ensemble strategy used in our model. In addition, when compared with the original stacking algorithm, FESVM performs better than Staking, especially on the multi-classification data set. This could be the use of feature selection and generation that could refine the feature information to further improve our FESVM.
Table 3. Experimental results from the RF, LR, GNB, MLP, KNN, SVM, Stacking, and FESVM using the first eight data sets in Table .
Table 4. Experimental results from the RF, LR, GNB, MLP, KNN, SVM, Stacking, and FESVM using the ninth to sixteenth data sets in Table .
Table 5. Experimental results from the RF, LR, GNB, MLP, KNN, SVM, Stacking, and FESVM using the last four data sets in Table .
In specific analysis, the original stacking is severely affected by the base classifiers because it discards the features in the original data and only relies on the classification results provided by the classifiers. Similarly, the original stacking is also affected accordingly when the base classifiers have poor performance, such as ConBSMR in Table , BMI in Table , and the UltrasonicFD in Table . However, our proposed FESVM not only retains the feature information in the original data, but also integrates the feature information provided by the base classifiers, maximising the value of both information. Therefore, FESVM does not suffer from the poor classification results from some base classifiers on these data sets with poor performance, but obtains better results. Although for the DiabetesBC and SPECTFHeart in Table and Statlog (Heart) and InternetFD in Table , Stacking performs better than the FESVM, their results are still competitive. This is most likely due to the fact that too many important features are screened out during the feature screening process, causing the FESVM algorithm lose some information while the feature generation technique, to some extent, could alleviate its influence. As our target is to improve the accuracy, our proposed FESVM is able to guarantee its accuracy to be higher than or equal to other base classifiers in most cases. It has the same result as SVM on data sets 1 and 17, and the same result as the RF on data set 13, but performs well on the remaining data sets. This could be the reasons that (1) the SVM is based on the structural risk minimisation principle and statistical learning theory, making it suitable for small data sets. While our proposed FESVM is based on the SVM, which is also applicable in such scenarios; (2) the RF is able to improve the prediction accuracy and stability by integrating multiple base estimators into one model while our proposed FESVM uses the ensemble strategy, which leads to its high performance. These results show that our FESVM can perform well in most cases, indicating it is more universal than the other models under comparison.
In addition, as can be seen from the tables, our FESVM performs better on the multi-classification tasks compared to the binary classification tasks. It also shows superior performance over stacking on these two multi-classification data sets. Each individual algorithm performs more consistently on these two cases, but stacking appears to have better performance for binary classification tasks. The reason is that there are multiple categories, and for each model there are N possible categories (N is the number of categories), then there are N−1 incorrect classifications, then there is a higher probability of stacking errors and more deviations from the correct category. The occurrence of these errors will then make the stacking results deviate from their targets. Our proposed FESVM, on the other hand, records every possible probability, which remains the probability of positive correct classification, making the algorithm somewhat stable.
Furthermore, as we can see from the experimental results of each data set, the results of some data sets show the improvement effect of FESVM is less than 1%, which is a significant improvement. While for some data sets, our FESVM enhancement results are obvious. The reason why we use the average results of 20 data sets to prove the effectiveness of FESVM is that our purpose is to propose a model that can meet the needs of wide applicability while improving the accuracy. Therefore, we aim to prove that our proposed FESVM performs well on most data sets without causing too much extra time. As can be seen from the average of these 20 data sets, the RF model may perform best in a single data set, it performs moderately in other data sets. Among the averaged results, our FESVM has the best performance in terms of all metrics used, which indicates that our FESVM may not be the best on a single data set, but it performs the best on the average of 20 data sets. This confirms that our FESVM is competitive in applicability.
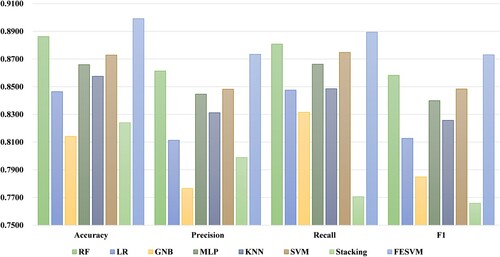
To further verify the performance of our proposed FESVM, the comparison of the average performance results of each model based on the 20 data sets is shown in Figure . As we can from the figure, our proposed FESVM algorithm outperforms the other models being compared in terms of all metrics used. In particular, the Accuracy, Precision and F1-score values are much higher than the other algorithms. The average performance of FESVM is not only higher than that of the single-use SVM, but also higher than that of the original stacking, which shows that our FESVM is more flexible and robust.
Figure 10. Comparison of the average performance results of each model based on the 20 data sets.
Although our proposed model has shown better performance than the other models being compared, whether their difference is significant or not is still unknown. Thus, we used the critical difference diagram with Wilcoxon-Holm method (Ismail Fawaz et al., Citation2019) to show the performance effect of these algorithms in terms of Accuracy and F1-score while the statistical results (p-values) based on the Wilcoxon-Holm method to detect pairwise significance are shown in Tables and . Note that in Figures and , the value closer to 1 indicates that the algorithm has better performance. The algorithms connected by the thick lines are those with closer performance. As can be seen from the figures, our proposed FESVM has the best performance in terms of Accuracy and F1-Score. The second and third best models are RF and SVM, respectively, which can also be seen in Tables –.
Figure 11. Critical difference diagram of Accuracy based on the 20 data sets.
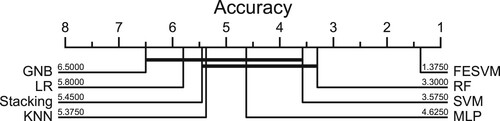
Figure 12. Critical difference diagram of F1-Score based on the 20 data sets.
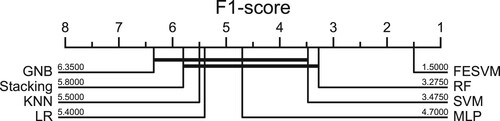
Table 6. Statistical test results for the RF, LR, GNB, MLP, KNN, SVM, Stacking, and FESVM in terms of accuracy (p-values less than 0.05 are highlighted in bold).
Table 7. Statistical test results for the RF, LR, GNB, MLP, KNN, SVM, Stacking, and FESVM in terms of F1-Score (p-values less than 0.05 are highlighted in bold).
Based on the above experimental results, it can be seen that the performance results of individual classifiers on different data sets are poor in terms of performance and generalisation ability depending on the data sets. Ensemble learning can combine the processing results of the main classifiers to obtain better results. Experiments show that FESVM not only performs better than single base classifier on binary classification, but also performs better on multi-classification. In addition, FESVM is far better than stacking, especially in the case of insufficient data sets.
Table shows the computation time (in seconds) based on different input features used for the 20 data sets using our proposed FESVM where t1 is the computation time using all features, t2 is the computation time using generated features, t3 is the computation time using feature selection, and t4 is the computation time using the features from the feature generation and feature selection. Note that for t2, t3, and t4, the computation time of feature processing is included. As shown in the table, the computation time of t2 is smaller than t1. This is expected as less feature used for training, its computation time will be less if the time for feature processing is not much. In addition, the number features used in t3 is less than t2, the computation time for t3 should be less. But it is only true for the BanknoteA data set. This is because the time for feature generation takes more time than the feature selection. Although most of computation time of our proposed FESVM is more than the original features. The efficiency could be improved by running feature selection and feature generation at the same time. By doing so, the computation mainly depends of the maximum computation time of t2 and t3, which is comparable with the computation time based on the original data set.
Table 8. Comparison of computation time based on different input features used for the 20 data sets using our proposed FESVM where t1 is the computation time using all features, t2 is the computation time using generated features, t3 is the computation time using feature selection, and t4 is the computation time using the features from the feature generation and feature selection.
5. Conclusion
In this study, we proposed the FESVM by combining the sum of classification probability in the frame of stacking, which is able to improve the accuracy of the model classification by using the feature generation technique before training the meta-classifier SVM. It is demonstrated experimentally that our proposed FESVM outperformed the other models being compared, including the RF, LR, MLP, GNB, KNN, and SVM, based on the 20 data sets. The FESVM is effective on both binary classification and multi-class classification scenarios. Furthermore, statistical results based on the Wilcoxon–Holm method showed the FESVM could significantly outperform the other models being compared in terms of Accuracy and F1-score. These indicate that our proposed FESVM is effective for both binary and multi-class classification tasks.
With the excellent performance obtained by our proposed FESVM, it could be a useful tool for classification tasks in real-world applications by providing suggestions/information for decision makers to take proper actions. For example, in medical applications, the proposed model could predict if a patient has certain diseases based on the diagnosis data. This is helpful for the doctor or decision maker to know more about the potential outcomes.
Although the results have shown the high performance of our proposed model, it has some limitations in practical applications. These include (1) the ensemble strategy used in the second layer has a great impact on the prediction performance; (2) proper feature processing techniques are also important for classification accuracy and model training efficiency. In future work, we will investigate different combination strategies to generalise the FESVM in other classification tasks. We will explore our strategies for feature processing without expanding the data dimension. For example, the probabilities could be embedded in the original information in some way without generating new features. At the same time, the new model could achieve promising performance with high efficiency.
Disclosure statement
No potential conflict of interest was reported by the author(s).
References
- Abdelhamid, N., Ayesh, A., & Thabtah, F. A. (2014). Phishing detection based associative classification data mining. Expert Systems with Applications, 41(13), 5948–5959. https://doi.org/10.1016/j.eswa.2014.03.019
- Bohanec, M. (1997). Car Evaluation Data Set. https://archive.ics.uci.edu/ml/datasets/Car+Evaluation
- Breiman, L. (1996). Stacked regressions. Machine Learning, 24, 49–64. https://doi.org/10.1007/BF00117832
- Breiman, L. (2001). Random forests. Machine Learning, 45(1), 5–32. https://doi.org/10.1023/A:1010933404324
- Chatzimparmpas, A., Martins, R. M., Kucher, K., & Kerren, A. (2021). Empirical study: Visual analytics for comparing stacking to blending ensemble learning. In 2021 23rd International Conference on Control Systems and Computer Science (CSCS) (pp. 1–8). https://doi.org/10.1109/CSCS52396.2021.00008
- Cheeseman, P., & Stutz, J. (1996). Bayesian classification (AutoClass): Theory and results. Advances in Knowledge Discovery & Data Mining, 180, 153–180. https://doi.org/10.5555/257938.257954
- Chen, J., & Qian, Y. (2021). Hierarchical multi-label ship recognition in remote sensing images using label relation graphs. In 2021 IEEE International Geoscience and Remote Sensing Symposium (IGARSS) (pp. 4968–4971). https://doi.org/10.1109/IGARSS47720.2021.9554687
- Chiong, R., Fan, Z., Hu, Z., & Dhakal, S. (2022). A novel ensemble learning approach for stock market prediction based on sentiment analysis and the sliding window method. IEEE Transactions on Computational Social Systems, 1–11. https://doi.org/10.1109/TCSS.2022.3182375
- Cover, T., & Hart, P. (1967). Nearest neighbor pattern classification. IEEE Transactions on Information Theory, 13(1), 21–27. https://doi.org/10.1109/TIT.1967.1053964
- Cramer, J. S. (2003). The origins of logistic regression (TI 2002-119/4). Social Science Electronic Publishing.
- Das, B. B., Ram, S. K., Pati, B., Panigrahi, C. R., Babu, K. S., & Mohapatra, R. K. (2021). SVM and ensemble-SVM in EEG-based person identification. In C. R. Panigrahi, B. Pati, P. Mohapatra, R. Buyyaand, & K. C. Li (Eds.), Progress in advanced computing and intelligent engineering (pp. 137–146). Springer Singapore.
- de Alencar Barreto, G., & da Rocha Neto, A. R. (2011). Vertebral Column Data Set. https://archive.ics.uci.edu/ml/datasets/Vertebral+Column
- Dietterich, T. G. (1997). Machine learning research: Four current directions. AI Magazine, 18(4), 97–136. https://doi.org/10.1609/aimag.v18i4.1324
- Dua, D., & Graff, C. (2017). Statlog (Heart) Data Set. https://archive.ics.uci.edu/ml/datasets/Statlog+Heart
- Er, M. B., & Aydilek, I. B. (2019). Music emotion recognition by using chroma spectrogram and deep visual features. International Journal of Computational Intelligence Systems, 12(2), 1622–1634. https://doi.org/10.2991/ijcis.d.191216.001
- Ertam, F. (2019). Internet Firewall Data Set. https://archive.ics.uci.edu/ml/datasets/Internet+Firewall+Data
- Faiz, M. F. I. (2021). SVM-based ensemble classifiers to detect android malware. In L. Barolli, I. Woungangand, & T. Enokido (Eds.), Advanced information networking and applications (pp. 346–354). Springer International Publishing.
- Fan, Z., & Chiong, R. (2022). Identifying digital capabilities in university courses: An automated machine learning approach. Education and Information Technologies, 28(3), 1–16.https://doi.org/10.1007/s10639-022-11075-8
- Fan, Z., & Gou, J. (2023). Predicting body fat using a novel fuzzy-weighted approach optimized by the whale optimisation algorithm. Expert Systems with Applications, 217, 119558. https://doi.org/10.1016/j.eswa.2023.119558
- Fan, Z., Wu, F., & Tang, Y. (2023). A hierarchy-based machine learning model for happiness prediction. Applied Intelligence, 53(6), 7108–7117. https://doi.org/10.1007/s10489-022-03811-x
- Fisher, R. (1988). Iris data set. https://archive.ics.uci.edu/ml/datasets/Iris
- Friedman, J. H. (2001). Greedy function approximation: A gradient boosting machine. Annals of Statistics, 29(5), 1189–1232. https://doi.org/10.1214/aos/1013203451
- Gadde, S., Lakshmanarao, A., & Satyanarayana, S. (2021). SMS spam detection using machine learning and deep learning techniques. In 2021 7th International Conference on Advanced Computing and Communication Systems (ICACCS) (Vol. 1, pp. 358–362). https://doi.org/10.1109/ICACCS51430.2021.9441783
- Gaikwad, S., Patel, S., & Shetty, A. (2021). Brain tumor detection: An application based on machine learning. In 2021 2nd International Conference for Emerging Technology (INCET) (pp. 1–4). https://doi.org/10.1109/INCET51464.2021.9456347
- Gao, K., Liu, B., Yu, X., & Yu, A. (2022). Unsupervised meta learning with multiview constraints for hyperspectral image small sample set classification. IEEE Transactions on Image Processing, 31, 3449–3462. https://doi.org/10.1109/TIP.2022.3169689
- Guo, J. (2021). Prototype calibration with feature generation for few-shot remote sensing image scene classification. Remote Sensing, 13(14), 2728. https://doi.org/10.3390/rs13142728
- Gyamfi, K. S., Brusey, J., Hunt, A., & Gaura, E. I. (2018). Linear dimensionality reduction for classification via a sequential Bayes error minimisation with an application to flow meter diagnostics. Expert Systems with Applications, 91, 252–262. https://doi.org/10.1016/j.eswa.2017.09.010
- H, M. Y. (2022). BMI Dataset. https://www.kaggle.com/datasets/yasserh/bmidataset
- Hansen, L., & Salamon, P. (1990). Neural network ensembles. IEEE Transactions on Pattern Analysis and Machine Intelligence, 12(10), 993–1001. https://doi.org/10.1109/34.58871
- Ismail Fawaz, H., Forestier, G., Weber, J., Idoumghar, L., & Muller, P. A. (2019). Deep learning for time series classification: A review. Data Mining and Knowledge Discovery, 33(4), 917–963. https://doi.org/10.1007/s10618-019-00619-1
- Jee, H., Lee, K., & Pan, S. (2004). Eye and face detection using SVM. In Proceedings of the 2004 Intelligent Sensors, Sensor Networks and Information Processing Conference, 2004 (pp. 577–580). https://doi.org/10.1109/ISSNIP.2004.1417525
- Johnson, B. A., Tateishi, R., & Xie, Z. (2012). Using geographically weighted variables for image classification. Remote Sensing Letters, 3(6), 491–499. https://doi.org/10.1080/01431161.2011.629637
- Katiyar, G., & Mehfuz, S. (2015). SVM based off-line handwritten digit recognition. In 2015 Annual IEEE India Conference (INDICON) (pp. 1–5). https://doi.org/10.1109/INDICON.2015.7443398
- Koklu, M., & Ozkan, I. A. (2020). Multiclass classification of dry beans using computer vision and machine learning techniques. Computers and Electronics in Agriculture, 174, 105507. https://doi.org/10.1016/j.compag.2020.105507
- Kothari, S., & Oh, H. (1993). Neural networks for pattern recognition. In M. C. Yovits (Ed.) (Vol. 37, pp. 119–166). Elsevier.
- Krzysztof J. Cios, L. A. K. (2001). SPECTF Heart Data Set. https://archive.ics.uci.edu/ml/datasets/SPECTF+Heart
- Li, H., Zhao, H., & Li, H. (2019). Neural-response-based extreme learning machine for image classification. IEEE Transactions on Neural Networks and Learning Systems, 30(2), 539–552. https://doi.org/10.1109/TNNLS.2018.2845857
- Liu, J., Fan, L., Jia, Q., Wen, L., & Shi, C. (2021). Early diabetes prediction based on stacking ensemble learning model. In 2021 33rd Chinese Control and Decision Conference (CCDC) (pp. 2687–2692). https://doi.org/10.1109/CCDC52312.2021.9601932
- Lohweg, V. (2012). Banknote authentication data set. https://archive.ics.uci.edu/ml/datasets/banknote+authenticationl
- Madan, H. (2022). 3-wine classification dataset. https://www.kaggle.com/datasets/tug004/3wine-classification-dataset
- Mehra, A. (2022a). 3-wine classification dataset. https://www.kaggle.com/datasets/tug004/3wine-classification-dataset
- Mehra, A. (2022b). roomoccupancy. https://www.kaggle.com/datasets/aahanmehra/roomoccupancy
- Mounica, R. O., Soumya, V., Krovvidi, S., Chandrika, K. S., & Gayathri, R. (2019). A multi layer ensemble learning framework for learning disability detection in school-aged children. In 2019 10th International Conference on Computing, Communication and Networking Technologies (ICCCNT) (pp. 1–6). https://doi.org/10.1109/ICCCNT45670.2019.8944774
- Naqi, S. M., Sharif, M., & Yasmin, M. (2018). Multistage segmentation model and SVM-ensemble for precise lung nodule detection. International Journal of Computer Assisted Radiology and Surgery, 13(7), 1083–1095. https://doi.org/10.1007/s11548-018-1715-9
- Nekouei, M., & Sartoli, S. (2019). Modeling the structured porous network using stacked ensemble learning. In 2019 IEEE 43rd Annual Computer Software and Applications Conference (COMPSAC) (Vol. 2, pp. 80–84). https://doi.org/10.1109/COMPSAC.2019.10187
- Oloso, M. A., Hassan, M. G., Bader-El-Den, M. B., & Buick, J. M. (2018). Ensemble SVM for characterisation of crude oil viscosity. Journal of Petroleum Exploration and Production Technology, 8, 531–543. https://doi.org/10.1007/s13202-017-0355-x
- Patrício, M., Pereira, J., Crisóstomo, J., Matafome, P., Gomes, M., Seiça, R., & Caramelo, F. (2018, January). Using resistin, glucose, age and BMI to predict the presence of breast cancer. BMC Cancer, 18(1), 29. 10.1186/s12885-017-3877-1
- Rahman, R. (2022). Heart Attack Analysis & Prediction Dataset. https://www.kaggle.com/datasets/rashikrahmanpritom/heart-attack-analysis-prediction-dataset
- Sejnowski, T. J., & Rosenberg, C. R. (1987). Parallel networks that learn to pronounce English text. Complex System, 1(1), 145–168.
- Shapiro, A. (1989). Chess (King-Rook vs. King-Pawn) Data Set. https://archive.ics.uci.edu/ml/datasets/Chess+King-Rook+vs.+King-Pawn
- Sohail, S., Fan, Z., Gu, X., & Sabrina, F. (2022). Multi-tiered artificial neural networks model for intrusion detection in smart homes. Intelligent Systems with Applications, 16, 200152. https://doi.org/10.1016/j.iswa.2022.200152
- Sun, Y., & Fu, L. (2022). Stacking ensemble learning for non-line-of-sight detection of global navigation satellite system. IEEE Transactions on Instrumentation and Measurement, 71, 1–10. https://doi.org/10.1109/TIM.2022.3170985
- Ukey, K. P., & Alvi, A. S. (2012). Text classification using support vector machine. Journal of Software Engineering & Applications, 5(12), 55–58. https://doi.org/10.4236/jsea.2012.512B012
- Vapnik, V. (2000). SVM method of estimating density, conditional probability, and conditional density. In 2000 IEEE International Symposium on Circuits and Systems (ISCAS) (Vol. 2, pp. 749–752). https://doi.org/10.1109/ISCAS.2000.856437
- Vapnik, V. N. (1995). The nature of statistical learning theory. Springer-Verlag New York, Inc.
- Wang, J., Zhao, C., Huo, Z., Qiao, Y., & Sima, H. (2022). High quality proposal feature generation for crowded pedestrian detection. Pattern Recognition, 128(5), 108605. https://doi.org/10.1016/j.patcog.2022.108605
- Wang, K., Liu, X., Zhao, J., Gao, H., & Zhang, Z. (2020). Application research of ensemble learning frameworks. In 2020 Chinese Automation Congress (CAC) (pp. 5767–5772). https://doi.org/10.1109/CAC51589.2020.9326882
- Wolpert, D. H. (1992). Stacked generalization. Neural Networks, 5(2), 241–259.https://doi.org/10.1016/S0893-6080(05)80023-1
- Woods, K., Kegelmeyer, W., & Bowyer, K. (1997). Combination of multiple classifiers using local accuracy estimates. IEEE Transactions on Pattern Analysis and Machine Intelligence, 19(4), 405–410. https://doi.org/10.1109/34.588027
- Zhang, T., & Li, J. (2021). Credit risk control algorithm based on stacking ensemble learning. In 2021 IEEE International Conference on Power Electronics, Computer Applications (ICPECA) (pp. 668–670). https://doi.org/10.1109/ICPECA51329.2021.9362514
- Zhou, Z. H. (2021). Ensemble learning. In Machine learning (pp. 181–210). Springer Singapore. https://doi.org/10.1007/978-981-15-1967-3_8