
Abstract
Background
Head-to-head comparisons through randomized controlled trials (RCTs) provide high-quality evidence to inform healthcare decisions. In their absence, indirect comparisons are often performed; however, evidence is limited on how valid matching-adjusted indirect comparison (MAIC)–based comparative efficacy estimates are vs. RCT-based estimates.
Objectives
Compare MAIC and RCT results of guselkumab vs. secukinumab and ixekizumab to provide insight into the validity of results generated using MAIC methods.
Methods
Previously reported results from MAICs of guselkumab vs. secukinumab and ixekizumab were compared with results from ECLIPSE and IXORA-R RCTs based on risk differences between Psoriasis Area and Severity Index (PASI) 90 response rates.
Results
Risk difference (95% confidence interval) in PASI 90 response rates at week 48 for guselkumab vs. secukinumab was 14.4% (9.4%; 19.4%) in ECLIPSE and 9.4% (4.7%; 14.0%) in the MAIC. The risk difference at week 24 for guselkumab vs. ixekizumab was 0.0% (−5.4%; 5.4%) in IXORA-R and 0.7% (−5.1%; 6.4%) in the MAIC.
Conclusions
Comparative efficacy results were consistent between MAICs and RCTs of guselkumab vs. secukinumab and ixekizumab. This analysis demonstrates that MAIC methods can provide valid relative treatment effect estimates when direct comparisons are lacking, particularly when trials with similar designs and patient populations inform the analysis.
Introduction
It is established that randomized controlled trials (RCTs) provide the highest quality evidence to inform treatment and formulary decisions (Citation1–6). However, in diseases such as psoriasis, for which there are a multitude of novel treatment options, it is not feasible to conduct randomized, active-controlled trials among all available therapies (Citation7). In such context, indirect treatment comparisons (ITCs) are widely used to compare therapies, to support decision-making. Depending on data availability and the ability to adjust those data for differences across trials, various methodologies can be used to perform ITCs of different active treatments (Citation8–11). When only summary-level data are available, methods are limited to ITCs anchored to a common comparator (e.g. placebo), including network meta-analyses (NMAs). When individual patient-level data for one treatment and only summary-level for the comparator are available from similarly designed RCTs, a broader set of approaches, including matching-adjusted indirect comparisons (MAICs), can be performed. MAICs allow adjustment for potential bias due to differences across trials regarding treatment effect modifiers. MAICs can be anchored, when there is a common comparator arm in each trial to connect the network, or unanchored, when the treatment network is disconnected (Citation12,Citation13). Unanchored MAICs use individual patient-level data from a treatment arm in one trial and match it to summary-level baseline characteristics of a treatment arm of interest in another trial (Citation14). Adjustment for all prognostic variables is required.
While ITCs can provide robust results, it is of interest to validate the accuracy of the results generated by these analyses. An ideal situation for validation is a case where an ITC between different therapies can be compared with an RCT directly comparing the same therapies in similar patient populations and clinical settings. This paper examines two such cases, both involving the psoriasis therapy guselkumab (GUS), an interleukin (IL)-23 p19 inhibitor, compared with the IL-17 inhibitors secukinumab (SEC) and ixekizumab (IXE), respectively. In 2017, in the absence of head-to-head data, unanchored MAICs (Citation15) were performed using data from 48-week, phase III, placebo-controlled trials of GUS (Citation16,Citation17), SEC (Citation18–21), and IXE (Citation22); when 3-year GUS and IXE efficacy data became respectively available, an updated unanchored MAIC (Citation23) was performed comparing the two treatments in the longer term (Citation24,Citation25). More recently, head-to-head data became available from RCTs directly comparing GUS vs. SEC (ECLIPSE) over 48 weeks (Citation26) and GUS vs. IXE (IXORA-R) over 24 weeks (Citation27,Citation28). Here, we compare the MAIC-based results for GUS vs. SEC and GUS vs. IXE (Citation15,Citation23) with the head-to-head results from ECLIPSE (Citation26) and IXORA-R (Citation27,Citation28) to provide insight into the reliability of data generated using unanchored MAIC methods.
Methods
Previously conducted unanchored MAIC analyses
Unanchored MAICs (Citation15) of GUS vs. SEC and IXE were previously performed using available trial data up to and including 48 weeks of treatment (Citation16–22). An updated unanchored MAIC (Citation23) comparing GUS vs. IXE was performed when 3-year trial data became available for each treatment (Citation24,Citation25). The MAICs were conducted using methods outlined in the National Institute for Health and Care Excellence Decision Support Unit Technical Support Document 18 (Citation12).
The studies informing the MAICs included two phase III, placebo-controlled trials of GUS (VOYAGE 1 and VOYAGE 2) (Citation16,Citation17,Citation24) vs. four phase III, placebo-controlled trials of SEC (ERASURE, FIXTURE, FEATURE, and JUNCTURE) (Citation18–21) and one of IXE (UNCOVER-3) (Citation22,Citation25). The comparisons vs. IXE did not include data from the UNCOVER-1 and UNCOVER-2 studies (Citation22,Citation29) because the designs of the maintenance phases of those trials were not comparable to the other included studies (i.e. at Week 12, patients who responded to IXE treatment entered a randomized withdrawal period in which they were randomly reassigned to IXE or placebo) (Citation29).
Key characteristics of the large-scale VOYAGE 1, VOYAGE 2, FIXTURE, ERASURE, and UNCOVER-3 studies are shown in . Overall, there was a good alignment of patient eligibility criteria across studies and, based on clinical input, trial characteristics were considered suitably similar for the performance of high-quality MAIC analyses. The observed baseline characteristics in the active treatment arms of these studies are summarized in . Design and baseline characteristics from the smaller JUNCTURE and FEATURE trials were similar to those observed in the larger SEC trials (FIXTURE and ERASURE) (Citation18).
Table 1. Key characteristics of large-scale studies included in the 2017 unanchored MAIC (Citation16–18,Citation22).
Table 2. Summary of observed baseline characteristics from the large-scale studies included in the 2017 unanchored MAIC (Citation16–18,Citation22).
Individual patient-level baseline characteristics from the pooled GUS trials (Citation16,Citation17) were re-weighted to match the summary-level baseline characteristics reported in the comparator trials (Citation18–20,Citation22). Matching was based on propensity score weighting methods (Citation14), which were performed by weighting patient-level data by the inverse odds of being in the GUS treatment group vs. a comparator treatment group (where only aggregate data were available). The propensity score model was estimated using the generalized method of moments based on the aggregate data and individual patient data.
All available prognostic variables, identified based on clinical input, were included for adjustment in the analyses: primary demographics (e.g. age, race, gender, body weight, and body mass index) and disease characteristics (e.g. duration of psoriasis, percent of body surface area involvement, baseline Psoriasis Area and Severity Index [PASI] score, baseline Dermatology Life Quality Index score, baseline Investigator’s Global Assessment score, and treatment history [e.g. prior use of biologic therapy, systemic therapy, and/or phototherapy]). There was some variation in the adjustments performed using data from specific studies due to differences in the availability of patient characteristics used as covariates between the SEC (FEATURE, FIXTURE, and ERASURE) vs. IXE (UNCOVER-3) studies (Citation18,Citation19,Citation22).
MAIC efficacy comparisons were performed using the adjusted individual patient-level data from the GUS studies (Citation16,Citation17) vs. summary-level data for patients treated with SEC (Citation18–21) or IXE (Citation22). To perform a comparison of binary endpoints, patient-level outcome data from SEC and IXE trials were reconstructed using the reported outcomes and pooled with weighted patient-level data from VOYAGE 1 and VOYAGE 2.
For comparisons of GUS and SEC data, similar time points were leveraged and non-responder imputation (NRI) methods (the primary imputation method in the planned analyses of the GUS and SEC studies) were applied to handle missing data that resulted from patient treatment discontinuation.
The IXE study used modified NRI (mNRI) as the primary method for handling missing data, meaning that patients who discontinued the study treatment because of adverse events, lack of efficacy, or relapse were considered non-responders (i.e. NRI definition of treatment failures), while all other cases of missing data were imputed to estimate the observations that would have been made if the patient had continued the study treatment (i.e. the multiple imputation [MI] method). NRI data were not reported and could only be derived at a few time points; therefore, to optimize the comparability of data across as many overlapping time points as possible, mNRI data from the GUS and IXE studies were used as the base case; NRI and MI methods were assessed in sensitivity analyses. Risk differences with 95% confidence intervals (CIs) and p-values were generated to express the relative treatment effects of GUS vs. SEC or IXE for the probability of reaching clinical response (defined as PASI 90) at specific time points.
Comparison of unanchored MAIC results with subsequent head-to-head trial results
After the unanchored MAICs were performed and reported, results from head-to-head RCTs were published making very similar comparisons of PASI 90 response: ECLIPSE(Citation26) compared 48 weeks of treatment with GUS vs. SEC, and IXORA-R (Citation27,Citation28) compared 24 weeks of treatment with GUS vs. IXE. Results from these studies were leveraged to provide insight into the reliability of the results generated previously by the unanchored MAICs. Forest plots were generated overlaying the risk differences in PASI 90 response rates with 95% CIs for GUS vs. SEC or IXE from the MAICs and the head-to-head trials. Z-scores and corresponding p-values at each time point were calculated based on the variation between risk differences and standard errors.
Results
Comparisons of GUS vs. SEC
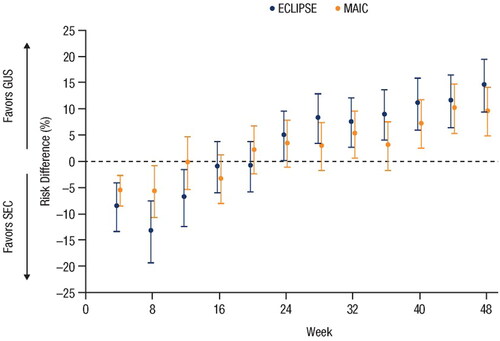
The PASI 90 response rates for GUS and SEC from the unanchored MAIC (Citation15) and from the head-to-head ECLIPSE (Citation26) trial are shown in , respectively. Forest plots showing risk differences between PASI 90 response rates with 95% CIs for GUS vs. SEC over time for the MAIC and ECLIPSE are shown in : at Week 12, the risk difference (95% CI) for achieving PASI 90 with GUS vs. SEC was −7.0% (−12.4%; −1.6%) in ECLIPSE and −0.3% (−5.3%; 4.7%) in the MAIC; at Week 24, the risk difference (95% CIs) was 4.9% (0.2%; 9.7%) in ECLIPSE and 3.3% (–1.2%; 7.7%) in the MAIC; at Week 48, the risk difference (95% CIs) was 14.4% (9.4%; 19.4%) in ECLIPSE and 9.4% (4.7%; 14.0%) in the MAIC. At all compared time points, the 95% CIs overlapped for the MAIC and ECLIPSE (), the Z-scores ranged from −1.367 to 1.23, and all p-values were >0.1. These findings support the consistency of the risk differences between GUS and SEC as reported by the MAIC and ECLIPSE.
Figure 1. Comparisons of PASI 90 response rates for guselkumab vs. secukinumab based on (A) unanchored MAIC using pooled data from VOYAGE 1 and VOYAGE 2 vs. pooled data from ERASURE, FIXTURE, JUNCTURE, and FEATURE using NRI methods, and (B) head-to-head comparison in the ECLIPSE trial (Citation15,Citation26). Error bars represent 95% CI. CI: confidence interval; MAIC: matching-adjusted indirect comparison; NRI: non-responder imputation; PASI: Psoriasis Area and Severity Index.
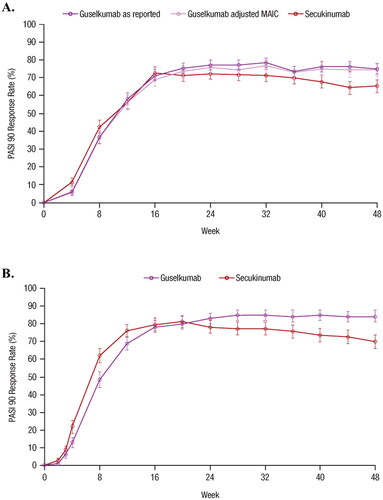
Figure 2. Forest plot of the risk differences in PASI 90 response rates over time based on results from the MAIC and the head-to-head ECLIPSE trial (Citation15,Citation26). Error bars represent 95% CI. CI: confidence interval; GUS: guselkumab; MAIC: matching-adjusted indirect comparison; PASI: Psoriasis Area and Severity Index; SEC: secukinumab.
Short-term PASI 90 response rates were numerically higher with SEC vs. GUS through Week 8 in the MAIC and through Week 20 in the ECLIPSE trial. Longer-term responses favored GUS, with a significantly higher proportion of patients treated with GUS achieving PASI 90 vs. SEC at Week 48 in the MAIC (75% vs. 65%) and ECLIPSE (84% vs. 70%) (Citation15,Citation26).
Comparisons of GUS Vs. IXE
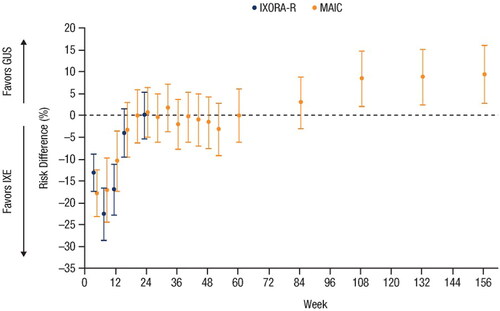
shows PASI 90 response rates for GUS vs. IXE from the unanchored MAIC through to Week 156 using mNRI and NRI methods. shows PASI 90 response rates through to Week 24 from the IXORA-R head-to-head trial; the rates are based on the NRI method. displays the risk differences and 95% CIs for GUS vs. IXE over time for the MAIC and IXORA-R. At Week 24, the risk difference (95% CI) for achieving PASI 90 with GUS vs. IXE was 0.0% (−5.4%; 5.4%) in IXORA-R and 0.7% (−5.1%; 6.4%) in the MAIC. At each compared time point, the 95% CIs overlapped for the MAIC and IXORA-R, Z-scores ranged from −1.004 to 0.969, and all p-values were >0.1. Results using NRI methods are shown in Supplemental Figure 1.
Figure 3. Comparison of guselkumab vs. ixekizumab based on PASI 90 response rates in (A) the unanchored MAIC using data from VOYAGE 1 and VOYAGE 2 vs. UNCOVER-3 through Week 156 using mNRI and NRI methods, and (B) from IXORA-R through Week 24. Error bars represent 95% CI. CI: confidence interval; MAIC: matching-adjusted indirect comparison; mNRI: modified non-responder imputation; NRI: non-responder imputation; PASI: Psoriasis Area and Severity Index.
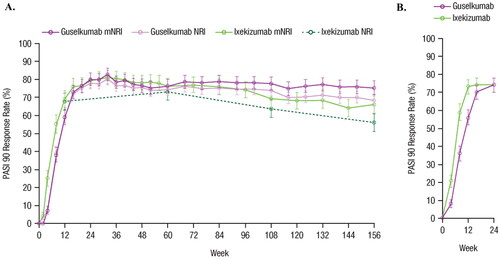
Figure 4. Forest plot of the risk differences in PASI 90 response rates over time based on results from the head-to-head IXORA-R trial using NRI methods and the unanchored MAIC using mNRI methods (Citation23,Citation27). Error bars represent 95% CI. CI: confidence interval; GUS: guselkumab; IXE: ixekizumab; MAIC: matching-adjusted indirect comparison; mNRI: modified non-responder imputation; PASI: Psoriasis Area and Severity Index.
Through Week 24 (the last available time point assessed in IXORA-R), results comparing GUS vs. IXE from the MAIC were consistent with IXORA-R. Week 24 PASI 90 response rates for GUS vs. IXE were similar in the MAIC (80% vs. 79%, based on mNRI) and IXORA-R (74% vs. 74%) (Citation27,Citation28). The MAIC was able to compare GUS vs. IXE up to 156 weeks, and the results demonstrated that GUS induced significantly superior PASI 90 response rates over the long term (); however, as IXORA-R does not report beyond 24 weeks, longer-term comparison between the MAIC results and the head-to-head trial results was not possible.
Discussion
While there are many highly effective biologic therapies available for the treatment of moderate-to-severe plaque psoriasis (Citation30), direct comparative efficacy data between all biological therapies are limited. Therefore, decision-makers are increasingly relying on ITC results. The availability of results comparing GUS with SEC and IXE for the treatment of moderate-to-severe plaque psoriasis from unanchored MAICs and subsequent head-to-head studies provided a valuable opportunity to validate the MAIC methodology.
PASI 90 response rates from the unanchored MAIC were consistent with results from the head-to-head trials comparing GUS vs. SEC and IXE. The consistently overlapping CIs and non-significant p-values for the risk differences in PASI 90 response rate comparisons in these MAICs and RCTs are supportive of the MAIC methodology. The MAICs (prior to the availability of head-to-head studies) were based on placebo-controlled trials that had largely similar designs, populations, statistical methods, and standardized outcome assessments and allowed for the adjustment of many important prognostic factors. The comparison of the MAIC and RCT results suggests that MAICs using data from similarly designed studies may provide reliable data for healthcare decision-makers.
Alternative approaches
MAIC methods can provide robust comparative data; depending on data availability, various alternative methods can be used to perform ITCs. In selecting an ITC method, an important goal is to minimize bias that can be introduced due to differences across studies in patient characteristics, background therapies, and outcome assessments (Citation31).
Traditional NMAs of IL inhibitors in psoriasis have been conducted leveraging the placebo arm from pivotal phase III trials as the common comparator across studies (Citation32,Citation33). However, these studies are mostly limited to the common short-term (e.g. 10–16 weeks), placebo-controlled induction period, as most RCTs allow patients from the placebo arm to switch to active treatment, meaning that the placebo can no longer serve as the common comparator for long-term treatment outcomes. Additionally, variability in placebo responses across psoriasis trials presented challenges (Citation34) and placebo was found to be significantly associated with treatment effects, necessitating NMA approaches that adjust for reference-arm outcomes (Citation35).
The MAIC approach to ITCs can be performed when baseline summary statistics for one treatment and individual patient-level data for another treatment are both available from similarly designed RCTs (Citation14). When the trials being compared do not have a common treatment arm, unanchored MAICs are performed. This contrasts with anchored MAICs, which leverage a common comparator arm across trials to connect the network (Citation12,Citation13). In anchored MAICs, the relative treatment effects of two different therapies are compared vs. the common comparator (usually placebo). In unanchored MAICs, absolute treatment effects of different therapies are compared across trials and additional prognostic factors are included in the baseline adjustment across study populations (Citation13).
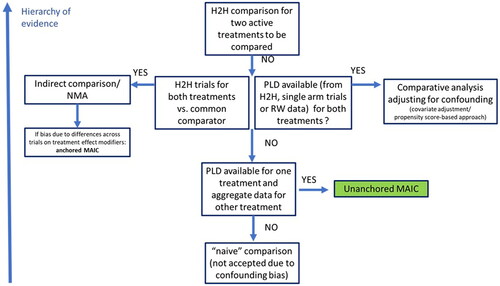
Based on the time horizon of interest (i.e. long term, beyond the induction phase) and the designs and data readiness of available trials, unanchored MAIC methodology was determined to be most appropriate for comparisons of GUS vs. SEC and IXE. provides a schematic illustrating how the most appropriate ITC choice was determined.
Figure 5. Schematic representation of appropriate circumstances for use of unanchored MAIC and other indirect comparison methods. H2H: head-to-head; MAIC: matching-adjusted indirect comparison; NMA: network meta-analysis; PLD: patient-level data; RW: real-world.
Limitations
While the unanchored MAIC was deemed appropriate, there are several key considerations associated with this methodology that warrant further comment; these are discussed here:
Different underlying assumptions are required for unanchored MAICs compared with traditional NMAs and anchored MAICs. The difference in assumptions is often stated as unanchored MAICs must adjust for all prognostic factors and effect modifiers, whereas anchored analyses must adjust only for effect modifiers. This gives the impression that unanchored MAICs require more assumptions than anchored MAICs. However, this is not true in a practical sense, or mathematically in general. First, the distinction between baseline characteristics that are effect modifiers vs. ‘only’ prognostic factors depends on the scale of the comparative effect measure (e.g., odds ratio vs. risk difference), is multivariable in nature (i.e., depends on which other variables are included in an adjusted model), and cannot be determined with certainty based on clinical input or the trial data. Additionally, the use of placebo arms as common comparators for anchored indirect comparisons may induce bias, as outcomes from these placebo arms may not be sufficiently comparable across psoriasis trials without reference-arm adjustment (Citation35), which requires large numbers of trials. Therefore, the assumptions required for anchored comparisons are not nested within nor fewer than those required for unanchored comparison; rather, anchored and unanchored approaches require different sets of assumptions, which require careful case-by-case consideration and are never fully testable without data from a head-to-head RCT.
The trials that inform an MAIC often have different approaches for handling missing data; to address this limitation in the case herein, mNRI and MI results were imputed for VOYAGE 1 and VOYAGE 2 to mimic the approaches used in UNCOVER-3; these updated VOYAGE 1 and VOYAGE 2 data analyses showed that efficacy results were similar using different imputation methods.
While it is reassuring that MAICs can adjust for baseline characteristics reported in RCTs, there is still no guarantee against bias due to unmeasured confounding; this highlights the importance of our validation of MAICs against subsequent head-to-head RCTs.
It needs to be acknowledged that the comparison of MAIC and head-to-head trial results had limited power to detect differences.
Credibility of the longer-term GUS vs. IXE MAIC (3 years) could not be assessed due to the relatively short duration (24 weeks) of the IXORA-R head-to-head study (Citation27,Citation28); this could be addressed if longer-term head-to-head data comparing GUS and IXE become available.
Relative treatment effects of GUS vs. SEC and IXE were similar between the MAICs and the head-to-head RCTs, but absolute efficacy responses were somewhat different (e.g. PASI 90 response rates were higher in both ECLIPSE treatment arms vs. the MAIC arms), suggesting that there are study differences in baseline prognostic factors that are not effect modifiers. This could be addressed in future by comparing baseline characteristics of the GUS VOYAGE 1 and VOYAGE 2 studies with the GUS ECLIPSE study to determine if adjustments would affect clinical outcomes (e.g. a starting point could be to review the following characteristics due to their notable differences: white race, 81% in VOYAGE 1 and VOYAGE 2 pooled guselkumab arm vs 93% in ECLIPSE guselkumab arm; Asian race, 15% vs 3%; and previous non-biologic systemic therapy, 66% vs 52%).
The MAIC results evaluated in this study were based on highly similar psoriasis trials. The suitability of MAIC application to other trials, outcome measures, populations, and therapeutic areas should be assessed on a case-by-case basis; generalization of our conclusions to future MAICs must be conducted with caution. Furthermore, here we have studied the validity of the MAIC approach, but other ITC approaches warrant similar evaluation; there is a need for more empirical validation studies such as this one for all ITC methods to better understand where these approaches can be most reliable.
Conclusion
We have presented a comparison where a unique opportunity allowed two MAICs in psoriasis to be validated by two subsequent RCTs. Consistency in results between unanchored MAICs and subsequent head-to-head RCTs, across multiple time points, supports the use of an MAIC approach when head-to-head RCT data are lacking, provided that the trials informing the MAIC are suitably similar. Particularly, when studies have similar trial designs, assess comparable clinical outcomes, report data on important prognostic factors, and have similar patient populations and when patient-level data are not available for all trials, the use of unanchored MAIC methods may provide valid predictions of longer-term comparative clinical results – key to clinical decision-making – that are not feasible to obtain in immunology studies designed with short placebo-controlled time frames.
Author contributions
The authors confirm contribution to the paper as follows: study conception and design: J. Diels, S. Van Sanden, A. Schubert, F. Hassan, P. Thilakarathne; data collection: S. Van Sanden, P. Thilakarathne; analysis and interpretation of results: J. Diels, S. Van Sanden, A. Schubert, F. Hassan, P. Thilakarathne, B. Ozturk, N. Barthelmes, J. Signorovitch, K. Reich. All authors reviewed the results, were involved in the draft manuscript preparation, and approved the final version of the manuscript.
Supplemental Material
Download JPEG Image (35.2 KB)
Acknowledgments
Medical writing support was provided by Wilson Joe, PhD, CMPP, of Cello Health, and was funded by Janssen EMEA HEMAR.
Disclosure statement
J. Signorovitch is an employee of Analysis Group Inc., which receives research funding from biopharmaceutical companies including Janssen. J. Diels is an employee of Janssen and holds stock in Johnson & Johnson. S. Van Sanden is an employee of Janssen and holds stock in Johnson & Johnson. A. Schubert is an employee of Janssen-Cilag Poland and holds stock in Johnson & Johnson. F. Hassan is an employee of Janssen Cilag Ltd and holds shares for Johnson & Johnson. P. Thilakarathne is an employee of Janssen. B. Ozturk is an employee of Janssen and holds stock in Johnson & Johnson. N. Barthelmes is an employee of Janssen and holds stock in Johnson & Johnson. K. Reich has served as advisor and/or paid speaker for and/or participated in clinical trials sponsored by AbbVie, Almirall, Amgen, Boehringer Ingelheim, Bristol Myers Squibb, Celgene, Forward Pharma, Gilead, Galderma, Janssen-Cilag, Kyowa Kirin, LEO, Lilly, Medac, Novartis, Ocean Pharma, Pfizer, Sanofi, and UCB; K. Reich is co-founder of MoonLake Immunotherapeutics.
Data availability statement
Data available on request from the authors; The data that support the findings of this study are available from the corresponding author, FH, upon reasonable request.
Additional information
Funding
References
- Jansen JP, Fleurence R, Devine B, et al. Interpreting indirect treatment comparisons and network meta-analysis for health-care decision making: report of the ISPOR task force on indirect treatment comparisons good research practices: part 1. Value Health. 2011;14(4):417–428.
- Schulz KF, Altman DG, Moher D, CONSORT Group, et al. CONSORT 2010 statement: updated guidelines for reporting parallel group randomised trials. BMJ. 2010;340:c332.
- The AMCP format for formulary submissions: welcome to version 4.0. J Manag Care Spec Pharm. 2016;22(5):444–446.
- Menter A, Strober BE, Kaplan DH, et al. Joint AAD-NPF guidelines of care for the management and treatment of psoriasis with biologics. J Am Acad Dermatol. 2019;80(4):1029–1072.
- Food and Drug Administration. FDA Draft Guidance. Demonstrating substantial evidence of effectiveness for human drug and biological products: guidance for industry; 2019. Available from: https://www.fda.gov/media/133660/download
- European Medicines Agency. ICH Topic E 10: choice of control group in clinical trials. CPMP/ICH/364/96; 2001; [cited 2020 Oct 19]. Available from: https://www.ema.europa.eu/en/documents/scientific-guideline/ich-e-10-choice-control-group-clinical-trials-step-5_en.pdf
- Cipriani A, Higgins JP, Geddes JR, et al. Conceptual and technical challenges in network meta-analysis. Ann Intern Med. 2013;159(2):130–137.
- Signorovitch JE, Wu EQ, Yu AP, et al. Comparative effectiveness without head-to-head trials: a method for matching-adjusted indirect comparisons applied to psoriasis treatment with adalimumab or etanercept. Pharmacoeconomics. 2010;28(10):935–945.
- Caro JJ, Ishak KJ. No head-to-head trial? simulate the missing arms. Pharmacoeconomics. 2010;28(10):957–967.
- Ishak KJ, Proskorovsky I, Benedict A. Simulation and matching-based approaches for indirect comparison of treatments. Pharmacoeconomics. 2015;33(6):537–549.
- Phillippo DM, Ades AE, Dias S, et al. Methods for population-adjusted indirect comparisons in health technology appraisal. Med Decis Making. 2018;38(2):200–211.
- Phillippo DM, Ades AE, Dias S, et al. NICE DSU Technical Support Document 18: Methods for population-adjusted indirect comparisons in submissions to NICE. 2016; [cited 2020 Aug 3]. Available from: http://nicedsu.org.uk/wp-content/uploads/2018/08/Population-adjustment-TSD-FINAL-ref-rerun.pdf
- Cope S, Toor K, Popoff E, et al. Critical appraisal of published indirect comparisons and network meta-analyses of competing interventions for multiple myeloma. Value Health. 2020;23(4):441–450.
- Signorovitch JE, Sikirica V, Erder MH, et al. Matching-adjusted indirect comparisons: a new tool for timely comparative effectiveness research. Value Health. 2012;15(6):940–947.
- Diels J, Van Sanden S, Druchok C, et al. Novel evidence synthesis methods to assess comparative efficacy in ‘disconnected’ networks of evidence: a case study assessing comparative efficacy of guselkumab versus interleukin-17 inhibitors for maintenance treatment of moderate-to-severe psoriasis. Poster presented at the annual Fall Clinical Dermatology Conference®; Las Vegas, Nevada, USA; October 2017. p. 12–15.
- Blauvelt A, Papp KA, Griffiths CE, et al. Efficacy and safety of guselkumab, an anti-interleukin-23 monoclonal antibody, compared with adalimumab for the continuous treatment of patients with moderate to severe psoriasis: results from the phase III, double-blinded, placebo- and active comparator-controlled VOYAGE 1 trial. J Am Acad Dermatol. 2017;76(3):405–417.
- Reich K, Armstrong AW, Foley P, et al. Efficacy and safety of guselkumab, an anti-interleukin-23 monoclonal antibody, compared with adalimumab for the treatment of patients with moderate to severe psoriasis with randomized withdrawal and retreatment: results from the phase III, double-blind, placebo- and active comparator-controlled VOYAGE 2 trial. J Am Acad Dermatol. 2017;76(3):418–431.
- Langley RG, Elewski BE, Lebwohl M, FIXTURE Study Group, et al. Secukinumab in plaque psoriasis–results of two phase 3 trials. N Engl J Med. 2014;371(4):326–338.
- Blauvelt A, Prinz JC, Gottlieb AB, FEATURE Study Group, et al. Secukinumab administration by pre-filled syringe: efficacy, safety and usability results from a randomized controlled trial in psoriasis (FEATURE). Br J Dermatol. 2015;172(2):484–493.
- Paul C, Lacour JP, Tedremets L, JUNCTURE study group, et al. Efficacy, safety and usability of secukinumab administration by autoinjector/pen in psoriasis: a randomized, controlled trial (JUNCTURE). J Eur Acad Dermatol Venereol. 2015;29(6):1082–1090.
- Lacour JP, Paul C, Jazayeri S, et al. Secukinumab administration by autoinjector maintains reduction of plaque psoriasis severity over 52 weeks: results of the randomized controlled JUNCTURE trial. J Eur Acad Dermatol Venereol. 2017;31(5):847–856.
- Griffiths CE, Reich K, Lebwohl M, et al. Comparison of ixekizumab with etanercept or placebo in moderate-to-severe psoriasis (UNCOVER-2 and UNCOVER-3): results from two phase 3 randomised trials. Lancet. 2015;386(9993):541–551.
- Diels J, Thilakarathne P, Van Sanden S, et al. Three-year clinical efficacy of guselkumab and ixekizumab in moderate-to-severe plaque psoriasis: a matching-adjusted indirect comparison. Poster presented at the annual Fall Clinical Dermatology Conference®; 17–20 October 2019; Las Vegas, Nevada, USA; 2019.
- Reich K, Griffiths CEM, Gordon KB, et al. Maintenance of clinical response and consistent safety profile with up to 3 years of continuous treatment with guselkumab: results from the VOYAGE 1 and VOYAGE 2 trials. J Am Acad Dermatol. 2020;82(4):936–945.
- Leonardi C, Maari C, Philipp S, et al. Maintenance of skin clearance with ixekizumab treatment of psoriasis: three-year results from the UNCOVER-3 study. J Am Acad Dermatol. 2018;79(5):824–830.e2.
- Reich K, Armstrong AW, Langley RG, et al. Guselkumab versus secukinumab for the treatment of moderate-to-severe psoriasis (ECLIPSE): results from a phase 3, randomised controlled trial. Lancet. 2019;394(10201):831–839.
- Blauvelt A, Papp K, Gottlieb A, IXORA-R Study Group, et al. A head-to-head comparison of ixekizumab vs. guselkumab in patients with moderate-to-severe plaque psoriasis: 12-week efficacy, safety and speed of response from a randomized, double-blinded trial. Br J Dermatol. 2020;182(6):1348–1358.
- Blauvelt A, Pinter A, Tada Y, et al. Ixekizumab versus guselkumab: 24-week clinical responses and 4-week gene expression data. Poster LB940. Presented at the 2020 Society for Investigative Dermatology (SID) Annual Meeting Virtual Conference; May 13–16; Scottsdale, Arizona, USA; 2020.
- Gordon KB, Blauvelt A, Papp KA, et al. Phase 3 trials of ixekizumab in moderate-to-severe plaque psoriasis. N Engl J Med. 2016;375(4):345–356.
- Gooderham MJ, Papp KA, Lynde CW. Shifting the focus – the primary role of IL-23 in psoriasis and other inflammatory disorders. J Eur Acad Dermatol Venereol. 2018;32(7):1111–1119.
- Pocock SJ. The combination of randomized and historical controls in clinical trials. J Chronic Dis. 1976;29(3):175–188.
- Sawyer LM, Malottki K, Sabry-Grant C, et al. Assessing the relative efficacy of interleukin-17 and interleukin-23 targeted treatments for moderate-to-severe plaque psoriasis: a systematic review and network meta-analysis of PASI response. PLOS One. 2019;14(8):e0220868.
- Gottlieb AB, Saure D, Wilhelm S, et al. Indirect comparisons of ixekizumab versus three interleukin-23 p19 inhibitors in patients with moderate-to-severe plaque psoriasis - efficacy findings up to week 12. J Dermatolog Treat. 2020;33(1):54–61.
- Song F, Altman DG, Glenny A-M, et al. Validity of indirect comparison for estimating efficacy of competing interventions: empirical evidence from published meta-analyses. BMJ. 2003;326(7387):472–472.
- Song F, Loke YK, Walsh T, et al. Methodological problems in the use of indirect comparisons for evaluating healthcare interventions: survey of published systematic reviews. BMJ. 2009;338(apr03 1):b1147.