
Abstract
Background
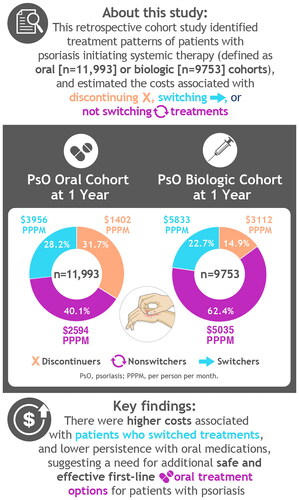
Psoriasis is a chronic, immune-mediated, systemic inflammatory disorder associated with high costs. This study evaluated real-world treatment patterns and associated costs in patients in the United States with psoriasis initiating systemic oral or biologic treatments.
Methods
This retrospective cohort study used IBM® (now Merative™) MarketScan® Commercial and Medicare claims (1 January 2006–31 December 2019) to evaluate patterns of switching, discontinuation, and nonswitching in two cohorts of patients initiating oral or biologic systemic therapy. Total pre-switch and post-switch costs were reported per-patient per-month (PPPM).
Results
Each cohort was analyzed (oral, n = 11,993; biologic; n = 9753). Among the oral and biologic cohorts, 32% and 15% discontinued index and any systemic treatment within 1 year of initiation; 40% and 62% remained on index therapy; and 28% and 23% switched treatment, respectively. In the oral and biologic cohorts, total PPPM costs within 1 year of initiation for nonswitchers, patients who discontinued, and patients who switched were $2594, $1402, and $3956, respectively, and $5035, $3112, and $5833, respectively.
Conclusion
This study identified lower persistence in the oral treatment cohort, higher costs associated with switching, and a need for safe and effective oral treatment options for patients with psoriasis to delay the switch to biologic therapy.
Graphical Abstract
Introduction
Psoriasis is a chronic, immune-mediated, systemic inflammatory disorder with an estimated prevalence of 3% in the United States (Citation1–3). Psoriasis is associated with high direct medical costs, particularly for patients with more severe disease (Citation2,Citation4). Systematic reviews in the United States have estimated the total annual direct cost of psoriasis ranged from $12.2 billion to $63.2 billion in 2013 (Citation5). On a patient level, one study estimated the 6-month total per-patient direct costs to be $11,291, indirect costs $2101, out-of-pocket costs to the patient $706, and productivity losses in terms of work impairment of about 14%, mainly due to presenteeism (Citation6). The chronic nature of psoriasis necessitates ongoing treatment of the condition, which contributes to the economic burden to patients and, more broadly, to the healthcare system (Citation7,Citation8).
Treatment options for psoriasis include topical therapies, phototherapy, and systemic oral and biologic therapies (Citation9). Psoriasis in most patients with mild to moderate disease can be managed with topical therapy or phototherapy, but moderate to severe psoriasis may require systemic therapies. Systemic therapies include oral medications (e.g., methotrexate, cyclosporine, acitretin, and apremilast), or biologic therapies (e.g., etanercept, infliximab, adalimumab, certolizumab, ustekinumab, secukinumab, ixekizumab, brodalumab, guselkumab, tildrakizumab, and risankizumab) (Citation1,Citation9). Additionally, apremilast, an oral systemic medication, was recently approved for mild to moderate psoriasis in the United States (Citation10).
Because of the chronic nature of psoriasis, the variability in treatment response and in a drug’s safety profile, and the availability of multiple therapies approved to treat the variety of psoriatic conditions, switching or discontinuing treatments is common (Citation11,Citation12). In several retrospective US claims studies, patients treated with biologic therapy commonly experience dose escalation or reduction, restarts, switching, and discontinuation of treatment (Citation8,Citation13–17). Patients who switched systemic treatments had higher medical and pharmacy costs overall compared with patients who continued with their initial medication (Citation18–20). Identifying the ideal treatment pathway that reduces or delays treatment switching could potentially reduce treatment costs overall.
Despite multiple treatments, an unmet need for patients with psoriasis exists owing to variability in response in which patients may not attain adequate skin clearance, improvements in symptom relief, or satisfactory quality of life (Citation9,Citation12). Several US retrospective analyses have been conducted to assess treatment patterns, including switch patterns and associated costs, yet a comparison between patients treated with oral versus biologic treatments has not been reported (Citation8,Citation13,Citation21). Comparing cohorts of oral and biologic treatment users may reveal cost implications associated with real-word treatment patterns. Therefore, the objective of our study was to evaluate real-world treatment patterns and associated costs in patients initiating any systemic medication for psoriasis (i.e., new oral medication and new biologic treatment users).
Methods
The study used a US commercial and Medicare database to evaluate patterns of switching, discontinuation, and nonswitching in two cohorts of patients with psoriasis who initiated systemic therapy (oral or biologic therapy). We estimated monthly costs pre-switch and post-switch in each treatment cohort, and for those who initiated systemic therapy with apremilast.
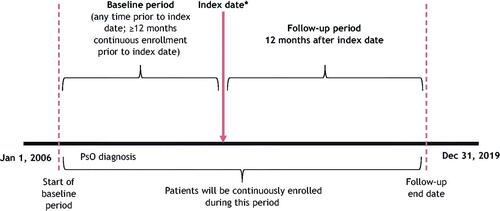
We extracted data from the IBM® (now Merative™) MarketScan® Commercial and Medicare Supplemental databases. The study period extended from 1 January 2006 (earliest data), through 31 December 2019. For each cohort, we defined the ‘index date’ as the date of a first prescription for an oral treatment (oral cohort) or biologic treatment (biologic cohort) during the index period (1 January 2013–31 December 2018). We established a baseline period as a minimum of 12 months prior to index date, and study follow-up period as the 12-month period after index date ().
Figure 1. Study design. *Index date is the date of the first biologic or oral prescription, which occurred between 1 January 2013 and 31 December 2017.
The study included patients if they had ≥1 prescription for an oral medication (apremilast, cyclosporine, methotrexate, or acitretin) or biologic medication (etanercept, infliximab, ixekizumab, secukinumab, brodalumab, ustekinumab, guselkumab, adalimumab, certolizumab pegol, or tildrakizumab) during the index period. The oral and biologic cohorts were not mutually exclusive; patients in the oral cohort could have prior biologic use and biologic cohort patients could have prior oral use. The study defined cohorts based on index treatment to examine switching, discontinuation, and nonswitching in the follow-up period. We included patients if they had ≥2 diagnosis codes (≥1 day apart) of psoriasis any time before the index date; had continuous medical and pharmacy enrollment for ≥1 year prior to and after the index date; and were aged ≥18 years as of the index date. We used International Classification of Diseases (ICD) diagnosis codes to identify diagnoses of psoriasis: 696.1 (ICD-9), and L40.0, L40.1, L40.2, L40.3, L40.4, L40.8, and L40.9 (ICD-10).
The study excluded patients with multiple oral or biologic medication initiations on the index date, or combination treatment (defined as initiating a second treatment within 30 days of index date, with a refill of index medication) during the index episode. We excluded patients if there was evidence of diagnosis of rheumatoid arthritis, psoriatic arthritis, ankylosing spondylitis, Crohn’s disease, ulcerative colitis, hidradenitis suppurativa, uveitis, Behçet’s disease, or juvenile idiopathic arthritis any time before the index date.
This study defined ‘switching’ as filling a prescription for another systemic treatment (oral or biologic) during the follow-up period. ‘Nonswitchers’ were those who persisted on their index therapy without a treatment gap (described as ‘persistent’), or who reinitiated index treatment after a gap. We defined ‘discontinuation’ as having a lapse in treatment beyond an allowable treatment gap. Those who never reinitiated or switched during the 1-year follow-up period were described as ‘pure discontinuers.’ We analyzed switchers by whether their treatment pattern included a treatment gap. For the oral cohort, we allowed ‘treatment gaps,’ defined as the drug’s days of supply + 30 days. The gap started at the end of each patient’s known days’ supply for the index drug. For the biologic cohort, we used induction and maintenance dosing intervals to define allowable treatment gaps. The base case definition for the treatment gap was 200% of the recommended dosing schedule. For example, for etanercept, which has a dosing interval of 7 days during the maintenance period, a treatment gap of ≥14 days would constitute discontinuation. We conducted a sensitivity analysis using a 30-day set treatment gap length for cases in which 200% of the dosing schedule was <30 days.
We summarized treatment patterns (i.e., switching, discontinuation, and nonswitching) for patients with psoriasis initiating oral or biologic treatments separately. We conducted an analysis to evaluate a cohort of patients initiating systemic treatment with apremilast, given that this is a newer, branded oral therapy. For each treatment pattern, we assessed costs by treatment setting (inpatient, outpatient, pharmacy, and emergency department) over the period before, during, and after the index treatment switch or pure discontinuation. We defined dependent variables of interest for treatment pattern analysis ().
Table 1. Definition of dependent variables.
We assessed dose escalation by drug to describe suboptimal treatment. This was defined as an increase in the average daily dose relative to the patient’s expected maintenance dose on an individual prescription or infusion. Expected maintenance doses were estimated based on US Food and Drug Administration–approved labels. We did not include induction dosing in the identification of dose escalation. We excluded patients without pharmacy records in the maintenance period, as well as patients with invalid dosing information.
Statistical analysis
The study reported descriptive statistics for baseline patient characteristics and outcomes. We summarized continuous variables using means and standard deviations (SDs), and categorical variables using counts and percentages. We provided descriptive statistics for oral and biologic cohorts separately, and constructed Sankey diagrams for each cohort to assess the switch from one treatment to another.
We reported total costs pre-switch and post-switch (for patients who switched or discontinued) in terms of per-patient per-month (PPPM) and summarized data graphically as column charts for each treatment pattern. We further characterized these patterns by a switch to a biologic or oral therapy. The study assessed healthcare costs for this population during baseline, index period (pre-switch), and following treatment modification (post-switch) for each cohort. Additionally, we assessed healthcare costs for apremilast, the latest approved oral systemic therapy (at time of analysis). Costs were adjusted to 2019 US dollars using the medical care component of the Consumer Price Index. Furthermore, we evaluated the time to switch to another treatment, time to reinitiate on index therapy (after treatment gap), and drug holiday before reinitiation or new initiation overall and by index treatment. We used Kaplan-Meier (KM) survival analysis to assess time to index treatment non-persistence (discontinuation or switch) and time to a switch. Cox regression modeling adjusted for differences in baseline characteristics. To examine temporal differences of newer, more efficacious biologic treatments entering the market during the study period, we constructed KM curves to assess persistence within the oral and biologic cohorts before and after 2015.
Results
A total of 22,268 patients in the MarketScan® Commercial and Supplemental database met the inclusion criteria for oral and biologic cohorts. Among them, 21,746 patients were included for further analysis after patients with multiple drugs on or after the index date and combination-therapy patients were removed (Supplemental Table S1).
Baseline characteristics
Across the oral cohort (N = 11,993), the mean (SD) age ranged from 45.5 (15.2) years for patients taking cyclosporine to 54.1 (12.9) years for patients taking acitretin (). The mean age was 50.4 (13.7) years for the overall oral cohort, and 53% of the oral treatment cohort were female. The mean (SD) Charlson Comorbidity Index (CCI) was 1.0 (1.6). The most prevalent comorbidities during the baseline period were hyperlipidemia (51%), hypertension (46%), cardiovascular disease (43%), chronic pulmonary disease (25%), and obesity (26%). Approximately 12% of patients in the oral cohort had prior use of a biologic; apremilast users had the highest percentage of prior biologic use (16%). The most common index oral medication was apremilast (42%), and the least common was cyclosporine (4%).
Table 2. Demographics and baseline characteristics of patients on oral systemic treatments for psoriasis.
A total of 9753 patients were included in the biologic cohort (). The overall mean (SD) age was 46.2 (13.4) years. The mean age for the two most commonly prescribed index biologic therapies was 45.7 (13.0) years and 46.2 (14.2) years for adalimumab and ustekinumab, respectively. Overall, the mean (SD) CCI was 0.7 (1.2) for the biologic cohort. As in the oral cohort, hyperlipidemia (42%), hypertension (41%), cardiovascular disease (34%), obesity (24%), and chronic pulmonary disease (20%) were the most prevalent comorbidities in the baseline period. The most common index biologic medication was adalimumab (55%), followed by ustekinumab and etanercept. Sensitivity analysis using the alternative treatment gap definition showed minimal changes to treatment pattern samples and to costs (data not shown).
Table 3. Demographics and baseline characteristics of patients on a biologic therapy.
Treatment patterns
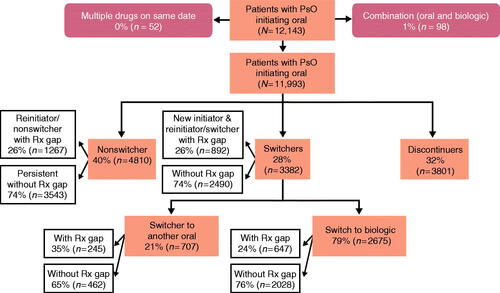
Among the oral cohort, 32% of patients discontinued their index treatment within 1 year of initiation, 40% remained on index therapy, and 28% switched to another treatment. Most switches (79%) were to biologic therapies. Of the 40% who remained on index therapy (nonswitchers), 74% were persistent on their index therapy without any treatment gaps, and 26% reinitiated their index therapy after a treatment gap ().
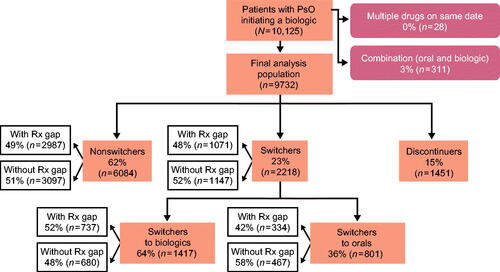
Figure 2. Oral initiator cohort with 12 months of follow-up. A study design flow chart depicting numbers and percentages of patients included in the analysis population of the oral cohort with 12 months of follow-up. It is further broken down by nonswitchers, switchers (to orals and biologic therapies), and discontinuers. Rx: prescription.
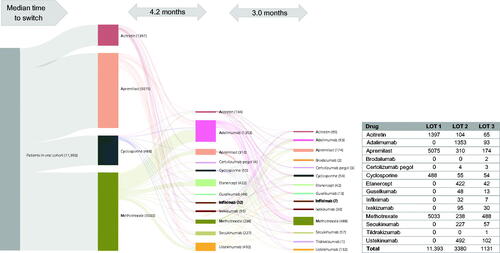
Treatment patterns after 1 year of oral treatment are presented by index oral treatment (). The persistence rate among patients who started treatment on apremilast was 41% at 1 year; however, this was the highest among all oral treatments. Almost half of patients (47%) who initiated apremilast switched or discontinued by 12 months. Patients who started treatment on cyclosporine, methotrexate, or acitretin all had high rates of discontinuation and low rates of persistence. Patients who started treatment on cyclosporine had the highest rates of switching in the oral cohort (44%). A Sankey diagram shows the flow of patients through lines of therapy for the oral cohort (). Apremilast was the most common first-line therapy; the median time to switching was 4.2 months. Adalimumab was the most common second-line therapy, followed by ustekinumab and etanercept; all 3 are biologic therapies. Methotrexate, an oral treatment, was the most common third-line therapy, with a median time to switch of 3.0 months from second-line to third-line treatment.
Figure 3. Treatment patterns after 1 year of oral treatment in the oral cohort. A bar graph of 1-year treatment patterns in the oral cohort. Treatments include apremilast, cyclosporine, methotrexate, and acitretin. Percentages are given for switchers, pure discontinuers, reinitiator/nonswitchers, and persistence within each treatment.
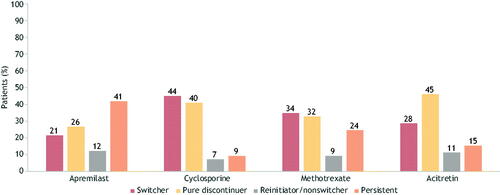
Figure 4. Treatment patterns of switching (with/without gap) in the oral cohort (LOT 1 – 2 – 3). A Sankey diagram showing median time to switch from first- to second- and third-line therapies in the oral cohort. LOT: line of therapy.
In the biologic cohort, 62% of patients remained on index therapy during the follow-up period, while 23% of patients switched to another treatment and 15% patients discontinued their index treatment over 12 months (). Among the 8302 patients who continued to receive therapy through 12 months, 27% were switchers. Among biologic treatment initiators who switched therapy, most switched to another biologic treatment, while 36% switched to an oral therapy.
Figure 5. Biologic initiator cohort with 12 months of follow-up. A study design flow chart depicting numbers and percentages of patients included in the analysis population of the biologic cohort with 12 months of follow-up. It is further broken down by nonswitchers, switchers (to oral treatments and to biologic therapies), and discontinuers. Rx: prescription.
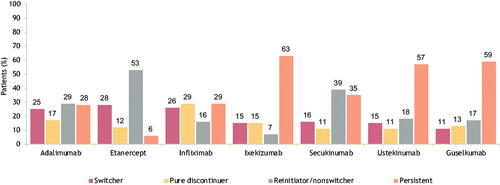
Patients who started treatment on an anti-interleukin agent (ixekizumab, secukinumab, ustekinumab, or guselkumab) were the most persistent on their treatment after 1 year (). Patients who started treatment on an anti-tumor necrosis factor agent, i.e., adalimumab, etanercept, or infliximab, had higher rates of discontinuation, lower rates of persistence, and the highest rates of switching within the biologic cohort.
Figure 6. Treatment patterns after 1 year of select biologic treatment in the biologic cohort. A bar graph of 1-year treatment patterns in the biologic cohort. Treatments include adalimumab, etanercept, infliximab, ixekizumab, secukinumab, ustekinumab, and guselkumab. Percentages are given for switchers, pure discontinuers, reinitiator/nonswitchers, and persistence within each treatment.
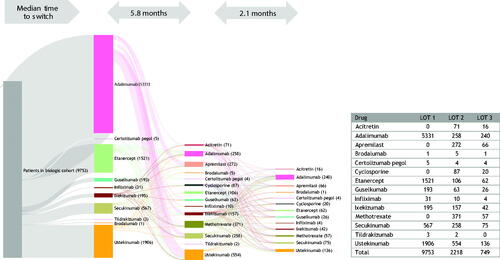
A Sankey diagram shows the flow of patients through lines of therapy for the biologic cohort (). Adalimumab was the most common first-line biologic therapy, and median time to switch was 5.8 months. Ustekinumab was the most commonly prescribed second-line therapy, followed by the oral therapies methotrexate, and apremilast; the median time to switching from a second- to a third-line therapy was 2.1 months, similar to that seen in the oral treatment cohort. Adalimumab was the most commonly prescribed third-line therapy.
Figure 7. Treatment patterns of switching (with/without gap) in biologic cohort (LOT 1 – 2 – 3). A Sankey diagram showing median time to switch from first- to second- and third-line therapies among the biologic cohort. LOT, line of therapy.
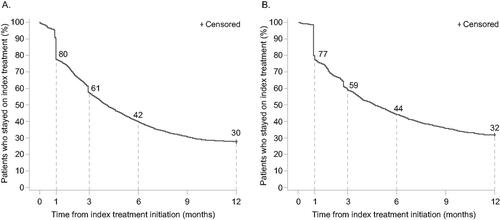
Based on the KM curve for time to index treatment non-persistence, 39% of patients in the oral cohort had treatment switches and discontinuations at 3 months after the index date. This rate increased to 58% and 70% at 6 months and 12 months, respectively. At 3 months after index date, 41% of the patients had index treatment non-persistence. This rate increased to 56% and 68% at 6 and 12 months, respectively (). In the analyses before and after 2015, persistence improved after 2015 in both the oral and biologic cohorts (Supplemental Figure S1). In the oral cohort, at 6 months after the index date, 34% vs. 46% of patients had index treatment non-persistence for index years before and after 2015, respectively. Similarly, in the biologic cohort, at 6 months after the index date, 36% vs. 48% of patients had index treatment non-persistence for index years before and after 2015, respectively.
Figure 8. Kaplan–Meier (KM) curves for time to index treatment non-persistence with oral treatments (A) and biologic therapies (B). KM curves depict time to index treatment non-persistence (discontinuation or switch) for oral and biologic cohorts.
Cost analysis
Costs after switching were generally higher than costs prior to treatment switches, regardless of cohort assignment (). Within each cohort, pre-switch costs were lowest for reinitiators, followed by nonswitchers. Costs dropped after discontinuation, but total PPPM costs for patients who discontinue was still higher compared with costs for those who remained on their index therapy (reinitiators, nonswitchers, and persistent). In the oral cohort, pre-switch PPPM costs for nonswitchers, patients who discontinue, and patients who switch were $2594, $1977, and $1785, respectively. For patients who discontinued and switched, post-switch costs were $1173 and $5397, respectively. Patients who switched to biologic therapies had higher costs ($1838 pre-switch; $5925 post-switch) than those who switched to another oral treatment ($1613 pre-switch; $3178 post-switch). Total PPPM costs averaged over 1 year from initiation and not split by pre- and post-switch costs for nonswitchers, patients who discontinued, and patients who switched were $2594, $1402, and $3956, respectively.
Figure 9. Cost analysis per-patient per-month per cohort level. A stacked bar chart depicting 12-month baseline costs, pre-switch, and post-switch/reinitiation/new initiation costs among nonswitchers, persistent, reinitiators, pure discontinuers, switchers, switch to biologic, and switch to oral treatment in the oral, biologic, and apremilast cohorts. Note: Per-patient per-month costs cannot be summed to estimate the total per-patient per-month cost of the 12-month treatment pattern.
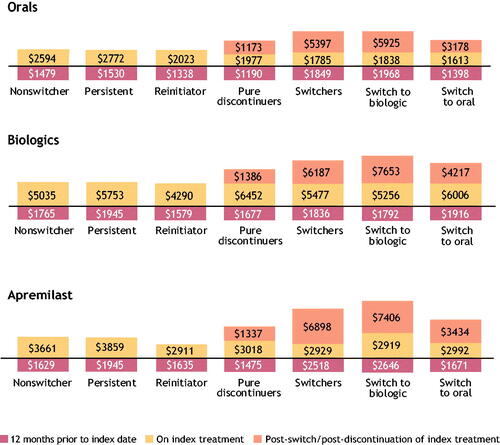
Similar patterns in cost were observed in the apremilast- and biologic-initiator cohorts. In the apremilast cohort, pre-switch PPPM costs for nonswitchers, patients who discontinued, and patients who switched were $3661, $3018, and $2929, respectively. For patients who discontinued and switched, post-switch costs were $1337 and $6898, respectively. Patients who switched to a biologic therapy had higher costs ($2919 pre-switch; $7406 post-switch) than those who switched to another oral treatment ($2992 pre-switch; $3434 post-switch).
In the biologic cohort, pre-switch PPPM costs in the biologic therapies cohort for nonswitchers, patients who discontinued, and patients who switched were $5035, $6452, and $5477, respectively. For patients who discontinued and switched, post-switch costs were $1386 and $6187, respectively. Patients who switched to another biologic therapy had higher costs ($5256 pre-switch; $7653 post-switch) than those who switched to an oral treatment ($6006 pre-switch; $34,217 post-switch). The switch from a biologic to an oral treatment was the only switch pattern in which costs were lower following the switch. Total PPPM costs averaged over 1 year from initiation and not split by pre- and post-switch costs for nonswitchers, patients who discontinued, and patients who switched were $5035, $3112, and $5833, respectively.
Dose escalation
Of the patients in the overall oral cohort who met the criteria for dose escalation analysis (n = 10,688), 3% had dose escalations that were 200% of the maintenance dose, and 6% of the methotrexate group doubled their dose after a mean of 65.8 days. Among the 3% of patients in the oral cohort who had dose escalations that were 150% of the maintenance dose, the methotrexate group again had the highest proportion, at 7%, with a median time to dose escalation of 21 days. Few patients (0.1%) in the apremilast group received 150% or 200% dose escalations. Dose escalation was more common among patients who received a biologic treatment (n = 7214); 8% had ≥200% dose escalations and 16% had ≥150% dose escalations. Among patients who received ustekinumab, 38% doubled their dose, followed by 14% of patients who received guselkumab. Among patients who experienced 150% dose escalations, etanercept patients represented the highest proportion, with 46%, followed by 39% of guselkumab patients and 38% of ustekinumab patients. The average time (in days) to 150% dose escalation for the etanercept (40.4), infliximab (41.0), and guselkumab (44.5) groups was shorter compared with those of other drug groups. Further information from the dose escalation analysis is provided in Supplemental Table S2.
Discussion
In this retrospective analysis of treatment patterns and costs for people with psoriasis in the United States, treatment persistence was low within the first year of starting a systemic therapy, but large variation was noted. Roughly one fourth of the oral (28%) and biologic (23%) treatment cohorts switched from their index therapy. The median time to switching was approximately 5.8 months in the biologic cohort and 4.2 months in the oral treatment cohort. Among patients receiving systemic treatment through 12 months who did not discontinue, 41% of oral initiators and 27% of biologic initiators switched treatment. This represents an unmet need for effective first-line treatments, particularly oral therapies. The study period spanned the years 2006 to 2019, when several new treatments for psoriasis gained approval. We noted that persistence improved in both cohorts during later years. This temporal pattern should be noted as the approval of more efficacious treatments in later years may have impacted our analyses (Citation22). Patients with psoriasis who switched therapies had higher costs after the switch, primarily attributable to increased pharmacy costs in the next line of treatment. Most patients who switched used a biologic therapy as their next-line treatment, and patients who switched to biologic therapies had greater monthly pharmacy costs and outpatient costs after the switch compared with those who continued their first systemic therapy for ≥1 year.
Dose escalations were more common with biologic treatments than with oral therapies (particularly apremilast); up to 16% of biologic cohort patients had doses increased by 50% above maintenance doses, and 8% of patients received twice the expected maintenance dose. By contrast, 2.9% and 2.7% of patients in the oral cohort received dose escalations of 150% and 200%, respectively. In the biologic cohort, 46% of patients who initiated treatment with etanercept had a dose escalation of 150%, while 38% of those initiating ustekinumab had a dose escalation of 200%. Dose escalations likely represent the undertreatment of this patient population and the impact that suboptimal treatment has on the patients’ experience.
The results of our study are in line with other recent studies examining treatment patterns, including switching and the costs of treating patients with psoriasis. Higa et al. (Citation23) examined psoriasis treatment patterns for all systemic therapies using the Truven IBM® MarketScan® databases (2014–2016) and found that approximately half of patients discontinued treatment with both oral and biologic treatments, but most restarted the same treatment (60% for oral and 80% for biologic treatments) (Citation23). This study also found that a greater proportion of patients switched from an oral treatment to a biologic than from a biologic to an oral treatment, which we hypothesize may be attributable to a preference for starting an oral medication before an injectable (Citation1,Citation23). A study of IQVIA PharMetrics® Plus–adjudicated claims data (2010–2015) also reported a substantial proportion of biologic-treated patients who switched or discontinued therapies, and these proportions increased with severity of disease (Citation15). Another retrospective study (2009–2012) utilized Medicare data from patients treated with biologic therapies and found that 38% were adherent, 46% discontinued treatment, 8% switched to another biologic, and 9% restarted on a biologic (Citation14).
Several of these claims studies have specifically examined costs associated with switching. Feldman et al. (Citation18) used the MarketScan® Commercial and Medicare Supplemental databases to examine the costs associated with switching or discontinuing biologic therapies (Citation18). During a 1-year follow-up period, this retrospective analysis found that patients with psoriasis who switched or discontinued biologic therapies incurred a higher economic burden than patients who were persistent with their initial treatment; driven primarily by an increase in prescription and direct medical costs. Kaplan et al. (Citation20) also used the MarketScan® databases (2011–2017) to evaluate treatment switching and the associated costs among initiators of biologic therapies or apremilast (Citation20). After 1 year, switch rates were 14% (for apremilast), 25% (for tumor necrosis factor inhibitors, i.e., adalimumab, certolizumab, etanercept, golimumab, and infliximab), and 11% (for interleukin inhibitors, i.e., ixekizumab, secukinumab, and ustekinumab), and healthcare costs were higher for those who switched versus nonswitchers. A similar study by Wu et al. (Citation21) used the Optum ClinformaticsTM claims database (2013–2016) and found that approximately one third of apremilast and biologic patients were persistent after 1 year of treatment, and nearly one quarter of biologic-treated patients switched medications compared with just over 20% of apremilast-treated patients. Costs were also higher among those who switched, regardless of their initial treatment.
The present study contributes new evidence to the literature on treatment patterns for medications used to treat psoriasis. This study considered multiple oral treatments within the oral therapy cohort, whereas most of the previous literature focused exclusively on apremilast. Reinitiation and discontinuation were evaluated separately; thus, we were able to more accurately characterize the rates and costs of true patients who switch versus reinitiate and discontinue. Furthermore, we captured cost data pre-switch and post-switch; thus, we were able to compare costs within treatment patterns at different phases of those patterns.
The present study’s strengths include the use of data from a large claims database covering all regions in the United States, providing a high level of diversity while representing the overall trends in the managed care setting. The data source is comprehensive and includes all patient medical and pharmacy claims. This allowed for longitudinal analysis of a large patient sample. The retrospective nature of the analysis captured real-world clinical practice compared with the controlled conditions of a clinical trial. This allowed for analysis of patients who are often underrepresented in clinical trials, such as those with comorbidities and the elderly.
As with all studies utilizing healthcare claims databases, there are limitations inherent to the use of claims data. Claims are submitted by healthcare providers to insurance companies for reimbursement. Such claims are subject to possible coding errors, coding for the purpose of rule-out rather than actual disease, and under-coding, without the possibility of verifying reported diagnoses. There was no information on psoriasis severity or reasons for switch or discontinuation provided in the claims data. Therefore, we could not characterize how severity impacts treatment patterns or if it was contributing to a reason for switching or discontinuing. In addition, the follow-up durations may not have been long enough to capture the development of a disease of interest after the index therapy. For the prescription fills and refills captured in the outpatient pharmacy claims data, it is uncertain whether patients actually administered these medications. Additionally, there was no information on prescription fills and refills for hospital pharmacies. Many of the biologic medications studied were relatively new to the market, and the index period end date of 31 December 2018, did not capture much use of the interleukin-23 inhibitors, i.e., risankizumab, guselkumab, and tildrakizumab. Future analyses of these newer biologic therapies are needed to more robustly assess their treatment patterns and costs. Finally, dose escalation analyses were limited to patients with complete information. We defined dose escalations per the US Food and Drug Administration–approved label; some dose increases were based on weight, which was approximated for patients.
In this study, notable differences were found in associated costs and treatment patterns. Almost one third of the patients discontinued oral therapy within a year. Persistence after 12 months of initiation of an index therapy was lower in the oral versus biologic cohort (40% vs. 62%, respectively). More patients in the oral cohort discontinued at 12 months versus those in the biologic cohort (32% vs. 15%, respectively) potentially raising concerns of undertreatment within the oral cohort. Pre- and post-switch costs were higher in the biologic cohort versus the oral cohort. Patients who advanced to a biologic and advanced treatment lines incurred higher treatment costs. Our results are in line with the findings of other real-world studies reporting higher costs associated with advancing treatment lines, higher costs after switching (with the exception of biologic users who switched to oral treatments), and low persistence with oral medications. There is a need for safe and effective oral options for patients with psoriasis to delay the switch to a biologic therapy.
Supplemental Material
Download PDF (243.7 KB)Acknowledgments
The authors thank Ann Wang, MA, of Bristol Myers Squibb for assistance with data analysis and results interpretation. Medical writing and editorial assistance was provided by Nicole Boyer, PhD, MPH, of Peloton Advantage, LLC, an OPEN Health company, and funded by Bristol Myers Squibb.
Disclosure statement
J.Z., Y.Z., Q.X., Y.B., and D.D. are employees and shareholders of Bristol Myers Squibb. X.C. was an employee and shareholder of Bristol Myers Squibb at the time of the study. S.T. was completing a fellowship in Worldwide Health Economics and Outcomes Research at Bristol Myers Squibb at the time of the study. L.P. is an employee of Mu Sigma, which has received consulting fees from Bristol Myers Squibb. J.J.W. is or has been an investigator, consultant, or speaker for AbbVie, Almirall, Amgen, Arcutis, Aristea Therapeutics, Bausch Health, Boehringer Ingelheim, Bristol Myers Squibb, Dermavant, DermTech, Dr. Reddy’s Laboratories, Eli Lilly, EPI Health, Galderma, Janssen, LEO Pharma, Mindera Health, Novartis, Pfizer, Regeneron, Samsung Bioepis, Sanofi Genzyme, Solius, Sun Pharmaceutical, UCB, and Zerigo Health.
Data availability statement
The Bristol Myers Squibb policy on data sharing may be found at https://www.bms.com/researchers-and-partners/independent-research/data-sharing-request-process.html.
Additional information
Funding
References
- Menter A, Strober BE, Kaplan DH, et al. Joint AAD-NPF guidelines of care for the management and treatment of psoriasis with biologics. J Am Acad Dermatol. 2019;80(4):1029–1072.
- Parisi R, Iskandar IYK, Kontopantelis E, et al. National, regional, and worldwide epidemiology of psoriasis: systematic analysis and modelling study. BMJ. 2020;369:m1590.
- Rachakonda TD, Schupp CW, Armstrong AW. Psoriasis prevalence among adults in the United States. J Am Acad Dermatol. 2014;70(3):512–516.
- Vanderpuye-Orgle J, Zhao Y, Lu J, et al. Evaluating the economic burden of psoriasis in the United States. J Am Acad Dermatol. 2015;72(6):961–967.e965.
- Brezinski EA, Dhillon JS, Armstrong AW. Economic burden of psoriasis in the United States: a systematic review. JAMA Dermatol. 2015;151(6):651–658.
- Schaefer CP, Cappelleri JC, Cheng R, et al. Health care resource use, productivity, and costs among patients with moderate to severe plaque psoriasis in the United States. J Am Acad Dermatol. 2015;73(4):585–593.e583.
- Menter A, Gottlieb A, Feldman SR, et al. Guidelines of care for the management of psoriasis and psoriatic arthritis: section 1. Overview of psoriasis and guidelines of care for the treatment of psoriasis with biologics. J Am Acad Dermatol. 2008;58(5):826–850.
- Wu JJ, Pelletier C, Ung B, et al. Real-world switch patterns and healthcare costs in biologic-naive psoriasis patients initiating apremilast or biologics. J Comp Eff Res. 2020;9(11):767–779.
- Kerdel F, Zaiac M. An evolution in switching therapy for psoriasis patients who fail to meet treatment goals. Dermatol Ther. 2015;28(6):390–403.
- Otezla [package insert]. Thousand Oaks, CA: Amgen Inc.; 2021.
- Karczewski J, Poniedziałek B, Rzymski P, et al. Factors affecting response to biologic treatment in psoriasis. Dermatol Ther. 2014;27(6):323–330.
- Feldman SR, Goffe B, Rice G, et al. The challenge of managing psoriasis: unmet medical needs and stakeholder perspectives. Am Health Drug Benefits. 2016;9(9):504–513.
- Feldman SR, Zhao Y, Navaratnam P, et al. Patterns of medication utilization and costs associated with the use of etanercept, adalimumab, and ustekinumab in the management of moderate-to-severe psoriasis. J Manag Care Spec Pharm. 2015;21(3):201–209.
- Doshi JA, Takeshita J, Pinto L, et al. Biologic therapy adherence, discontinuation, switching, and restarting among patients with psoriasis in the US Medicare population. J Am Acad Dermatol. 2016;74(6):1057–1065.e1054.
- Murage MJ, Anderson A, Casso D, et al. Treatment patterns, adherence, and persistence among psoriasis patients treated with biologics in a real-world setting, overall and by disease severity. J Dermatolog Treat. 2019;30(2):141–149.
- Wu JJ, Pelletier C, Ung B, et al. Treatment patterns and healthcare costs among biologic-naive patients initiating apremilast or biologics for the treatment of psoriatic arthritis: results from a US claims analysis. Curr Med Res Opin. 2020;36(1):169–176.
- Foster SA, Zhu B, Guo J, et al. Patient characteristics, health care resource utilization, and costs associated with treatment-regimen failure with biologics in the treatment of psoriasis. J Manag Care Spec Pharm. 2016;22(4):396–405.
- Feldman SR, Tian H, Wang X, et al. Health care utilization and cost associated with biologic treatment patterns among patients with moderate to severe psoriasis: analyses from a large U.S. claims database. J Manag Care Spec Pharm. 2018;25:479–488.
- Guerriero F, Orlando V, Monetti VM, et al. Biological therapy utilization, switching, and cost among patients with psoriasis: retrospective analysis of administrative databases in Southern Italy. Clinicoecon Outcomes Res. 2017;9:741–748.
- Kaplan DL, Ung BL, Pelletier C, et al. Switch rates and total cost of care associated with apremilast and biologic therapies in biologic-naive patients with plaque psoriasis. Clinicoecon Outcomes Res. 2020;12:369–377.
- Wu JJ, Pelletier C, Ung B, et al. Real-world treatment patterns and healthcare costs among biologic-naive patients initiating apremilast or biologics for the treatment of psoriasis. J Med Econ. 2019;22(4):365–371.
- Armstrong AW, Gordon KB, Menter MA, et al. The evolving landscape of psoriasis treatment. Semin Cutan Med Surg. 2018;37(2s):S39–s43.
- Higa S, Devine B, Patel V, et al. Psoriasis treatment patterns: a retrospective claims study. Curr Med Res Opin. 2019;35(10):1727–1733.