
Abstract
Objective
This study aimed to compare treatment patterns and healthcare costs for patients with psoriasis who initiate apremilast, tumor necrosis factor inhibitor, or interleukin inhibitor.
Methods
This retrospective cohort study used Optum Clinformatics® Data Mart to identify propensity score–matched patients initiating apremilast, tumor necrosis factor inhibitors, or interleukin inhibitors, with 12-month baseline and 24-month follow-up data. Switch, discontinuation, persistence, healthcare resource utilization, and total healthcare costs were assessed.
Results
Twenty-four-month switch rates were highest for tumor necrosis factor inhibitors (32%), followed by apremilast (21%) then interleukin inhibitors (14%). Mean (SD) per-patient-per-month costs for switchers were lowest for apremilast ($4213 [$2304]), higher for tumor necrosis factor inhibitors ($5274 [$2280]), and highest for interleukin inhibitors ($5539 [$2296]; p < .001), primarily attributable to pharmacy costs: $3466 (apremilast), $4432 (tumor necrosis factor inhibitor), and $4721 (interleukin inhibitor).
Limitations
Psoriasis severity is absent from claims data; cost outcomes may be influenced by more severe psoriasis being more costly.
Conclusion
Switching psoriasis treatment is common and increases over time. Apremilast initiators had lower switch rates and costs compared with tumor necrosis factor inhibitors, despite lower effectiveness reported in previous studies, perhaps indicating patient preference for oral treatment. Additional oral options may be desirable for this population.
Introduction
Psoriasis (PsO) is a chronic, systemic, immune-mediated, inflammatory skin disease that greatly impacts patients’ quality of life, even in cases of mild disease (Citation1). Symptoms include skin lesions or plaques, usually covered in scales, that cause itching, stinging, and pain (Citation2). Risks of cardiovascular disease, psoriatic arthritis, metabolic syndrome, depression, anxiety, and suicidality are greater in people with PsO, and risk increases with increasing PsO severity (Citation3,Citation4). Psoriasis affects at least 100 million individuals worldwide, with country-reported prevalence ranging between 0.09% and 11.43% (Citation2,Citation5,Citation6).
People with PsO commonly switch and/or discontinue treatments owing to adverse events, insufficient efficacy, declining efficacy over time, medical complications, affordability, or ‘drug holidays’ (Citation7–9). In a survey of adults with PsO, 88% reported a strong or moderate need for better therapies, while 52% reported that current therapies can be worse than the condition itself. Overall, only 31% of the patients surveyed reported that their primary goals of therapy were being met with their current treatment (Citation10). Switching treatments is an important driver of PsO-related healthcare costs, and thus, a substantial concern for payers as well (Citation11).
With the availability of treatment options, real-world evidence may offer data to patients and physicians beyond what is seen in a clinical trial. Treatment patterns may be indicative of patient and provider preferences because they are impacted by real-world factors such as access, costs, and effectiveness. Treatment switching may indicate if patients are responding to, tolerating, and affording their prescribed treatments (Citation11).
Previous studies have examined treatment patterns among apremilast versus biologic therapies (Citation8,Citation11,Citation12) in claims analysis; however, these studies were focused primarily on 12 months of follow-up through 2016 and may not fully represent the more recent systemic treatments available. To expand on the currently available literature, a longer follow-up may provide a more complete understanding of treatment patterns and costs in the real-world setting. The primary objective of this study was to compare treatment patterns and associated healthcare costs among patients with PsO not previously treated with biologics or apremilast, who initiate treatment with apremilast, a TNF inhibitor (TNFi), or an IL inhibitor (ILi).
Methods
Study design and data source
This was a retrospective cohort study that used the Optum Clinformatics® Data Mart (CDM) claims database from 1 July 2013, to 31 December 2020, to identify patients with PsO who newly initiated apremilast or biologics. Three cohorts were defined based on the initiation of: (1) apremilast; (2) a TNFi, which included infliximab, adalimumab, etanercept, certolizumab pegol; or (3) an ILi, which included ixekizumab, secukinumab, brodalumab, ustekinumab, guselkumab, tildrakizumab, and risankizumab. Although these ILi therapies have different mechanisms of action, they are often viewed by providers and payers as a singular category of biologics; hence, they were analyzed as a single group, creating a larger sample to ensure sufficient statistical power. No biosimilars were examined in this analysis.
Patients were identified from 1 July 2014, to 31 December 2019, (index period) to account for a 12-month baseline period and a 24-month follow-up period. The index date was the date of a patient’s first prescription of apremilast or biologic within the index period. Supplemental Figure 1 details the study period timelines.
This study was a retrospective claims-based cohort analysis that used de-identified patient records and did not involve the collection, use, or transmittal of individually identifiable data. Two authors had previously established, ongoing access to these data (GJ and CAW). Thus, institutional review board approval was not required. Claims databases are released periodically, and analytic completeness is verified through quality assurance procedures and routine audits. The analysis was inspected by external consultants for quality control purposes; further data cleaning was not required.
Study population
Adult patients aged ≥18 years on the index date were included in the analysis if they had at least two claims with a PsO diagnosis (at least 1 day apart) and at least one claim for apremilast or a biologic treatment during the identification period. Diagnosis codes are provided in Supplemental Table 1. Continuous medical and pharmacy enrollment for at least 12 months prior to and 24 months after the index date was required. Patients were excluded if they had received apremilast or biologics at any time prior to or initiated multiple systemic medications on the index date. Patients with a diagnosis of psoriatic arthritis, rheumatoid arthritis, ankylosing spondylitis, juvenile idiopathic arthritis, Beçhet’s disease, ulcerative colitis, or Crohn’s disease from the start of the study period to the end of follow-up were excluded. Diagnosis codes are provided in Supplemental Table 2.
Treatment pattern outcomes
For each cohort examined, the switch, discontinuation, and persistence rates were examined through 24 months of follow-up. The switch rate was defined as the cumulative proportion of patients who had a claim for a different study medication at any time. The discontinuation rate was the cumulative proportion of patients who did not refill the index treatment prescription within two times the days’ supply. Both treatment switch and treatment discontinuation events were considered to be treatment modification events. Persistence was defined as patients who continued index medication without any gaps exceeding two times the days’ supply.
Healthcare resource utilization and costs
Healthcare resource utilization (HCRU) was quantified as the total count of all-cause healthcare visits over the 24-month follow-up period. Total HCRU consisted of the total number of medical, inpatient, outpatient, emergency department, and pharmacy visits before and after switching treatment. Per-patient-per-month (PPPM) total HCRU and healthcare costs were reported before and after switching for each cohort.
Statistical analyses
Patient profiles were evaluated during the baseline periods for each study cohort. Descriptive patient baseline characteristics among the apremilast versus TNFi versus ILi cohorts were compared using a chi-square test for categorical variables and a Kruskal-Wallis test for continuous variables. Definitions for these variables are provided in Supplemental Table 3. A Fisher exact test was used when a chi-square test was not appropriate (e.g., when >20% have expected frequencies of <5). Patients were propensity score matched 1:1:1 to adjust for potential selection bias in the cohorts (diagnosis codes provided in Supplemental Table 4). A multinomial regression model was used to estimate the propensity score for patients controlling for age, gender, region, insurance type, index year, Charlson Comorbidity Index score (diagnosis codes in Supplemental Table 5), pre-index 12-month total healthcare costs, pre-index 12-month total HCRU, usage of topical medications, oral systemic drugs, or phototherapy prior to index, and the count of PsO agents during the baseline period. These results are considered adjusted (no unadjusted results), as propensity score matching was performed to select matched cohorts.
Switch, discontinuation, and persistence rates were calculated every 3 months during the 24-month follow-up period in the post-matched patient cohorts. Chi-square test was used to test for differences in switch and discontinuation rates, and Kaplan-Meier curves were plotted for persistence among the apremilast, TNFi, and ILi cohorts. Time to treatment modifications (i.e., time to switch or discontinuation) were reported as median and interquartile ranges. Note that the median time to switch was reported from the Kaplan-Meier analysis, which took censoring into consideration; the median number of days to switch was limited to a 24-month follow-up period, which did not include censoring, as all patients had at least 24 months of follow-up observation.
Total healthcare costs were calculated for all de-identified claims in the CDM database using Optum’s standard pricing methodology. The PPPM healthcare costs were the total sum of all-cause direct healthcare costs across 24 months of follow-up and normalized to monthly cost per patient. The maximum PPPM cost was top-capped at 99%. All costs were inflated to 2020 US dollars using the Consumer Price Index medical care component. Healthcare costs among the apremilast versus TNFi versus ILi cohorts were compared using a Chi-square test for categorical variables and Kruskal–Wallis test for continuous variables.
Results
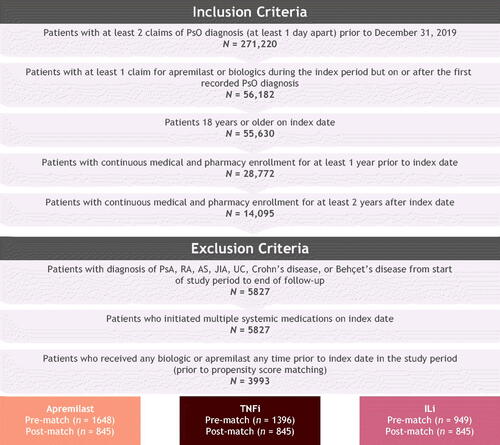
A total of 271,220 patients were identified with at least two claims of PsO diagnosis during the study period. After applying inclusion and exclusion criteria, 3993 patients were included in the switch, discontinuation, and persistence rates analysis. After propensity score matching, the final sample consisted of 2535 patients, with 845 in each of the cohorts ().
Figure 1. Patient attrition flow chart. AS: ankylosing spondylitis; Ili: interleukin inhibitor; JIA: juvenile idiopathic arthritis; PSA: psoriatic arthritis; PsO: psoriasis; RA: rheumatoid arthritis; TNFi: tumor necrosis factor inhibitor; UC: ulcerative colitis.
Patient demographic and clinical baseline characteristics post-matching are displayed in After matching, patients in each cohort were similar in all characteristics that were controlled for, except comorbidities such as other malignancies (lung, pharynx, liver, pancreas, breast, vulva, penis, bladder, kidney) where there were more observed in the apremilast cohort: apremilast (n = 20), TNFi (n = 5), ILi (n = 8); p = .003. The most common comorbidities within the three cohorts were hypertension and hyperlipidemia. Mean age (years) and sex were 49.5 (female, 44%), 49.6 (female, 46%), and 49.0 (female, 42%) for apremilast, TNFi, and ILi cohorts respectively.
Table 1. Baseline demographic and clinical characteristics post-propensity score matching.
Treatment patterns
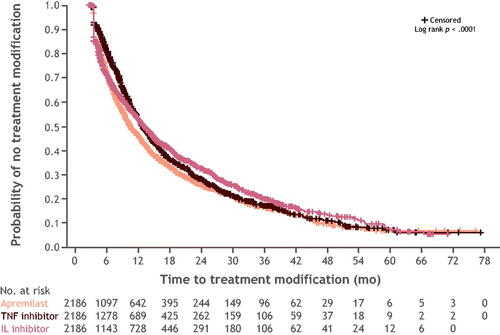
Switch rates did not differ significantly between cohorts at months 1 and 3; however, the rates did differ significantly in all subsequent follow-ups through 24 months. At 24 months, switch rates were highest in the cohort initiating with a TNFi (32%), followed by apremilast (21%), and ILi (14%) (). Among patients who switched, most switched to a medication with a different mechanism of action (Supplemental Table 6). The median and (interquartile range) of days-to-switch for apremilast, TNFi, and ILi were 281 (165–463); 290 (185–493); and 413.5 (215–531); p = .009, respectively. After discontinuing, more patients reinitiated ILi treatment (65%) than either apremilast (40%) or TNFi treatment (37%). Discontinuation rates differed significantly at all follow-up periods with the highest rate at 24 months in the apremilast cohort (59%), followed by the ILi (58%) and TNFi (42%) cohorts (Supplemental Figure 2). The median and (interquartile range) of days-to-discontinuation for apremilast, TNFi, and ILi were 125.5 (55–270.5); 168 (60–325); 106.5 (51–282); p = .001 respectively. Persistence rates differed significantly at all follow-up periods. Of the patients treated with apremilast, TNFi, and ILi, persistence with the same index treatment over the 24-month follow-up period was 21%, 25%, and 28%, respectively (Supplemental Figure 3). The Kaplan-Meier curve for persistence showed the highest probability of persistence observed for ILi, followed by TNFi, and apremilast (). Median time (months) to treatment modification for ILi, TNFi, and apremilast was 10.8, 10.6, and 8.1, respectively.
Figure 2. Switch rates over 24 months of follow-up. IL: interleukin; TNF: tumor necrosis factor.
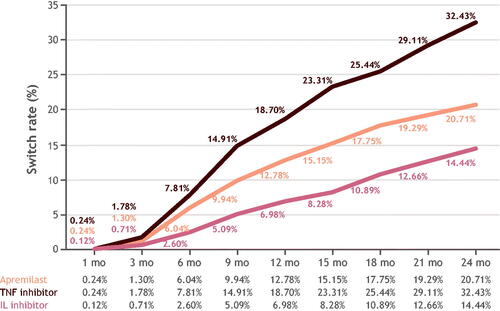
Figure 3. Kaplan–Meier curve for time to treatment modification in months, N = 6558. IL: interleukin; N/No.: number; TNF: tumor necrosis factor.
Costs and HCRU
Apremilast had the lowest mean (SD) PPPM costs overall during the 24-month follow-up period, $2840 ($2417), compared with biologics (TNFi, $4575 [$2458]; ILi, $4961 [$2741]; p < .001). Pharmacy costs were the main cost driver in these PPPM costs overall: $2107 (apremilast), $3788 (TNFi), $4128 (ILi). Patients who discontinued had the lowest PPPM costs within treatment cohorts. All PPPM costs were significantly different (p < .001) among the cohorts for those who switched, discontinued, or persisted with their initial PsO treatment. The mean (SD) PPPM costs among those who switched, discontinued, or persisted were lowest for apremilast ($4213 [$2304], $1994 [$2222], and $3872 [$1997], respectively) followed by TNFi ($5274 [$2280], $3210 [$2178], $5970 [$1907], respectively) and highest for ILi ($5539 [$2296], $4089 [$2641], and $6453 [$2421], respectively).
Total PPPM HCRU in terms of total visits pre-switch versus post-switch was 3.49 vs 3.23, respectively, for apremilast, 3.71 vs 3.41, respectively), for TNFi, and 3.31 vs 4.01, respectively, for ILi, although none of these differences reached statistical significance (). Total PPPM healthcare costs pre-switch versus post-switch for apremilast were $2560 vs $6923, respectively, for TNFi were $5207 vs $7109, respectively, and for ILi were $5616 vs $8378, respectively ().
Table 2. HCRU and costs before and after switching during a 24-month follow-up perioda.
Discussion
The primary objective of this study was to compare treatment patterns and associated healthcare costs among patients with PsO, who initiated treatment with apremilast, a TNFi, or an ILi. At 24 months, switch rates were highest for the TNFi-treated group (32%), followed by the apremilast- (21%), and ILi- (14%) treated groups. Apremilast had the lowest PPPM costs overall versus biologics (p < .001). This was primarily due to outpatient pharmacy costs of the index treatment. For all index treatments, pre-switch costs are lower than post-switch costs among patients who switched.
Broadly, the results of our study align with previously published studies analyzing claims data. Kaplan et al. (Citation11) similarly assessed treatment switch rates and costs among biologic-naive patients with PsO in apremilast, TNFi, and ILi propensity-score-matched cohorts. Key differences were that this study used IBM MarketScan Commercial and Medicare supplemental databases, focused primarily on 12-month switch rates and costs, and used pairwise comparisons when reporting switch rates and costs. Switch rates observed in that study showed similar trends to those reported herein (Citation11), with switch rates highest for TNFi followed by apremilast and ILi initiators. Similarly, the same trend was observed for total PPPM healthcare costs as we reported, where the lowest costs were seen in the apremilast group, compared with TNFi and ILi ($2834 vs $4662 and $5366, respectively both p < .05) (Citation11). Other studies did not report the breakdown of biologics; however, they too report that those who initiate apremilast had a lower total healthcare cost compared with those treated with biologic therapy (Citation8,Citation12). Combination therapy, whereby a concomitant systemic (rescue therapy) is started to avoid switching to another biologic, is less well studied (Citation13). Recent findings from a retrospective observational study of patients who underwent combination therapy for a secondary secukinumab failure resulted in re-achieving and maintaining PASI 75 without switching to another biologic (Citation13). Our study did not examine combination therapy, but future research could add to this growing body of knowledge.
Our study differs from previous studies that did not differentiate biologics by their mechanism of action (Citation8,Citation12). For example, no significant differences in switch rates were found between apremilast and aggregated biologic groups at 12 months (Citation8,Citation12). Because we have observed differences in treatment patterns by biologic type, future analyses should continue to differentiate within a biologic cohort. While previous studies have focused on switch versus non-switch (Citation8,Citation11,Citation12), this study examined non-switching further by assessing overall discontinuation and persistence with index medication. Our study found a large proportion of patients who did not switch discontinued their index treatment. Treatment pattern data and associated costs provide important practical application information for healthcare providers, payers, and policy makers. In our cohort of patients with PsO, we observed that many patients switch, discontinue, and reinitiate treatment, which may indicate suboptimal treatment or intentional drug holidays. Intentional drug holidays may be more common in the ILi cohort owing to the superior efficacy of these agents, which could allow patients to take breaks when their PsO is controlled. This may potentially explain the higher discontinuation rates observed. This suggests a need for more cost-effective treatments on which patients with PsO can persist longer when medically advised.
This retrospective analysis was based on claims data, which are not generated for research purposes and may be subject to omissions, errors, or other differences in clinician or insurance practices. PsO severity is not available in the claims data. Cost outcomes observed may also be a result of disease severity with more severe PsO being more costly. The number of patients treated with newer ILi biologics (e.g., brodalumab, secukinumab, ixekizumab, or tildrakizumab) was small in our analysis cohort. This smaller sample may have impacted the ILi cohort results; a future update may be warranted as more claims for newer biologics become available. Patients with PsA were excluded during the study period as the aim of this study was to assess treatment patterns in patients with PsO. However, as PsA is an important comorbidity for PsO, future studies should retain patients with PsA in the follow-up period. Data presented herein may not represent the greater US population as it is limited to individuals with commercial or Medicare coverage.
Conclusions
This retrospective study showed that switching PsO treatment is common and increases over time. Apremilast treatment had lower switch rates compared with TNFi, despite lower effectiveness (reported elsewhere) (Citation14) and higher discontinuation rates in biologic-naive patients. For all agents, pre-switch costs were lower than post-switch costs, although apremilast had the lowest PPPM costs overall. Collectively, treatment pattern analysis and the resulting lower costs indicate the need for additional oral options.
Supplemental Material
Download PDF (408.2 KB)Acknowledgments
Professional medical writing and editorial assistance were provided by Nicole Boyer, MPH, PhD, of Peloton Advantage, LLC, an OPEN Health company, and funded by Bristol Myers Squibb.
Disclosure statement
J. J. W. is a former and/or current investigator, consultant, or speaker for AbbVie, Almirall, Amgen, Arcutis, Aristea Therapeutics, Bausch Health, Boehringer Ingelheim, Bristol Myers Squibb, Dermavant, DermTech, Dr. Reddy’s Laboratories, Eli Lilly, EPI Health, Galderma, Janssen, LEO Pharma, Mindera Health, Novartis, Pfizer, Regeneron, Samsung Bioepis, Sanofi Genzyme, Solius, Sun Pharmaceutical, UCB, and Zerigo Health. C. W. W., D. D., S. K., J. Z., M. S., V. P., and L.S. are employees of and shareholders in Bristol Myers Squibb. G. J. and M. M. are employees of Mu Sigma, which has received consulting fees from Bristol Myers Squibb.
Data availability statement
Data for these analyses were made available to the authors through third-party license from Optum Clinformatics® Data Mart, a commercial data provider in the United States. As such, the authors cannot make these data publicly available due to a data use agreement. Other researchers can access these data by purchasing a license through Optum Clinformatics® Data Mart. Inclusion criteria specified in the Methods section would allow other researchers to identify the same cohort of patients used for these analyses. Interested parties may see https://www.optum.com/business/life-sciences/real-world-data/claims-data.html for more information on Optum Clinformatics® Data Mart.
Additional information
Funding
References
- Damiani G, Bragazzi NL, Karimkhani Aksut C, et al. The global, regional, and national burden of psoriasis: results and insights from the global burden of disease. Front Med (Lausanne). 2021;8:743180.
- Global Report on Psoriasis. Switzerland: World Health Organization; 2016. Available from: https://apps.who.int/iris/bitstream/handle/10665/204417/9789241565189_eng.pdf.psoriasis?sequence=1. Accessed: February 6, 2023.
- Elmets CA, Korman NJ, Prater EF, et al. Joint AAD-NPF Guidelines of care for the management and treatment of psoriasis with topical therapy and alternative medicine modalities for psoriasis severity measures. J Am Acad Dermatol. 2021;84(2):432–470.
- Kurd SK, Troxel AB, Crits-Christoph P, et al. The risk of depression, anxiety, and suicidality in patients with psoriasis: a population-based cohort study. Arch Dermatol. 2010;146(8):891–895.
- Armstrong AW, Mehta MD, Schupp CW, et al. Psoriasis prevalence in adults in the United States. JAMA Dermatol. 2021;157(8):940–946.
- Liu J, Thatiparthi A, Martin A, et al. Prevalence of psoriasis among adults in the US 2009–2010 and 2013–2014 National Health and Nutrition Examination Surveys. J Am Acad Dermatol. 2021;84(3):767–769.
- Armstrong AW, Robertson AD, Wu J, et al. Undertreatment, treatment trends, and treatment dissatisfaction among patients with psoriasis and psoriatic arthritis in the United States: findings from the National Psoriasis Foundation surveys, 2003–2011. JAMA Dermatol. 2013;149(10):1180–1185.
- Wu JJ, Pelletier C, Ung B, et al. Real-world switch patterns and healthcare costs in biologic-naive psoriasis patients initiating apremilast or biologics. J Comp Eff Res. 2020;9(11):767–779.
- Schmitt-Egenolf M, Freilich J, Stelmaszuk-Zadykowicz NM, et al. Drug persistence of biologic treatments in psoriasis: a Swedish national population study. Dermatol Ther. 2021;11(6):2107–2121.
- Lebwohl MG, Kavanaugh A, Armstrong AW, et al. US perspectives in the management of psoriasis and psoriatic arthritis: patient and physician results from the population-based multinational assessment of psoriasis and psoriatic arthritis (MAPP) survey. Am J Clin Dermatol. 2016;17(1):87–97.
- Kaplan DL, Ung BL, Pelletier C, et al. Switch rates and total cost of care associated with apremilast and biologic therapies in biologic-naive patients with plaque psoriasis. Clinicoecon Outcomes Res. 2020;12:369–377.
- Wu JJ, Pelletier C, Ung B, et al. Real-world treatment patterns and healthcare costs among biologic-naive patients initiating apremilast or biologics for the treatment of psoriasis. J Med Econ. 2019;22(4):365–371.
- Damiani G, Odorici G, Pacifico A, et al. Secukinumab loss of efficacy is perfectly counteracted by the introduction of combination therapy (rescue therapy): data from a multicenter real-life study in a cohort of Italian psoriatic patients that avoided secukinumab switching. Pharmaceuticals (Basel). 2022;15(1):95.
- Armstrong AW, Puig L, Joshi A, et al. Comparison of biologics and oral treatments for plaque psoriasis: a meta-analysis. JAMA Dermatol. 2020;156(3):258–269.