
Abstract
Background
Psoriasis is a chronic skin disease, and topical sequential therapy with a combination of calcipotriol and calcipotriol betamethasone is currently approved topical treatment. However, the exact mechanism by which this treatment regimen relieves psoriasis is unknown.
Method
We assembled a cohort of 65 psoriasis patients and divided post-treatment cohort into responder group and non-responder group according to the Psoriasis Area Severity Index (PASI) score after 12-week treatment. We measured the expression levels of proteins in collected 130 serum samples using our in-depth proteomics platform with a data-independent acquisition mass spectrometer and antibody microarray. We performed bioinformatics analyses of the biologic processes and signaling pathways that were changed in the responder group and constructed a proteomics landscape of psoriasis pathogenesis response to treatment. We then validated the biomarkers of disease severity in an independent cohort of 88 samples using an enzyme-linked immunosorbent assay.
Results
We first identified 174 differentially expressed proteins (DEPs) for comparative analysis of proteins between responders and non-responders at baseline (p < 0.05). Then pathway analysis showed that the responders focused more on signaling molecules and interaction, complement and coagulation cascades, whereas the non-responders more on signal transduction and IL-17 signaling pathways. We further identified four candidate biomarkers (COLEC11, C1QA, BNC2, ITIH4) response to treatment. We also found 125 DEPs (p < 0.05) after treatment compared with before treatment in responder group. Pathway analysis showed an enrichment in pathways related to complement and coagulation cascades, phagosome, ECM-receptor interaction, cholesterol metabolism, vitamin digestion and absorption. CD14 was validated as potential biomarkers for the disease severity of psoriasis and treatment targets.
Conclusion
In this work, we analyzed the response to topical sequential therapy and finally identified four biomarkers. Additionally, we found that topical sequential therapy may alleviate psoriasis by regulating lipid metabolism and modulating the immune response by affecting the complement activation process.
Introduction
Psoriasis is a chronic skin disease characterized by disfiguring scaling and erythematous plaques that may be painful or often severely pruritic and may greatly affect patient’s quality of life (QOL) (Citation1). Psoriasis vulgaris (PV) is the most common form and is categorized as mild, moderate-to-severe according to the rules of ten (Citation2). About 70–80% of psoriasis patients suffer from mild-to-moderate disease that can be successfully controlled with topical treatments (Citation3). In moderate-to-severe cases, which are usually treated with UV or systemic anti-inflammatory or biological therapies, concomitant topical treatments can support the efficacy of systemic treatments (Citation4). Currently approved topical treatments include prescription medications such as corticosteroids, vitamin D derivatives, vitamin A derivatives (tazarotene), and anthralin (Citation5). Topical corticosteroids and vitamin D3 analogs are mainstay treatments (Citation6–8). Topical sequential therapy with a combination of calcipotriol and calcipotriol betamethasone was significantly superior to the use of each therapy alone from a pharmacoeconomic standpoint according to the Guidelines for the Treatment of PV (Citation9).
Calcipotriol (1,25-dihydroxyvitamin D3) is a synthetic calcitriol analog and the most active metabolite of vitamin D3. It binds to the vitamin D3 receptor (VDR) and then promotes the differentiation and inhibits the proliferation of keratinocytes, as well as suppressing cytokine production by T cells, dendritic cells, and keratinocytes (Citation10). Betamethasone dipropionate (BD) is a high-potency, synthetic corticosteroid. It acts on the intracellular glucocorticoid receptor, preventing the transcription of genes responsible for inflammation (Citation8,Citation11), suppresses the production of inflammatory cytokines and mediators of inflammation, causes vasoconstriction, and reduces keratinocyte hyperproliferation (Citation6). Although topical vitamin D analogs and corticosteroids are effective as monotherapy for some patients, a systematic review found that combination therapy with a topical corticosteroid is more effective than either treatment alone (Citation11). When combined, calcipotriol mitigates both the atrophy and decreased epidermal barrier integrity caused by corticosteroids, while corticosteroids minimize the irritative effects of calcipotriol (Citation12–14). Domestic and international studies (Citation15,Citation16) have shown that a sequential treatment regimen combining calcipotriol/betamethasone dipropionate ointment and calcipotriol ointment ensures an adequate course of calcipotriol/betamethasone dipropionate to exert its efficacy while reducing unnecessary prolonged dosing, reducing both the incidence of glucocorticoid adverse reactions and the unnecessary financial burden for patients. However, the exact mechanism by which this treatment regimen relieves psoriasis is not known.
Current clinical practice in psoriasis for diagnostics, prognostics, and determination of the therapeutic outcome relies mainly on clinical findings and routine laboratory tests that frequently involve invasive procedures (i.e., skin and tissue biopsies) are difficult to obtain. Therefore, it is critical to identify blood biomarkers to track disease activity in clinical trials and longitudinal studies. During the last two decades, proteomics has been widely applied to psoriasis to expand the knowledge of psoriatic pathogenesis and pathophysiology and to define novel biomarkers for diagnostics, prognostics, and monitoring treatment efficacy and drug-induced toxicities (Citation17). Further to dissecting the molecular pathology of psoriasis, proteomics also holds promise with respect to biomarkers of treatment response and new therapeutic target identification; both of which are notably insufficient in the psoriasis field. In our recent study, we developed an in-depth serum proteomics technology platform that enables the measurement of serological proteome in unprecedented depth (∼10 orders) and demonstrated that our methodology detected a large number of serum proteins associated with psoriasis disease and validated PI3 as a diagnostic biomarker for psoriasis in an independent clinical cohort (Citation18). We therefore choose to examine topical sequential therapy response by using our in-depth serum proteomics technology platform, aiming to identify signatures and cellular mechanisms of therapy response.
Materials and methods
Clinical samples
The topical sequential therapy was administrated simultaneously in all eligible patients from Guangdong Provincial Hospital of Chinese Medicine (ChiCTR-TRC-13003233) by using calcipotriol betamethasone ointment once daily in the first 4 weeks (maximum of 100 g weekly), followed by calcipotriol ointment once daily for the remaining 8 weeks (maximum of 100 g weekly). We followed the protocol with a patient diary to remind the patient of the medication and recorded it, and the exact amount of ointment distributed was based on the area of the rash, 2 palm areas per fingertip ointment. We then collected serum samples within a week before treatment and after treatment. We used same standard operating procedure for all samples. Serum was separated by low-speed centrifugation as soon as possible after the patient’s blood was drawn. All serum samples were divided into small amounts after processing and stored in the refrigerator at −80 °C. The Psoriasis Area Severity Index (PASI) is a validated instrument that enables clinicians to assess psoriasis disease severity (Citation17). PASI scores of 25,75 indicate a 25%,75% reduction in PASI score compared with baseline. Patients who achieved PASI 75 were responders, while those who didn’t achieve PASI 25 were non-responders at week 12. The study was approved by the ethical committees at the Beijing Proteome Research Center and Guangdong Provincial Hospital of Chinese Medicine, and performed according to the Declaration of Helsinki.
Measurement of psoriasis serum proteome using antibody microarrays
Biotin labeling
All serological proteins were labeled with biotin using the modified procedure as previously described (Citation18). Briefly, 10 μL serum were diluted with 90 μL filtered 1 PBS (pH 7.4) followed by 1 μL of NHS-PEG4-Biotin (20 g/L in DMSO) (Thermo Fisher Scientific, MA, USA). After incubating for 1 h at room temperature, excess biotin molecules were removed using a Bio-Spin column via centrifugation at 1000 g for 2 min. The collected biotinylated proteins were dissolved in 500 μL of PBS containing 5% milk (w/v) and stored at 4 °C.
Sera screening
Antibody microarrays were assembled into an incubation tray (PEPperPRINT, Heidelberg, Germany) and blocked with 500 μL 5% milk (w/v) for 1 h at room temperature. After removing the milk, the arrays were incubated with pre-labeled serum proteins for 1 h at room temperature. The slides were washed three times, 10 min per wash, with PBS containing 0.05% (w/v) Tween 20 (PBST). For detection, the arrays were incubated with 2 μg/mL streptavidin-PE for 1 h at room temperature in the dark and then washed three times with PBST. The slides were washed three times with ddH2O, 5 min per wash. After drying, the slide was scanned using the GenePix 4000 A microarray scanner (Molecular Devices, CA, USA). The fluorescent images were analyzed and the signal intensity was extracted using the GenePix Pro image analysis software (Molecular Devices, CA, USA).
Measurement of psoriasis serum proteome using DIA-MS
The peptide sample preparation and data-independent acquisition analysis were performed as previously described (Citation18). Briefly, 2 µL serum sample were diluted with lysis buffer containing 6 M urea (Sigma, USA). Next, the serum sample were reduced with 10 mM Dithiothreitol (DTT) at 37 °C for 60 min and then alkylated with 500 mM Iodoacetamide (IAA) at room temperature for 45 min in dark. The protein was sequentially digested with trypsin for 16 h at 37 °C. The tryptic peptides were acidified with 1% trifluoroacetic acid and desalted with a C18 desalination column according to the manufacturer’s protocol. The desalted peptide was dried under vacuum and dissolved in 20 μL of buffer containing 0.1% formic acid and 2% acetonitrile. The peptide concentration was measured by Nanoscan (Analytik Jena AG, Jena, Germany). 1.5 µg peptides were separated on a 30 min LC gradient using an analytical column (150 µm × 250 mm, 2 µm 200 Å C18 particles) and injected into QE-HF mass spectrometer (Q Exactive HF Hybrid Quadrupole OrbitrapTM, Thermo Fisher). The DIA acquisition scheme consisted of 45 fixed Windows ranging from 350 to 1500 m/z. The resolution distribution of MS1 and MS2 is 60000 and 30000, respectively. A Spectronaut Pulsar X 12.0 (Biognosys, Schlieren, Switzerland) was used for identification and quantification. Finally, peptides FDR and Proteins FDR were all set at 1% (FDR).
Validation of serum biomarkers by enzyme-linked immunosorbent assay
Candidate proteins were measured in the independent cohort using the following commercial enzyme-linked immunosorbent assay (ELISA) kits in accordance with the manufacturer’s instructions: CD14 (cluster of differentiation 14, RayBiotech, Georgia, USA), and FCAR (immunoglobulin alpha Fc receptor, RayBiotech, Georgia, USA).
Bioinformatics analysis
Functional annotation of serological proteins employed the STRING database (http://string.org/). The interaction network analysis of biological processes and signaling pathways used Cytoscape and ClueGO with a p-value cutoff < 0.05. Pathway analysis employed the Kyoto Encyclopedia Genes and Genomes (KEGG) (https://www.genome.jp/kegg/) database.
Statistical analysis
Statistical analysis was performed using R version 4.1.2 and Prism version 8.4.0. Missing values in SWATH-MS data and non-signal values in microarray data were replaced with the minimum of each sample such that the signals would not be zero. Quantitative analyses of DIA-MS and antibody microarray data were performed at the gene level. The differentially expressed proteins were identified using the t-test or the Mann–Whitney test with a p-value < 0.05 and p-value was adjusted by Benjamini-Hochberg (BH). Differentially expressed proteins by DIA and antibody microarray were first identified separately and then combined for further analysis. The Pearson or Spearman correlation coefficient was calculated between the protein levels and clinical characteristics. Raw ELISA data were processed using the ‘Four Parameter Logistic Curve’ online data analysis tool (MyAssays Ltd., http://www.myassays.com/four-parameter-logistic-curve.assay). The nonbiased hierarchical clustering analysis and biased hierarchical clustering analysis were performed using R package pheatmap. To integrate the DIA-MS and antibody microarray, data were scaled in the row direction so that all features were represented as z-scores. Principal components analysis (PCA) was plotted by Hiplot Pro(https://hiplot.com.cn/). The partial least squares discrimination analysis (PLS-DA) was performed using the ‘Wu Kong’ platform (https://www.omicsolution.com/wkomics/main/).
Results
Serum proteomic analysis of psoriasis response to topical sequential treatment combined with cal/BD and calcipotriol
Aiming to identify protein networks associated with response to topical sequential therapy, we assembled a cohort of 65 psoriasis patients (, ). The sex, age, BMI, and other clinical parameters are indicated in the heatmap (). We divided post-treatment cohort into two main groups of responders (n = 48) and non-responders (n = 17) according to PASI score (). After 12 weeks of treatment with topical sequential therapy, we collected 130 serum samples (included before treatment (PB] and after treatment [PA]) and performed proteomic analysis with DIA-MS and antibody arrays. Then we obtained the signature proteins of responder and non-responder group through differential protein analysis and bioinformatic analysis. We further explored the mechanism of response to treatment and got potential proteins by similarly (). The r correlations of array-to-array and slide-to-slide were 0.98 (Figure S1A). Then we analyzed the reproducibility of DIA-MS assay, in which the Pearson correlation of 31 duplicated samples was 0.98 (0.92–0.99) (Figure S1B). The distribution of all serum proteins detected on our in-depth proteomics platform was analyzed using the reference concentrations from the human plasma proteome database (http://www.plasmaproteomedatabase.org/). The results showed that the proteins detected by DIA-MS and antibody arrays ranged from 10° to 1011 pg/mL with a total of about 11 orders in dynamic range (). Overall, 936 non-redundant proteins were identified by our platform including 572 in DIA-MS and 520 in the antibody arrays (Figure S1C). The 520 proteins screened by the antibody array were classified as intercellular signal molecules, metabolite interconversion enzymes, protein modifying enzymes, protein-binding activity modulators, transmembrane signal receptors, transfer/carrier proteins, and defense/immunity proteins (). The 572 proteins identified by DIA-MS were mainly defense/immunity proteins, metabolite interconversion enzymes, protein modifying enzyme, protein-binding activity modulators, and transfer/carrier proteins (). These proteins included 423 therapeutic targets that are currently approved or undergoing research in ongoing clinical trials (Therapeutic Target Database, online at http://db.idrblab.net/ttd/) (). The functional annotations of these therapeutic targets indicate that these proteins belong to various diseases of blood vessel and autoimmune diseases, including retinopathy, cerebral ischemia, thrombosis, lupus erythematosus, psoriasis, and rheumatoid arthritis (). These results suggest that the serum proteins detected with our platform were closely associated with the occurrence and development of psoriasis.
Figure 1. Schematic overview of the whole study. (A) A framework for biomarker discovery in psoriasis treatment. (B) The study cohort included 65 psoriasis patients. Clinical parameters are indicated in the heatmap. (C) The skin photos of the responders and non-responders. PB means before treatment and PA means after treatment.
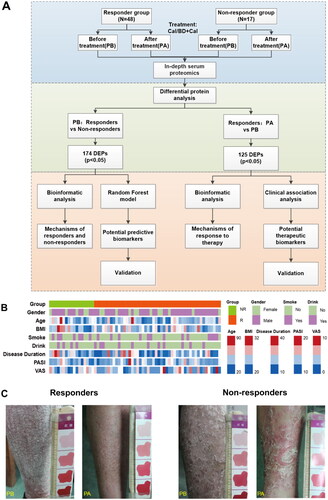
Figure 2. Profiling of serum proteome in responder and non-responder psoriasis patients using in-depth proteomics. (A) Distribution of serum proteins detected by in-depth proteomics according to the reference concentrations in the human plasma proteome database (http://www.plasmaproteomedatabase.org/). (B) and (C) Enrichment of protein classes for psoriasis-associated proteins identified by antibody arrays and DIA-MS, respectively. (D) Detected therapeutic target proteins, which were identified using a therapeutic target database (TTD) (http://db.idrblab.net/ttd/). (E) Diseases associated with the detected therapeutic target proteins. Circle sizes correspond to the number of proteins enriched in each disease.
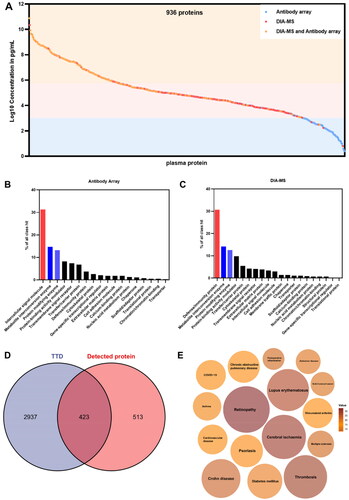
Table 1. baseline characteristics of study participants treated with topical sequential therapy.
Functional analysis of responders and non-responders to topical sequential therapy
We first applied a low stringency Wilcoxon rank-sum test for comparative analysis of proteins between responders and non-responders at baseline with a nominal p value cutoff (p-value < 0.05) and identified 174 differentially expressed proteins (DEPs) (), of which 74 were upregulated proteins and 100 were downregulated proteins. Unbiased clustering analysis showed that these 174 proteins could significantly distinguish between responders and non-responders (). The Gene Ontology (GO) enrichment analysis revealed that upregulated proteins were significantly enriched in cell migration and chemotaxis, complement activation, humoral immune response, plasma lipoprotein particle remodeling, and blood coagulation etc. biological process (), while downregulated proteins were enriched in cell migration and chemotaxis, immune response, lipid metabolism and inflammation response etc. biological process (). We then constructed proteomaps (Citation19) to cluster the DEPs according to the KEGG pathway annotations (, Figure S2). Although both the responder and non-responder groups were dominated by environmental information processing proteins, the responder group focused more on signaling molecules and interaction (lectins, neuroactive ligand-receptor interaction, and cell adhesion molecules [CAMs]) and the non-responders were more on signal transduction (mitogen-activated protein kinase [MAPK], and RAP1 signaling pathways).
Figure 3. Proteomic analysis predicts differential response to topical sequential therapy. (A) Identification of DEPs between responder and non-responder group at baseline using volcano plot analysis. The p-value indicated on the graph is 0.05. Upregulated and downregulated proteins are indicated in red and blue dots. (B) Classification of responder and non-responder groups based on differentially expressed proteins (DEPs) and unbiased clustering analysis. (C) and (D) are functional analysis of upregulated and downregulated DEPs identified by text mining using Cytoscape and ClueGO, respectively. A p-value < 0.05 was used for biological process selection. (E) Functional categories higher in responders (left) and non-responders (right), as illustrated by using Proteomaps. Each polygon corresponds to a single KEGG pathway, and the size correlates with the ratio between the groups.
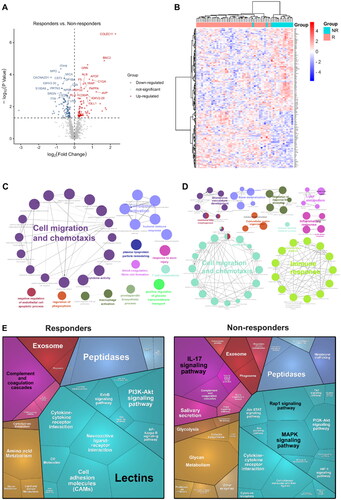
In addition, in the immune system, the responder group showed complement and coagulation cascades as the dominant, whereas non-responders were dominated by IL-17 signaling pathways.
Identification of protein markers of response to topical sequential therapy
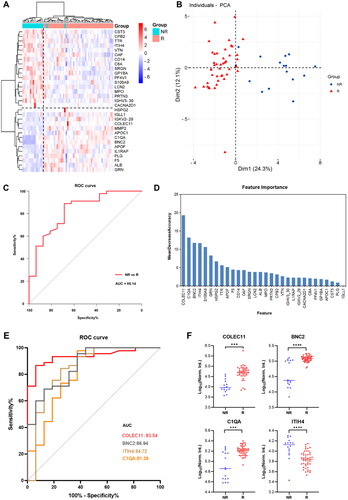
Aiming to reduce the broad pathway view to specific proteins and identify minimal protein signatures of response, we further obtained 30 DEPs by a adjusted p-value cutoff (p.adjust < 0.05). A heatmap of the 30 proteins discriminated responder and non-responder well (), and the proteins provided a clear separation between groups according to principal component analysis (). We then trained our data through random forest model, and the results showed that the receiver operating characteristics (ROCs) curves showed high predictive sensitivity and specificity, with an area under the curve (AUC) of 0.8514 (). We also assessed the importance of these 30 proteins in the model (), with AUC curves of 0.9354, 0.8694, 0.8472, and 0.8139 for the top 4 proteins (collectin-11[COLEC11], basonuclin 2[BNC2], inter-alpha-trypsin inhibitor heavy chain 4[ITIH4], complement C1q A chain[C1QA]), respectively (). Among of the top 4 proteins, COLEC11, BNC2 and C1QA were upregulated in responders compared to non-responders ().
Figure 4. Proteomic analysis predicts differential response to topical sequential therapy. (A) Classification of responder and non-responder group based on 30 DEPs (p.adjust < 0.05) and unbiased clustering analysis. (B) Principal component analysis plot shows unsupervised clustering among the 65 samples, demonstrating a distinction between responder and non-responder groups to topical sequential therapy. (C) Discrimination of psoriasis patients’ response to treatment by the DEPs using ROC curve analysis. (D) Ranking of the 30 proteins’ importance. (E) The AUC curves of the top 4 proteins (COLEC11, BNC2, ITIH4, C1QA) were 0.9354, 0.8694, 0.8472, and 0.8139, respectively. (F) Box plot analysis of COLEC11, BNC2, ITIH4 and C1QA in responder and non-responder group at baseline. The statistical analysis was performed using a Mann-Whitney U test with a p-value ≤ 0.05. *, ** and *** represent the p-value less than 0.05, 0.005 and 0.0005, respectively.
Proteomic analysis on the mechanisms of response to topical sequential therapy
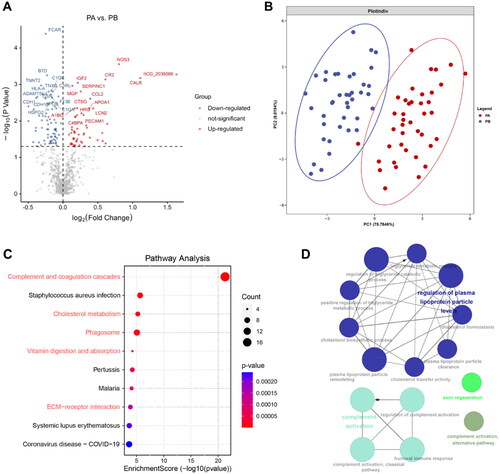
Aiming to reveal the mechanism of response to topical sequential therapy, we applied paired samples Wilcoxon rank-sum tests between PA and PB in responder group with a p-value cutoff (p < 0.05) and then found 125 DEPs (52 upregulated proteins and 73 downregulated proteins) detected by the in-depth proteomics platform (). These proteins provided a clear separation between groups according to partial least squares discriminant analysis (). We then constructed pathway analysis to the DEPs according to KEGG pathway database. This pathway analysis of 125 DEPs showed an enrichment (i.e., improvement) in pathways related to general immune response (complement and coagulation cascades, phagosome and ECM-receptor interaction [down]) and metabolism of proteins (cholesterol metabolism, vitamin digestion and absorption [down]) (, Figure S3A). We further investigated the downregulated DEPs using GO biological process (BP) and found that the proteins were involved in the regulation of plasma lipoprotein metabolism and complement activation, which were consistent with signaling pathways ().
Figure 5. Proteomic analysis on the mechanisms of response to topical sequential therapy. (A) Identification of DEPs between PA and PB in responder group using volcano plot analysis. The p-value indicated on the graph is 0.05. (B) Classification of PA and PB in responder group based on DEPs and partial least squares discriminant analysis. (C) Pathway enrichment analysis of DEPs using the KEGG database. (D) Is functional analysis of downregulated DEPs identified by text mining using Cytoscape and ClueGO. A p-value < 0.05 was used for biological process selection.
Identification of serum proteins related to psoriasis severity
To further demonstrate the clinical utility of our in-depth serum proteomics platform, we analyzed the correlations between clinical data () and serum proteins. Through the ten of top enriched signaling pathways, we obtained 42 core proteins (18 upregulated proteins and 24 downregulated proteins) ( and ). The PASI score is frequently used in the clinic to assess the severity of psoriasis and the treatment response. Among the 42 proteins, 15 were positively correlated with the PASI (Figure S4A). Ten proteins displayed a linear correlation with the PASI scores, namely, BTD, TNC, CD14, CFH, MASP1, COMP, TNXB, SERPINA1, CPB2 and NPC2 ( and Figure S4B). The expression of these proteins was downregulated after treatment, as indicated in the scatter plot in (see also Figure S4C). Among them, CD14 was also shown to be a potential protein marker to distinguish the response group from the non-response group (, Figure S3B).
Figure 6. Identification of serum proteins related to psoriasis severity. (A) KEGG enrichment analyses were carried out for the 42 core proteins, with p and q < 0.05. (B) The scatter plots show the correlations between BTD, TNC, CD14, CFH expression levels and PASI score (p < 0.05). Significance was tested using the pearson or spearman correlation coefficient. (C) Box plot analysis of BTD, TNC, CD14 and CFH downregulated in responder group after treatment. The statistical analysis was performed using a Mann-Whitney U test with a p-value ≤ 0.05. *, ** and *** represent the p-value less than 0.05, 0.005 and 0.0005, respectively. (D) The scatter plots show the correlations between FCAR, BTD, F13B, COMP expression levels and VAS score (p < 0.05). Significance was tested using the pearson or spearman correlation coefficient. (E) Box plot analysis of CD14 in responder group after treatment. (F) The scatter plots show the correlations between CD14 expression levels and PASI score (p < 0.05).
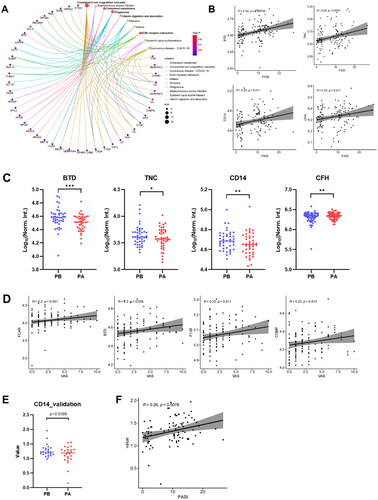
Table 2. clinical data of responder and non-responder at 0 week and 12 weeks.
Patients visual analog scale (VAS) is a method sometimes used to measure itch intensity to assess psoriasis severity and treatment benefit. We obtained 6 proteins displayed a linear correlation with the VAS scores (F13B, COMP, CR1L, C7, BTD and FCAR) ( and Figure S4D), and FCAR was one of them with an adjusted p-value of less than 0.05.
Next, we selected and validated 2 protein candidates (CD14 and FCAR) in an independent cohort composed of 88 samples with non-responder and responder group by using quantitative ELISA. The reduced serum level of CD14 was confirmed after treatment compared with before treatment (), as well as the correlation with disease severity ().
Discussion
Several targeted therapies and new modalities of treatment have been continuously developed according to the growing body of evidence for the pathogenesis of psoriasis. All of these new therapeutic strategies have the same ultimate goal to yield the highest efficacy with the least toxicity. Proteomics therefore can play role in monitoring treatment efficacy. Kolbinger et al. (Citation20) applied a targeted immunoproteomics approach to profile and quantify 170 proteins in skin and serum samples of eight psoriatic patients and eight healthy controls, before and after treatment with secukinumab (an anti-IL-17A monoclonal antibody), and found that β-defensin 2 may act as a biomarker of IL-17A-driven psoriasis pathology and predict response to anti-IL-17A treatment. Amy et al. (Citation21) evaluated the efficacy of the tumor necrosis factor (TNF) inhibitor etanercept in the treatment of 10 patients with severe psoriasis using a multi-omic study approach to identify treatment response signals in genes and pathways associated with TNF signaling, psoriasis pathology, and major histocompatibility complex regions, and found associations between clinical response and TNF-regulated genes in blood and skin. Topical treatment remains the main treatment for patients with psoriasis vulgaris, and there are no studies related to the application of proteomics to monitor the response to topical treatment. Our study presents a proteomic profile of 65 patients with psoriasis who received topical sequential therapy. More importantly our dataset may serve the scientific community as a resource for clinical proteomic data, which is still relatively scarce in psoriasis.
In this study, we showed by differential protein enrichment analysis of the responder and non-responder groups at baseline that the responder group was dominated by higher levels of lectins, neuroactive ligand-receptor interaction, CAMs and complement and coagulation cascades related proteins, while the non-responder group was dominated by MAPK, PI3-Akt, RAP1 and IL-17 signaling pathways related proteins, all of which play important roles in psoriasis (Citation22). These findings suggest that diverse causes of psoriasis necessitate distinct treatment approaches, and that response biomarkers could lead to more precision therapy of psoriasis patients.
Then, we further identified four predictive candidate biomarkers (COLEC11, BNC2, ITIH4, C1QA) of topical therapy. COLEC11 is a serum soluble protein that exists in complex with mannose-binding lectin-associated serine proteases (MASPs) and is involved in lectin activation, and in vitro it binds to microorganisms and apoptotic cells and activates complement via the MASPs pathway (Citation23). Complement activation includes the classical pathway, the alternative pathway, and the lectin pathway. The activation of complement plays a crucial role in the development and progression of psoriasis (Citation24). The role of complement activation and its activation products in psoriasis in the classical pathway is well recognized and has been widely used in clinical practice, while the role of the lectin pathway in psoriasis is not well understood. Previous studies have suggested that the lectin pathway may also be involved in complement activation in SLE, and that serum COLEC11 levels are significantly lower in SLE patients than in healthy controls, suggesting that COLEC11 may be associated with the development of SLE (Citation25). BNC2 is an extremely conserved homolog of the zinc finger protein basonuclin 1 (BNC1), which is specific to basal keratinocytes and germ cells. In keratinocytes, BNC1 behaves as a stem cell marker and is thought to be a transcription factor that maintains proliferative capacity and prevents terminal differentiation. Although the deduced amino acid sequences of BNC1 and BNC2 are only slightly >40% identical, BNC2 possesses all of the characteristic features of BNC1 described above (Citation26). ITIH4 is a poorly characterized serum protein that is proteolytically processed in multiple pathological conditions. Rasmus et al. showed that ITIH4 was cleaved by several human proteases within a protease-susceptible region, enabling ITIH4 to function as a protease inhibitor. This was exemplified by its inhibition of mannan-binding lectin–associated serine protease-1 (MASP-1), MASP-2, and plasma kallikrein, which were key proteases for intravascular host defense (Citation27). C1QA is the A-chain polypeptide of serum complement subcomponent C1q. C1q, composition of complement 1, recognizes and binds to immunoglobulin complexed to antigen and initiates the complement cascade (Citation28). The interaction of C1q with its receptor (CR-1) triggers various cellular responses, and these responses are suspected to involve certain signaling pathways in PsV (Citation29). Among the four proteins, serum COLEC11, BNC2 and C1QA levels were found to be significantly higher in the responder group, suggesting that COLEC11, BNC2 and C1QA may be associated with the innate immune response to psoriasis and affect drug efficacy, which requires further experimental verification.
Calcipotriol and BD both can inhibit the proliferation of keratinocytes and regulates steps in the immune response (Citation6,Citation8,Citation12,Citation30–32). Furthermore, corticosteroids and VDR agonists have opposing effects on the skin barrier (Citation33–35). Long-term topical corticosteroid used results in suppression of epidermal differentiation and depletion of stratum corneum intercellular lipids, which are important for maintaining barrier function (Citation34). Conversely, VDR agonists restore and maintain skin barrier function by promoting epidermal differentiation and lipid synthesis (Citation36). Our study showed that proteins involved in plasma lipoprotein metabolism process and complement activation were regulated in the responder group after 12 weeks of treatment. Evidence for bimodal immune activation in psoriasis is growing. Alternating waves of auto-inflammatory bursts of neutrophils coexist with T-cell driven auto-immune activation. Complement might be one of these factors linking innate auto-inflammatory and adaptive auto-immune responses in psoriasis (Citation24). Thus, these results suggest that topical sequential therapy alleviate psoriasis by regulating lipid metabolism and modulating the immune response by affecting the complement activation process.
There are limitations to our study. First, we lacked the proteomic analysis after 4 weeks of treatment, as the topical sequential therapy contained calcipotriol betamethasone for the first 4 weeks and calcipotriol ointment for the remaining 8 weeks. Then, there was no accurate data on medication adherence because the dosage of ointment was not well counted and some patients’ diary records were incomplete. Finally, all these DEPs do need to be validated by WB or ELISA, which is currently a large part of the workload and has not been done yet. Our team will continue to work on this in the future.
Conclusions
In this work, we analyzed the response to topical sequential therapy using an in-depth serum proteomics platform developed in our laboratory. We finally identified four biomarkers that showed better discrimination of the responder and non-responder, especially when they combined. Additionally, we found that topical sequential therapy may alleviate psoriasis by regulating lipid metabolism and modulating the immune response by affecting the complement activation process. Importantly, these findings may contribute to the understanding of resistance mechanisms to topical sequential therapy and the prognosis of those patients. Furthermore, the in-depth serum proteomics platform can be extended to the classification of other medicine in the future.
Author contributions
J. C. and X. Z. executed the array experiments, sample preparation and DIA-MS experiments; J. D., Y. Y., D. Y., H. D., J. Y. and S. Y. collected the serum samples and clinical information; J. C., and X. Z. executed the data analysis; C. L., L. H. and X. Y. designed and supervised all experiments and wrote the paper. All authors approved the final manuscript.
Supplemental Material
Download PDF (592 KB)Disclosure statement
The authors declare that they have no competing interests.
Data availability statement
The data that supporting the findings of this study are available on request from the corresponding author. The data are not publicly available due to privacy or ethical restrictions.
Additional information
Funding
References
- Menter A, Gottlieb A, Feldman SR, et al. Guidelines of care for the management of psoriasis and psoriatic arthritis: section 1. Overview of psoriasis and guidelines of care for the treatment of psoriasis with biologics. J Am Acad Dermatol. 2008;58(5):1–12.
- Mrowietz U, Kragballe K, Reich K, et al. Definition of treatment goals for moderate to severe psoriasis: a european consensus. Arch Dermatol Res. 2011;303(1):1–10.
- Boehncke WH, Schön MP. Psoriasis. Lancet. 2015;386(9997):983–994.
- Bagel J. Treat to target in psoriasis: a RealWorld experience with biologics and adjunctive topical therapy. J Drugs Dermatol. 2018;17:918.
- Paul C, Gallini A, Archier E, et al. Evidence-based recommendations on topical treatment and phototherapy of psoriasis: systematic review and expert opinion of a panel of dermatologists. J Eur Acad Dermatol Venereol. 2012;26(Suppl 3):1–10.
- Fenton C, Plosker GL. Calcipotriol/betamethasone dipropionate. Am J Clin Dermatol. 2004;5(6):463–478.
- Kragballe K, Van De Kerkhof P. Pooled safety analysis of calcipotriol plus betamethasone dipropionate gel for the treatment of psoriasis on the body and scalp. J Eur Acad Dermatol Venereol. 2014;28(Suppl 2):10–21.
- Elmets CA, Korman NJ, Prater EF, et al. Joint AAD-NPF guidelines of care for the management and treatment of psoriasis with topical therapy and alternative medicine modalities for psoriasis severity measures. J Am Acad Dermatol. 2021;84(2):432–470.
- Nast A, Boehncke WH, Mrowietz U, et al. S3 - Guidelines on the treatment of psoriasis vulgaris (english version). update. J Dtsch Dermatol Ges. 2012;10(Suppl 2): s 1–95.
- Lovato P, Norsgaard H, Tokura Y, et al. Calcipotriol and betamethasone dipropionate exert additive inhibitory efects on the cytokine expression of infammatory dendritic cell-T17 cell axis in psoriasis. J Dermatol Sci. 2016;81(3):153–164.
- Mason AR, Mason J, Cork M, et al. Topical treatments for chronic plaque psoriasis. Cochrane Database Syst Rev. 2013;(3):CD005028.
- Vakirlis E, Kastanis A, Ioannides D. Calcipotriol/betamethasone dipropionate in the treatment of psoriasis vulgaris. Ther Clin Risk Manag. 2008;4(1):141–148.
- Stein Gold LF. Topical therapies for psoriasis: improving management strategies and patient adherence. Semin Cutan Med Surg. 2016;35: s 36–44;quiz S45.
- Lequang JA. Updates in psoriasis management: based on selected presentations from maui derm 2020, january 25-29, 2020, maui, Hawaii. J Clin Aesthet Dermatol. 2020;13: s 1–S17.
- Saraceno R, Andreassi L, Ayala F. Efficacy, safety and quality of life of calcipotriol/betamethasone dipropionate (dovobet) versus calcipotriol (daivonex) in the treatment of psoriasis vulgaris: a randomized, multicentre, clinical trial. J Dermatolog Treat. 2007;18:36l–365.
- Wang B, Liu W, Sun L, et al. Sequential use of calcipotriol betamethasone cream and calcipotriol ointment for psoriasis. J Clin Dermatol. 2017;46:353–355.
- Thongboonkerd V. Proteomics. Forum Nutr. 2007;60:80–90.
- Meng X, Jingwen D, Kaikun X, et al. In-depth serum proteomics reveals biomarkers of psoriasis severity and response to traditional chinese medicine. Theranostics. 2019;9:2475–2488.
- Liebermeister W, Noor E, Flamholz A, et al. Visual account of protein investment in cellular functions. Proc Natl Acad Sci U S A. 2014;111(23):8488–8493. doi: 10.1073/pnas.1314810111.
- Kolbinger F, Loesche C, Valentin MA, et al. beta-Defensin 2 is a responsive biomarker of IL-17A-driven skin pathology in patients with psoriasis. J Allergy Clin Immunol. 2017;139(3):923–932.e8.
- Amy CF, David SW, Daniel FC, et al. A framework for Multi-Omic prediction of treatment response to biologic therapy for psoriasis. J Invest Dermatol. 2019;139:100–107.
- Amit KS, Tara CY, Harvinder KK, et al. Insights into interplay of immunopathophysiological events and molecular mechanistic Cascades in psoriasis and its associated comorbidities. J Autoimmun. 2021;118:102614.
- Peter G, Ninette G, Katrine P, et al. A journey through the lectin pathway of complement-MBL and beyond. Immunol Rev. 2016;274:74–97.
- Jenny G, Marc AJS, Martijn BAVD, et al. Complement activation in inflammatory skin diseases. Front Immunol. 2018;9:639.
- Troldborg A, Thiel S, Jensen L, et al. Collectin liver 1 and collectin kidney 1 and other complement-associated pattern recognition molecules in systemic lupus erythematosus. Clin Exp Immunol. 2015;182(2):132–138.
- Vanhoutteghem A, Djian P. Basonuclins 1 and 2, whose genes share a common origin, are proteins with widely different properties and functions. Proc Natl Acad Sci U S A. 2006;103(33):12423–12428.
- Rasmus P, Rasmus KJ, Emil CP, et al. ITIH4 acts as a protease inhibitor by a novel inhibitory mechanism. Sci Adv. 2021;7(2):eaba7381.
- Zhuoshuai L, Lingfeng P, Jikang S, et al. C1QA, C1QB, and GZMB are novel prognostic biomarkers of skin cutaneous melanoma relating tumor microenvironment. Sci Rep. 2022;12(1):20460.
- Reham H, Mervat H, Asmaa ME, et al. Immunoregulatory complement receptor-1 and leukocyte-associated Ig-like receptor-1 expression on leukocytes in Psoriasis vulgaris.
- Kin KC, Hill D, Feldman SR. Calcipotriene and betamethasone dipropionate for the topical treatment of plaque psoriasis. Expert Rev Clin Pharmacol. 2016;9(6):789–797.
- Dyring-Andersen B, Bonefeld CM, Bzorek M, et al. The vitamin D analogue calcipotriol reduces the frequency of CD8+ IL-17+ T cells in psoriasis lesions. Scand J Immunol. 2015;82(1):84–91.
- Haussler MR, Whitfield GK, Kaneko I, et al. Molecular mechanisms of vitamin D action. Calcif Tissue Int. 2013;92(2):77–98.
- Kao JS, Fluhr JW, Man MQ, et al. Short-term glucocorticoid treatment compromises both permeability barrier homeostasis and stratum corneum integrity: inhibition of epidermal lipid synthesis accounts for functional abnormalities. J Invest Dermatol. 2003;120(3):456–464.
- Sheu HM, Tai CL, Kuo KW, et al. Modulation of epidermal terminal differentiation in patients after long-term topical corticosteroids. J Dermatol. 1991;18(8):454–464.
- Orgaz-Molina J, Magro-Checa C, Rosales-Alexander JL, et al. Association of 25-hydroxyvitamin D serum levels and metabolic parameters in psoriatic patients with and without arthritis. J Am Acad Dermatol. 2013;69(6):938–946.
- Hong SP, Oh Y, Jung M, et al. Topical calcitriol restores the impairment of epidermal permeability and antimicrobial barriers induced by corticosteroids. Br J Dermatol. 2010;162(6):1251–1260.