
Abstract
Purpose: The RENEB accident exercise was carried out in order to train the RENEB participants in coordinating and managing potentially large data sets that would be generated in case of a major radiological event.
Materials and methods: Each participant was offered the possibility to activate the network by sending an alerting email about a simulated radiation emergency. The same participant had to collect, compile and report capacity, triage categorization and exposure scenario results obtained from all other participants. The exercise was performed over 27 weeks and involved the network consisting of 28 institutes: 21 RENEB members, four candidates and three non-RENEB partners.
Results: The duration of a single exercise never exceeded 10 days, while the response from the assisting laboratories never came later than within half a day. During each week of the exercise, around 4500 samples were reported by all service laboratories (SL) to be examined and 54 scenarios were coherently estimated by all laboratories (the standard deviation from the mean of all SL answers for a given scenario category and a set of data was not larger than 3 patient codes).
Conclusions: Each participant received training in both the role of a reference laboratory (activating the network) and of a service laboratory (responding to an activation request). The procedures in the case of radiological event were successfully established and tested.
Introduction
Radiation accidents occur under several different potential circumstances which may involve different numbers of people. Good examples are the Goiania Accident involving a few hundred people (Oliveira et al. Citation1991) and the Chernobyl (NEA Citation2002) and Fukushima (NERH Citation2011) nuclear accidents involving hundreds of thousands of people. Radiation incidents can also be caused deliberately, as a result of terrorist actions. The emergency consequences depend not only on the number of injuries and types of exposure, but also on the emergency management. In all cases preparedness for this kind of event is crucial. A large number of injured people will require many laboratories capable of providing assistance to the national emergency preparedness organization in the country where the accident occurred.
The RENEB project (Kulka et al. Citation2016) was launched in 2012 with the aim to establish a sustainable network in biological and physical-retrospective dosimetry that involves a large number of experienced laboratories throughout the European Union (EU). The network enables the activation of many laboratories immediately after a radiological emergency. Samples collected during an emergency can be sent to laboratories which are ready to give their assistance in provision of individual dose estimates. This possibility decreases the time for specification of doses, provided that all laboratories are prepared and trained. Moreover, reporting of dosimetric results must be organized in a consistent manner.
In addition to two inter-comparison exercises that were organized within the RENEB network and are described in this special issue, RENEB partners carried out an accident simulation exercise, where each laboratory had the chance to activate the network asking for assistance in handling a virtual emergency. The exercise involved sending dosimetric data sets that had to be interpreted by each laboratory in terms of an exposure scenario that was ascribed to each individual data set. A major aim was to train the RENEB participants in managing potentially large data sets that would be generated in case of a major radiological event. The outcome of this exercise is described in this manuscript.
Materials and methods
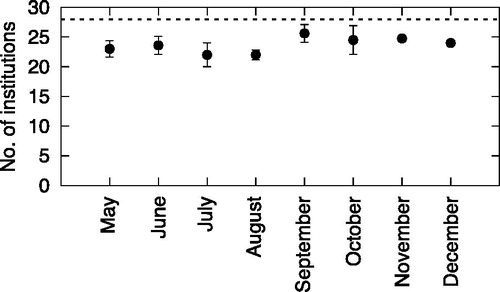
The exercise was launched on the 18 May 2015 and ended on 6 December 2015. There were 28 institutions participating in the exercise: 21 RENEB members, four candidates and three non-RENEB partners. Each participating laboratory (except for one, which chose not to activate) had seven days during which to activate the network, to collect and report the results. Hence, the exercise lasted for 27 weeks. The number of laboratories taking part in each exercise varied as shown in , but it was never below 64% of the total number of participants.
Figure 1. Average monthly number of institutions participating in the weekly RENEB accident simulation exercise. The error bars represent standard deviations counted for each month with the exception of December, when the exercise was performed only during the first week. Dashed horizontal line shows the total number of participating laboratories.
This was the first time a virtual exercise of this type has been organized on such a scale. Activation of the network was based on email exchanges only, because physical analyses of blood samples were already performed during two previous RENEB inter-comparisons (Wojcik et al. Citation2016).
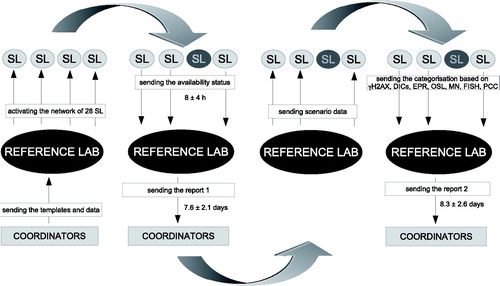
Two types of laboratories were defined: RL (reference laboratory) and SL (service laboratory). Each week a RL activated the network by sending emails to all SLs and asking them for assistance in analysing samples from exposed people. If a SL was available, a group member sent a response describing the capacity of the laboratory. Next, the RL sent a set of virtual samples to each available SL. Virtual samples were summarized in Excel files with individual dosimetric information from the assays implemented in RENEB. Each file included 54 patient codes with 10 doses estimated by the following assays: dicentrics (DIC), chromosome painting (FISH), micronuclei (MN), γH2AX, premature chromosome condensation (PCC), electron paramagnetic resonance (EPR) on mineral glass from smartphone touch screen and optically stimulated luminescence (OSL) on resistors from the electronic board of a mobile phone. The first five assays rely on analysing peripheral blood lymphocytes and the last two assays on analysing components of personal electronic devices (PED), such as smartphones. The assays are described elsewhere (Oestreicher et al. Citation2016; Barquinero et al. Citation2016; Depuydt et al. Citation2016; Moquet et al. Citation2016; Terzoudi et al. Citation2016; Trompier et al. Citation2016). An example of a dosimetric data set for 10 patients and the correct triage classification is shown in .
Table 1. An example of patient codes sent to a SL. Category refers to the following triage category: GREEN: <1 Gy, ORANGE: 1-2 Gy, RED: >2 Gy.
A SL received the doses only and its task was to classify each patient according to the following triage category: green - if a patient was exposed to doses less than 1 Gy; orange - for doses between 1 and 2 Gy; and red - if the exposure exceeded 2 Gy. Additionally, the SL was asked to estimate the exposure scenario based on the distribution of doses reported by each assay. For this purpose, nine scenarios were introduced and their brief description is shown in . The final decision about a scenario was based on combining the information from all assays. Here, the following characteristics of the assays were utilized: the γH2AX signal lasts for only 24 h and the OSL signal decreases by 50% after 10 days. EPR and OSL can give a dose evaluation consistent with the other assays when the PED is in the exposure beam. For PED positioned outside the beam, measured doses by EPR/OSL are set to a much smaller value than other assay. Thus, a significant difference of dosimetric results obtained by EPR and OSL from the other assays indicated partial body exposure.
Table 2. The various exposure scenarios that had to be ascribed to each dosimetric data set shown in Table 1.
In summary, the role of SL and RL is described and the information flow is shown in .
Figure 2. The scheme of a simulation exercise describing the role of SL and RL.
Results
The results are presented in three separate sections, each devoted to a distinct aim of the exercise: (1) to estimate the response time of RL and SL; (2) to estimate the capacity of each SL and (3) to train the accuracy of scenario categorization by each SL.
Response time
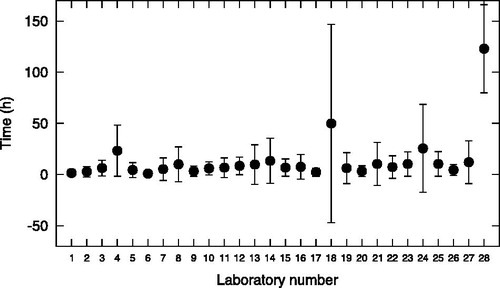
Each RL recorded the time of a SL response after the network activation. The results are presented in . The data points are calculated as the mean value for each SL during 27 virtual accidents. In the case of laboratories 1, 7, 10 and 19 the response time for confirming their ability to assist a RL was consistently short, which is evident by the very small standard deviation. There were also SLs that responded differently each time, such as laboratory 20. Possible reasons for a delay in replying are different time zones (RENEB partners from Uruguay and Canada), the type of laboratory (if it is a hospital then the priority is patient care and not the simulation exercise) or limited personnel. The average value of SL response time to a request issued by a RL was 8 ± 4 h.
Figure 3. Mean response time in hours for each SL. Error bars represent standard deviations.
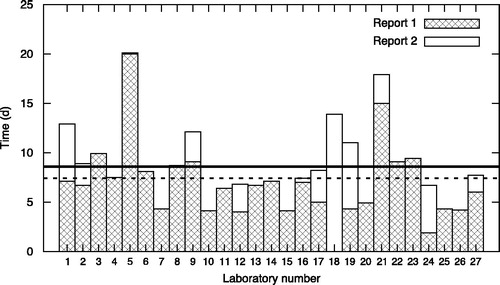
The responsibilities of the RL leaders or nominated individuals activating the network were also evaluated. They had to prepare two reports gathering data provided by each SL and to send them to the exercise coordinator. The first report included information about the SL capacity, discussed further in the Capacity section below. The second report was a combination of all SL triage estimations described in the Accuracy section. The mean time of sending the first report was 7.6 ± 2.1 days while the mean time of sending the second report was 8.3 ± 2.4 days (both average values are normally distributed). Thus, on average, the results from an accident were reported in less than 10 days. The time of response of each RL is shown in .
Figure 4. The time of sending reports 1 and 2 by each RL. The dashed line represents the mean time of receiving report 1; the solid line – of report 2.
Capacity
The first task of a SL was to send a reply to the RL confirming the availability to assist with sample analysis. The file sent by the SL also included information about the current laboratory capacity for analysing samples, expressed as number of samples. shows mean numbers of samples reported by all participating laboratories. Not all laboratories implement each assay, so information about the number of laboratories who stated their capability to perform a given test is also included in the table.
Table 3. Information about the declared average capacity of the SL to analyse samples by each assay. SD stands for standard deviation.
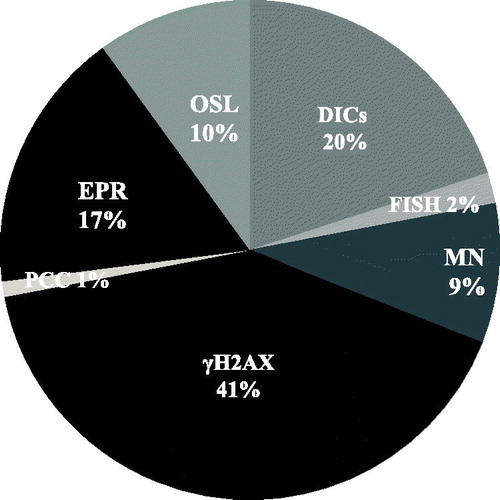
During the whole period of the exercise the SL declared a total capacity to analyse 122,115 samples, yielding an average value of 4520 ± 210 per week. The smallest number of samples was reported in June, July and August, which is correlated with the summer holidays. The percentage contribution of the given assay in analysing the samples is presented in . Over 40% of samples were declared to be analysed by the γH2AX assay, counted both manually and automatically. The highest number of SLs used the DIC assay, hence 20% of the samples would be measured by this assay. The smallest contribution came from the PCC assay, which is due to the relatively low number of laboratories and with a low capacity (not shown).
Figure 5. Distribution of RENEB assays in the declared capacity to perform triage. Information about manual and automated analyses was pooled.
Accuracy
If a SL decided to participate in the sample analysis, it received a file from the RL with patient codes. Each patient had to be allocated to the dosimetric triage category as green, orange or red and one of the nine different exposure scenarios had to be selected. Seven per cent of SLs did not return the filled out file with patient categorization, despite a positive reply to the initiating mail. This could be due to internet connection problems (reported on several occasions during the exercise), unexpected events requiring more people to be involved in the given institute or other reasons. There were also cases when the final reply from a SL was sent after the set deadline. In such cases the estimations were not included to assure the consistency of the established procedures.
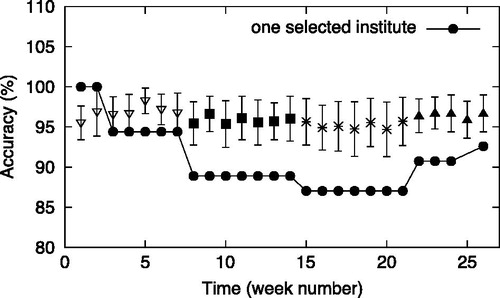
Although the 27 activation events were performed, for the accuracy analysis only 26 were used because one file was corrupted. In order to compare the SL responses, some default values were selected. These values cannot be regarded as absolutely correct because the categorical assignment of an exposure scenario to a set of doses is not possible. During the exercise, the set of doses and their order was changed every seven weeks (presented as distinct clusters in ). Accuracy was defined as the number of answers which were the same as the default values, divided by the number of all answers. The accuracy is shown as a function of time, where time is expressed in terms of the week number since the beginning of the exercise. demonstrates the high accuracy of triage categorization independently of the set of data. It is evident that the accuracy did not change during the period of seven weeks, when the same set of doses was repeatedly analysed. However, the results obtained by the chosen laboratory and compared to the overall data demonstrate different trends for different sets of scenarios. It can be related to the tool used for triage categorization, which is discussed in more detail in the next paragraph.
Figure 6. The accuracy of category estimation for all SLs compared with one selected institute. The data points with different shapes represent four different sets of patient codes. Error bars represent standard deviations.
Changing the set of data during the exercise was done in order to prevent automatization of the process of assigning a patient category and particular exposure scenarios to a given set of doses. The procedures of sample analysis by each SL were verified and are summarized in . In general, the procedures which were used by the SL can be divided into two main groups: A and B. Procedure ‘A’ represents the practice when a SL consistently used its own template prepared for analysis of the first set of data set until a new set of data was distributed (as is visible in the estimation results for the chosen laboratory in ). The tool could be either simply a sorted list of patient codes with the chosen scenario or a more sophisticated macro. Procedure ‘B’ describes the practice of an independent analysis of each distributed data set. In this case, patients were categorized without the use of any template and each new data set was treated as novel.
Table 4. SL procedures for the triage estimation.
The table shows that most people involved in the exercise in each laboratory discussed the categorization results for each data set before making the final decision. Almost 40% of SLs decided to prepare the script for an automated categorization and scenario estimation (A), while the rest analysed the weekly data independently, without any additional automated tools (B).
The accuracy for the triage estimation (as defined above) was calculated also for the exposure scenarios (separately for green, orange and red category). Based on the t-test no significant difference between those three scenario estimations was observed ().
Figure 7. Mean accuracy of each scenario assessment (green, orange and red). Error bars represent standard deviations.
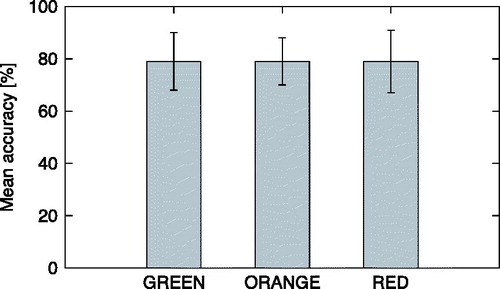
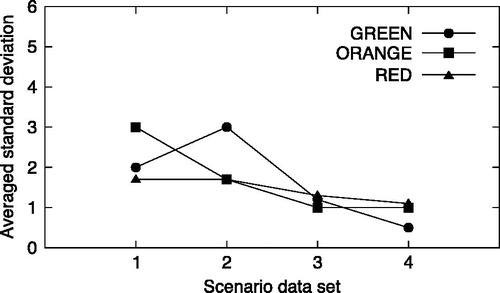
The level of accuracy was not as good as for that for triage categorization, but it stayed above 50% during all weeks. It was lowest for the first set of data (around 60%), but increased continuously with time (even up to 90% for red category). One of the ways to check how fast a SL learned to estimate patient codes is to see the standard deviations of the answers. This is shown in where standard deviations are plotted for four different sets of scenario data. A general decrease of the standard deviation value is evident.
Figure 8. Standard deviations of the scenario categorization for green, orange and red categories. All four sets of scenario data were considered.
Discussion
The accident exercise was carried out in order to train the RENEB participants in coordinating a response and managing potentially large data sets that would be generated in case of a major radiological event, but such types of exercises could be also a part of general radiological emergency training. Each participant was offered the possibility to activate the network by sending an alerting email about a fake radiation emergency. The same participant had to collect, compile and report the results obtained from all other participants. In this way each participant was trained in both the role of a RL (activating the network) and of a SL (responding to an activation). The repeated collection of information regarding the capacity of each lab gave important insights into the state of preparedness of EU biodosimetric laboratories over a period of 27 weeks.
The reaction time of the 28 participating SLs to an activating mail from a RL was never longer than 8 h, which is a very good time taking into account the number of laboratories and the global dimension of the network. Within 189 days more than 1400 patient codes were analysed and ascribed to a particular exposure scenario. On average, the RENEB capacity to carry out dosimetric triage in a single radiological emergency is 4520 patients, of which 40% would be analysed by the γH2AX assay, followed by the DIC assay. Some laboratories have the capability to perform different assays, but declared the capacity for a single assay. The correctness of the scenario estimation was considered for the presented analysis although these values cannot be regarded as absolutely correct. The ‘correct’ answer in any exposure scenario is subject to a large number of potential factors including whether any background information is available. The accuracy of the category and scenarios estimation was high and the progress of SL learning was visible, corroborating the usefulness of running these types of accident exercises for training purpose.
The time estimation in the presented simulation exercise is based on a few simplifications. Two important factors were not taken into account when comparing with real emergency management: sending the samples to the assisting laboratories and the analysis performed there using different assays. These factors were already tested during two inter-comparisons previously accomplished within the RENEB project. From those studies the average time needed for sharing the samples and performing different methods to estimate the absorbed doses was estimated to be between two and five days, depending on the assay. Activating the network and collecting the data should not vary much from the analysis presented in the simulation exercise, which is not longer than two days in total.
The results of the exercise described in this manuscript demonstrate that RENEB members are ready to respond in a coordinated manner to a large scale radiological emergency. Nevertheless the RENEB network still needs official recognition of international and national responsible organization in radiation emergency preparedness and response.
Disclosure statement
The authors declare no conflicts of interest.
Funding
This work was supported by the EU within the 7th Framework Programme [Grant Agreement No. 295513].
References
- Barquinero JF, Beinke C, Borràs M, Buraczewska I, Darroudi F, Gregoire E, Hristova R, Kulka U, Lindholm C, Moreno M, et al 2016. RENEB bio- dosimetry intercomparison analysing translocations by FISH. Int J Rad Biol. DOI:10.1080/09553002.2016.1222092 [In this issue].
- Depuydt J, Baeyens A, Barnard S, Beinke C, Benedek A, Beukes P, Buraczewska I, Darroudi F, De Sanctis S, Dominguez I, et al. 2016. RENEB intercomparison exercises analyzing micronuclei (Cytokinesis-block Micronucleus Assay). Int J Rad Biol. DOI:10.1080/09553002.2016.1206231 [In this issue].
- Kulka U, Abend M, Ainsbury E, Badie C, Barquinero JF, Barrios L, Beinke C, Bortolin E, Cucu A, De Amicis F, et al. Forthcoming 2016. RENEB – the European Network of biological dosimetry and physical retrospective dosimetry. Int J Rad Biol. [Submitted to this issue].
- Moquet J, Barnard S, Staynova A, Lindholm C, Monteiro Gil O, Martins V, Roeßler U, Vral A, Vandevoorde C, Wojewódzka M, Rothkamm K. 2016. The second gamma-H2AX assay inter-comparison exercise carried out in the framework of the European biodosimetry network (RENEB). Int J Rad Biol. DOI:10.1080/09553002.2016.1207822 [In this issue].
- NEA, Chernobyl-Assessment of Radiological and Health Impacts, 2002. Update of Chernobyl: Ten Years On Nuclear Energy Agency, Organization for Economic Co-operation and Development, Paris, France (2002).
- NERH, Report of Japanese Government to the IAEA Ministerial Conference on Nuclear Safety-The Accident at TEPCO's Fukushima Nuclear Power Stations (2011).
- Oestreicher U, Samaga D, Ainsbury E, Antunes AC, Baeyens A, Barrios L, Beinke C, Beukes P, Blakely WF, Cucu WF, et al. 2016. RENEB Intercomparisons applying the conventional Dicentric Assay (DCA). Int J Rad Biol. [Submitted to this issue].
- Oliveira AR, Valverde NJ, Brandão-Mello CE, Farina R. 1991. Medical and related aspects of the Goiania accident: an overview. Health Physics. 60:17–24.
- Terzoudi G, Pantelias G, Darroudi F, Barszczewska K, Buraczewska I, Depuydt J, Georgieva D, Hadjidekova V, Hatzi VI, Karachristou I, et al. 2016. Dose-assessment inter-comparisons within the RENEB network using G0-lymphocyte prematurely condensed chromosomes (PCC-assay). Int J Rad Biol. [Submitted to this issue].
- Trompier F, Burbidge C, Bassinet C, Baumann M, Bortolin E, De Angelis C, Eakins J, Della Monaca S, Fattibene P, Quattrini MC, et al. 2016. Overview of physical dosimetry methods for triage application inte- grated in the new European network RENEB. Int J Rad Biol. DOI:10.1080/09553002.2016.1221545 [In this issue].
- Wojcik A, Oestreicher U, Barrios L, Vral A, Terzoudi G, Ainsburry E, Rathkamm K, Trompier F, Kulka U. 2016. The RENEB operational basis: complement of established Biodosimetric Assays. Int J Rad Biol. [Submitted to this issue].