
Abstract
Purpose: In the framework of the ‘Realizing the European Network of Biodosimetry’ (RENEB) project, two intercomparison exercises were conducted to assess the suitability of an optimized version of the cytokinesis-block micronucleus assay, and to evaluate the capacity of a large laboratory network performing biodosimetry for radiation emergency triages. Twelve European institutions participated in the first exercise, and four non-RENEB labs were added in the second one.
Materials and methods: Irradiated blood samples were shipped to participating labs, whose task was to culture these samples and provide a blind dose estimate. Micronucleus analysis was performed by automated, semi-automated and manual procedures.
Results: The dose estimates provided by network laboratories were in good agreement with true administered doses. The most accurate estimates were reported for low dose points (≤ 0.94 Gy). For higher dose points (≥ 2.7 Gy) a larger variation in estimates was observed, though in the second exercise the number of acceptable estimates increased satisfactorily. Higher accuracy was achieved with the semi-automated method.
Conclusion: The results of the two exercises performed by our network demonstrate that the micronucleus assay is a useful tool for large-scale radiation emergencies, and can be successfully implemented within a large network of laboratories.
Introduction
Radiological emergencies in which a large number of victims are involved can occur as the result of different events such as radiation accidents, terrorist attacks with dirty bombs or other kinds of exposure to radioactive sources. In the event of large radiological accidents, an initial triage aimed at classifying victims according to the degree of exposure is indicated to guide appropriate clinical responses. In the framework of a previous EU FP7 project MultiBioDose, focusing on radiological emergencies, three triage categories were considered: a low dose category, for exposures to doses lower than 1 Gy, requiring no direct clinical treatment, a medium dose category, with doses ranging from 1–2 Gy, for which medical follow-up is necessary, and a high dose category, following exposure to doses higher than 2 Gy, for which urgent medical intervention is mandatory (Jaworska et al. Citation2015). Estimation of exposure to unknown radiation doses based on symptoms of the prodromal stage such as headache, nausea, diarrhea and others often result in misclassification of the victims, as those symptoms can also be psychogenic of origin as a consequence of anxiety or may be absent in spite of a significant exposure (International Atomic Energy Agency [IAEA] 2011). Thus, confirmation of the victim’s exposure status by means of biological dosimetry is necessary to complement clinical symptom evaluation (Voisin et al. Citation2001).
In the case of large scale accidents, involving thousands of victims, the capacity of a single biological dosimetry laboratory would be insufficient and the availability of a network of biodosimetry laboratories would be an important element to ensure the implementation of adequate emergency response strategies (Roy et al. Citation2007; Blakely et al. Citation2009). The aim of the RENEB (Realizing the European Network of Biodosimetry) project was to establish such a network of European laboratories that can ensure a harmonized performance of five biological dosimetry assays (the dicentric chromosome assay; the FISH-translocation assay; the micronucleus assay; the premature chromosome condensation assay; the gamma-H2AX assay) and two physical retrospective assays (electron paramagnetic resonance and optically stimulated luminescence) for individual dose assessment. Within the RENEB network, these assays have been further optimized through standardization of methods, training and inter-comparison exercises (Kulka et al. Citation2012, Citation2015).
The cytokinesis-block (CB) micronucleus (MN) assay, originally developed by Fenech and Morley in Citation1985, is a valuable biodosimetric tool for quantifying radiation-induced chromosomal damage for population triage thanks to the simplicity of MN scoring and the availability of automated MN analysis using microscopy-based (Schunck et al. Citation2004; Varga et al. Citation2004; Decordier et al. Citation2009; Willems et al. Citation2010) or flow cytometry-based methods (Rodrigues et al. Citation2016). Also a high throughput and miniaturized version of the CBMN assay for accelerated sample processing has recently been described (Lue et al. Citation2015). At present, several studies have confirmed the reliability of the automated MN assay for high throughput population triage (Willems et al. Citation2010; Romm et al. Citation2013; Thierens et al. Citation2014; Lue et al. Citation2015; Rodrigues et al. Citation2016, Wilkins et al. Citation2015).
In this paper the results of two intercomparison exercises performed within the RENEB network using the CB micronucleus assay are presented.
Materials and methods
Participating laboratories
Two separate intercomparison exercises (intercomparison 1, or IC1, and intercomparison 2, or IC2) were performed to assess the capacity of the RENEB network and the reliability and homogeneity of dose estimations resulting from the implementation of the CBMN assay. Twelve European institutions participated in the first intercomparison. The same labs were also involved in the second intercomparison with the exception of one lab that was replaced by another lab participating in RENEB (lab 8). In the second intercomparison also four new non-RENEB laboratories were included: two candidate EU labs, intending to join the network in the future, and two partners from outside the EU.
Set-up of the intercomparison (IC) exercises
For the intercomparison exercises blood samples were irradiated in vitro at the irradiation facility of one of the RENEB labs. Samples were then shipped to all partner labs for processing, blind scoring and triage dose assessment. Different exposure conditions (acute whole body, partial body) were simulated and the biodosimetry analysis was performed by automated, semi-automated or manual scoring of micronuclei. The second intercomparison took place after a period of 18 months following the first exercise. Based on the results obtained applying the different scoring methods in IC 1, areas requiring additional training were identified.
Irradiations and shipment of the blood samples
Blood samples were irradiated at one of the RENEB labs with Cs-137 gamma-rays (dose rate 0.478 Gy/min) at 37 °C and left for 2 h at 37 °C to allow repair. The first intercomparison exercise included four coded blood samples, covering four different doses/irradiation schemes, while the second intercomparison included only two coded blood samples. The participating laboratories received the information that the blood samples consisted of one sham-irradiated control, one low-dose specimen (0.94 Gy), one high-dose specimen (3.27 Gy) and one partial-body (PB) dose specimen (4.75 Gy PB; for this irradiated blood was mixed in a 1:1 ratio [50% irradiated blood volume]) in IC1. In IC2, one low-dose (0.85 Gy) and one high-dose specimen (2.7 Gy) were distributed to the participating organisations. The coded samples were shipped to all partners (12 laboratories in IC1 and 16 in IC2) according to packing instruction 650 for Biological Substances, Category B. In each package a temperature logger and dosimeter (glass dosimeter, Type SC-2), were also included. The minimum shipping temperature registered was 1 °C, the maximum temperature was 30 °C.
Cytokinesis-block (CB) micronucleus assay
Upon receipt of the blood samples, individual laboratories were requested to culture the coded blood specimens and analyze the samples according to their standard protocols and scoring criteria. Details about the MN protocols are summarized in . Each laboratory then provided a dose estimate for every sample using their own calibration curves. Laboratories already had existing calibration curves or they were generated just before the start of the exercises. Only one candidate EU lab reported having no calibration curve and intended to use an appropriate curve from the literature. The participants were asked to set up two separate cultures per dose point and to analyze two slides per culture. For the automated and semi-automated (which implies the visual inspection of MN-positive binucleate [BN] cells) analysis of DAPI-stained cells each laboratory was asked to score at least 1000 BN cells per slide. For the manual analysis of Giemsa-stained cells, 500 BN cells per slide were scored. Five laboratories performed both automated and semi-automated MN scoring using the Metafer platform (Metasystems, Altlussheim, Germany). These labs also participated in automated MN scoring for the FP7 MultiBioDose project and used the same MN protocol and established automated and semi-automated scoring procedure. The seven remaining laboratories performed the standard MN assay using their own in-house protocol and manual scoring procedures. During IC2, three additional laboratories (one RENEB lab and two non-RENEB partners) performed automated/semi-automated analysis and four non-RENEB partners performed manual micronucleus scoring.
Table 1. Variations in the standard protocols of the CBMN assay between the participating labs in intercomparison 1 and 2.
Results
MN dose-response curves
During IC1 the participants were asked to send to the coordinating laboratory the radiation characteristics and the coefficients of the linear-quadratic equation for their MN dose-response calibration curve(s) (). The MN calibration curves of the 12 labs are shown in : the graph includes five curves obtained with automated scoring (black curves: labs 1, 2, 4, 5 and 12); five curves obtained with semi-automated scoring (green curves: labs 1, 2, 4, 5 and 12) and seven curves obtained with manual scoring (blue/purple curves: labs 3, 6–11). Nine calibration curves were set up by exposing whole blood samples to Co-60 gamma-rays, two were set-up after exposure to Cs-137 gamma-rays (lab 1 and 9) and only one was obtained after exposure to X-rays (lab 8, IC1). In general, a large variation in the dose response curves was observed for all scoring methods. By means of a Chi-square test (Dose Estimate software), the homogeneity of the MN dose response curves reported by the different labs within each scoring group was analyzed. Among the different curves, inhomogeneity was revealed (p-values <0.001) and the level of inhomogeneity increased with increasing doses. The highest level of inhomogeneity was observed for the manual scoring method and may reflect the differences in MN protocols, radiation conditions and scoring criteria used by the different labs in this scoring group. The lowest level of inhomogeneity was obtained for the automated scoring group where a more standardized approach was applied.
Figure 1. Micronucleus calibration curves of the RENEB participating labs (L). Calibration curves are shown for automated (black lines), semi-automated (green lines) and manual (blue/purple lines) scoring methods. Labs 1, 2, 4, 5, 12 provided calibration curves for automated and semi-automated scoring. Labs 3, 6–11 provided calibration curves for manual micronucleus scoring. One calibration curve (L8) was set up for 200 kV X-rays, nine calibration curves were set up for Co-60 gamma-rays and two calibration curves (L1, L9) were set up for Cs-137 gamma-rays.
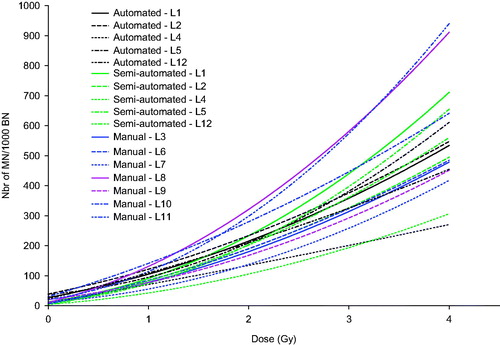
Table 2. Radiation characteristics and coefficients of the MN dose response curves of the RENEB labs.
MN yields obtained for the blood samples analyzed in IC1 and IC2
In and , the results of the CBMN assay (number of MN/1000 BN cells and total number of BN cells scored) obtained by all participating laboratories that analyzed the four blind samples provided in IC1 () and the two blind samples provided during IC2 () are summarized. The data in are grouped according to the applied scoring method; the mean MN values ± SEM (standard error of the mean) per dose point and per scoring method are also shown. In , the mean MN values are given separately for the participating RENEB labs alone as well as for all labs together (RENEB and non-RENEB). The results of lab 14 (a candidate EU lab) are not included as the yield of BN cells reported by this group was too low. Moreover, lab 14 had provided no MN calibration curve at the time of the exercise.
Table 3(a). Number of scored binucleate (BN) cells and observed micronucleus frequencies (micronuclei (MN)/1000 BN cells), stratified by scoring procedure for all labs participating in the first intercomparison. Mean MN frequencies ± SEM per scoring procedure are also presented.
From and it can be observed that there exists considerable inter-laboratory variation in MN yields irrespective of the scoring method adopted. In IC1, comparison of the mean MN scores obtained with the three different scoring methods for the sham-irradiated and low-dose sample, shows that the highest MN yields were obtained with the automated scoring method, while the semi-automated and manual method yielded comparable results. For the high-dose and the partial-body simulated sample, the manual scoring method yielded higher MN scores compared to the semi-automated and the automated scoring methods. This was also the case for the high-dose point in IC2. In general, the MN ranges were smaller with the semi-automated MN scoring method at all dose points.
Dose estimations
The MN scores resulting from the assessment of all samples were converted to dose estimates by the participants on the basis of the individual laboratories calibration curves using the software packages ‘Dose estimate_v5.1’ (Ainsbury and Lloyd Citation2010) or ‘CABAS v2.0’ (Deperas et al. Citation2007).
A first result in respect to the dose estimations is that all labs, when reporting their data to the coordinating partner, correctly classified which sample was the control, the low-dose, high-dose and partial-body dose.
In and , the individual estimated doses assessed in each laboratory are listed according to the different scoring procedures for the two intercomparison exercises. The mean dose estimates ± SEM per dose point and scoring method are also shown. In (IC1), mean values for the automated or semi-automated scoring methods are also calculated excluding the data of lab 4, as this lab reported overestimations for all the dose points. In (IC2), the mean dose estimates ± SEM are shown, including or excluding the non-RENEB partners.
Table 3(b). Number of scored binucleate (BN) cells and observed micronucleus frequencies (micronuclei (MN)/1000 BN cells), stratified by scoring procedure for all labs participating in the second intercomparison. Mean MN frequencies ± SEM per scoring procedure are also presented.
Table 4(a). Individual dose estimates reported by the laboratories participating in the first intercomparison exercise (laboratories: L1–L12), stratified by scoring procedure. Mean dose estimates ± SEM per scoring procedure are also presented.
Table 4(b). Individual dose estimates reported by the laboratories participating in the second intercomparison exercise (laboratories: L1–L16), stratified by scoring procedure. Mean dose estimates ± SEM per scoring procedure are also presented.
To investigate which dose estimates would be acceptable for triage, we used an uncertainty interval equal to 0.5 Gy for doses lower than 2.5 Gy and an uncertainty interval equal to a 20% deviation from the true dose for doses higher than 2.5 Gy. These uncertainty intervals have been reported for triage dosimetry using chromosomal aberrations (Lloyd et al. Citation2000; Romm et al. Citation2013). Accordingly, in this study we used the 0.5 Gy uncertainty intervals for the sham-irradiated and the low-dose samples (0.85 Gy, 0.94 Gy) and the 20% deviation from the true dose for the high-dose samples (2.7 Gy, 3.27 Gy and 4.75 Gy PB). The dose estimates that were unacceptable based on these uncertainty intervals are highlighted in grey in and .
, illustrates the dose estimates obtained during IC1. It shows that the number of acceptable dose estimates is high for the sham-irradiated (15/17 dose estimates, 88%) and low-dose sample of 0.94 Gy (15/17 dose estimates, 88%). For the high-dose sample the number of acceptable dose estimates is lower (8/17, 47%). The lowest number of acceptable dose estimates was obtained for the PB dose simulated sample (6/17 doses (35%) were correctly estimated). In IC2 (data shown in ) the accuracy of the dose estimates for the low-dose point of 0.85 Gy was in line with that of IC1, with 16/19 dose estimates (84%) lying within the defined triage confidence intervals. For the high-dose point of 2.7 Gy in IC2, the number of acceptable dose estimates increased compared to IC1: 14/19 (74%) vs. 8/17 (47%). When comparing the results obtained with the different scoring methods, it appears that in both intercomparison exercises semi-automated analysis, which implies the visual inspection of MN-positive BN cells, is the best method for triage purposes. In IC2, all dose estimates were correctly classified by the RENEB labs with the semi-automated method.
Two of the non-RENEB partners (lab 13, 15) reported results for the semi-automated and manual scoring method, while one lab (lab 16) only performed manual MN scoring. The non-RENEB partners reported satisfactory dose estimates for the low-dose point (4/5, 80%). The dose estimates for the high-dose point were however less accurate with only one out of five being correctly classified, although lab 15 received the samples 3 days after irradiation, it reported acceptable dose estimates for the 0.85 Gy dose with the two scoring methods used. For the high-dose point the dose estimates given by lab 15 were too high (outside the 20% uncertainly interval). The dose estimates reported by lab 16 were too high for both dose points.
Estimation of partial-body (PB) simulated dose
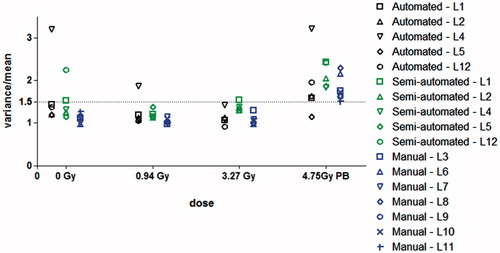
To identify the PB dose simulated sample, σ2/μ values calculated by Dose estimate and CABAS software were used. The software also allows calculating the estimated partial body dose and the fraction of the body irradiated. High values of σ2/μ (1.8–2.5) were taken as being indicative for PB dose irradiation with the MN assay (Thierens et al. Citation2014). In , the σ2/μ values are shown for the four dose points of IC1. Per dose point, the σ2/μ values are grouped per scoring method. For the PB simulated sample, σ2/μ ≥ 1.5 were obtained by all labs (except one) while for the whole body simulated samples, σ2/μ < 1.5 were obtained in 46 out of 51 measurements. Of these 46 measurements, only six values of σ2/μ were <1. The obtained partial body dose estimates were very variable (range: 2.28–7.89 Gy; excluding lab 4) with 9/15 (60%) (excluding lab 4) dose estimates being unacceptable based on the 20% deviation from the true dose (). For the fraction of the body irradiated a total mean value of 55% was obtained (50% automated; 49% semi-automated; 62% manual), with values ranging between 31 and 75%, excluding two outliers of 12 and 97%.
Figure 2. Variance/mean (σ2/μ) values, representing the overdispersion of the MN frequency distribution with respect to the Poisson distribution, are shown for the sham-irradiated control (0 Gy), the total body simulated (0.94 Gy, 3.27 Gy) and partial body (PB) simulated (4.75 Gy) exposures of the first intercomparison. Per dose point, the σ2/μ values are grouped per scoring method: automated scoring (black symbols), semi-automated scoring (green symbols), manual scoring (blue symbols). Values of σ2/μ ≥ 1.5 (dotted line) were taken as being indicative for partial body exposure.
Laboratory performances
To compare the lab performances in dose estimation the z-test was applied on the datasets from the IC1 and IC2 exercises. A z-score of the dose was calculated for each dose estimate obtained by the different scoring methods in order to classify the estimates provided by a single laboratory as satisfactory (| z | ≤ 2), questionable (2 < | z | < 3), or unsatisfactory (| z | ≥ 3) (IAEA Citation2011; Garcia et al. Citation2012; Romm et al. Citation2013). The results of this analysis are shown in . Most RENEB labs reported satisfactory results (| z | ≤ 2), with only seven out of 106 z-scores being questionable and one being unsatisfactory. Among the non-RENEB partners, two out of 10 z-scores were questionable and one z-score was unsatisfactory.
Figure 3. z-scores obtained in the first (a) and second (b) intercomparison exercise for the comparison of individual labs’ dose estimates with the true dose. The z-scores of all the participating labs are given for the different dose points and scoring methods [automated (black symbols), semi-automated (green symbols) or manual (blue symbols)]. Dose estimates are classified as satisfactory (| z | ≤ 2), questionable (2 < | z | < 3), and unsatisfactory (| z | ≥ 3).
![Figure 3. z-scores obtained in the first (a) and second (b) intercomparison exercise for the comparison of individual labs’ dose estimates with the true dose. The z-scores of all the participating labs are given for the different dose points and scoring methods [automated (black symbols), semi-automated (green symbols) or manual (blue symbols)]. Dose estimates are classified as satisfactory (| z | ≤ 2), questionable (2 < | z | < 3), and unsatisfactory (| z | ≥ 3).](/cms/asset/82b41ab5-4842-428c-9ec8-5b57a3660e4f/irab_a_1206231_f0003_c.jpg)
Number of slides/cells scored
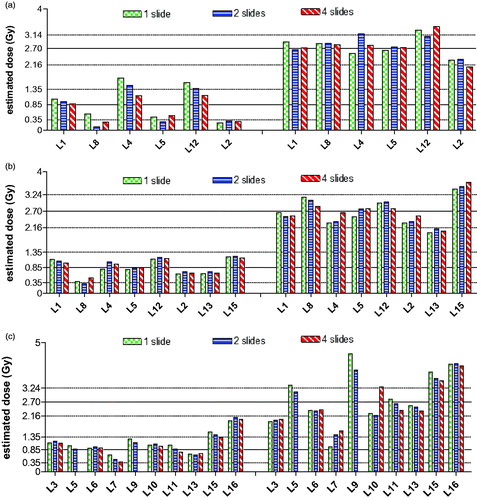
Since, in the framework of triage biodosimetry, the speed of reporting results is a crucial issue we investigated if there was a difference in the accuracy of the dose estimate when scoring MN on four, two or one slides. The results of this analysis are shown in ) for automated, semi-automated and manual analysis of the two blind samples from IC2. The distribution of dose estimates in the correct or incorrect triage category was not significantly different when four, two or one slides were scored (Chi-square test, all p values >0.44) and this was similar for all scoring methods. The time-to-score one slide takes approximately 10 minutes (min) in automated mode (= time to focus and scan the slide), 15 min in semi-automated mode (10 min to scan and about 5 min to check visually the BN cells with MN in the gallery display) and 30 min in manual mode (500 BN cells).
Figure 4. Comparison of the dose estimates obtained by scoring 1, 2 or 4 slides in automated (a), semi-automated (b) or manual mode (c). Dose estimations for the 0.85 Gy and the 2.70 Gy dose points are given for each lab. The dotted lines represent the uncertainty intervals.
Discussion
The intercomparison exercises performed by the RENEB network provided an opportunity to compare the accuracy in radiation dose estimation evaluated by means of the MN assay. This evaluation included a large number of participants (IC1, n = 12; IC2, n = 16), three different MN scoring methods, and two different exercises performed at an interval of 18 months. Recently many intercomparisons have been performed for triage biological dosimetry for the dicentric assay – the gold standard technique for biological dosimetry – a more limited number of intercomparison trials have been set up for the MN assay (Willems et al. Citation2010; Romm et al. Citation2013; Thierens et al. Citation2014; Wilkins et al. Citation2015). In most of these intercomparisons only a small number of labs were involved (2–6) and often only one scoring procedure, manual or automated, was investigated, without repetition of the exercise. Only in one Canadian study, annual intercomparisons have been conducted, although here the number of involved labs was small (three labs) (Wilkins et al. Citation2015). As the ultimate goal of RENEB was to specifically assess the competence and capacity of a large network with facilities of an international standard, including partners with different backgrounds (Universities, National Radiation Protection Institutes, Military centers, etc.) and expertise, the intercomparison exercises were primarily not conducted in ‘real time’. All labs, however, reported their results (MN scores and dose estimates) within a fixed deadline (±1 month) set by the coordinating laboratory.
Well-defined standard procedures for packaging, labeling and shipping of biological samples by air in Europe were set up in a previous program on biodosimetry (EU FP7 MulitBioDose project) that included five RENEB laboratories. The present, larger scale IC exercises, were also an excellent opportunity to re-test the efficiency of worldwide shipment of critical biological samples. The majority of shipments arrived on time (within 24 h) in IC1 and IC2 however, two labs received the blood samples with an extra delay of 24 (IC1: L12) or 48 h (IC2: L15). No problems with culturing were however reported. One lab did not receive the samples and new samples were sent.
To perform the blind dose estimation on the samples, each lab used its own MN calibration curve, because at the start of the project a large variation in calibration curves was observed for all scoring methods. As nine calibration curves were set up for Co-60 gamma-rays, two for Cs-137 gamma-rays and only one for X-rays, this set-up did not allow us to investigate if the differences in radiation physics parameters between Cs-137 gamma-rays, Co-60 gamma-rays and X-rays had an effect on the slopes of the MN dose response curve and on the dose estimation performed. One lab that reported unacceptable dose estimates for all blind samples during the first IC exercise (L4, ) made a new calibration curve and obtained acceptable dose estimates during the second IC exercise (). The largest inter-lab variations in MN dose response curves were seen for the manual micronucleus scoring method performed on Giemsa-stained slides. Such diversity may be related to slight differences in the individual MN protocols, to scoring criteria or to the quality of the microscope slides. An inter-lab comparison of MN slides and scoring criteria was conducted and revealed large variations in MN numbers scored on the same slide by different labs. These variations are related to the rigorousness in judging the slide quality and to the stringency applying the criteria for identifying binucleate cells and micronuclei. Differences in manual micronucleus scoring are often related to the following criteria: (i) binucleate cell or not, nuclei and micronuclei can touch/overlap; (ii) the staining intensity of the cytoplasm of the binucleate cell; (iii) size and staining intensity of micronuclei. For automated and semi-automated scoring the labs applied the same protocol and MN classifiers. Nevertheless, differences were still present. The experience with L4 that set up a new calibration curve in IC2, further pointed to the importance of strictly following the same procedure to process the slides for the calibration curve samples and for the blind samples. Besides using a standardized culture and fixation procedure, other steps appeared to be very critical, such as the time between cell fixation and the preparation of the slide. When cells are stored in fixative solutions for long periods (e.g. months) at 4 °C or −20 °C variable results can be obtained. Often the cells shrink, the nuclei become smaller and the cytoplasm is more darkly stained, making it more difficult to score micronuclei in Giemsa-stained cells. When performing automated scoring on DAPI-stained slides the classifier will select another class of BN cells (based on size) and in general less MN are detected, probably due to the fact that more MN may touch or overlap the main nuclei. Optimally, slides should be prepared and stained within few days after fixation. The time between staining of the slide with fluorescent DAPI-stain and scoring the slide should also be kept uniform. For instance, when slides are scanned immediately after staining, the full staining intensity is not yet reached and this can influence the results. One should wait about 1 h before scanning the slides.
From these findings we concluded that in a large network of labs, a reliable dose estimate will only be obtained when it is based on the individual lab’s calibration curve which is set up under the same conditions as the test sample. In the NATO and the Canadian intercomparison studies (Romm et al. Citation2013; Wilkins et al. Citation2015), the dose estimates were also based on the individual lab’s calibration curve and a wide variation in MN calibration curves was also reported in the NATO study (Romm et al. Citation2013). Only in the MultiBioDose study, where automated or semi-automated analysis was performed using the same automated system (Metafer 4, MNScore, Metasystems) and classifier, a common MN calibration curve was generated by averaging the data of four separate labs. With this common calibration curve reliable dose estimates were obtained (Thierens et al. Citation2014).
Wide inter-laboratory variations were also observed for the MN values of the blind dose samples. When grouping the MN values per scoring method, the highest MN values were in general obtained with the manual scoring method for the high-dose samples and PBD simulated sample (). Lower MN yields in the high-dose range, obtained when comparing automated with manual MN scores, were also observed by Willems et al. (Citation2010) and Varga et al. (Citation2004). Such an effect is presumed to be caused by more stringent scoring criteria for BN cells and MN implemented in automated systems.
In the sham-irradiated sample, higher MN yields were scored with the automated method, which has also been reported in previous studies (Willems et al. Citation2010; Baeyens et al. Citation2011; Thierens et al. Citation2014). The MultiBioDose study by Thierens et al. (Citation2014), analyzed spontaneous MN values in a population of 200 healthy individuals by automated and semi-automated scoring and mean MN values of 43 MN/1000 BN cells versus 13 MN/1000 BN cells were obtained, respectively. This drop in MN number, occurring in the semi-automated system after a visual check of the binucleate cell class with MN, can be attributed to manual correction for false positive MN, representing mainly background noise.
In the period of time between the two intercomparisons training was offered to those labs that wanted to re-establish or improve their competence in the MN assay. Only two labs (L6, L10) took this opportunity. Although there was an improvement in dose estimation in IC2 compared to IC1 for these two labs, the sample size was too small to draw any conclusions. To achieve a more uniform MN analysis, an online MN training survey, focusing on both semi-automated/automated (Metafer4, DAPI-stained cells) and manual (Giemsa-stained sells) MN scoring, was developed by the coordinating laboratory and made available on the RENEB website. To further harmonize the practices of the different labs in the RENEB network and minimize the discrepancies in the calculated doses a quality manual (QA & QM manual), based on ISO standards (Voisin et al. Citation2002), was produced within the RENEB project for the various biological and physical dosimetry techniques used in the network (Grégoire et al. Citation2016). Performance of the CBMN assay according to QA and QM procedures should guarantee more accurate and comparable dose estimates among the network partners irrespective of the labs’ specific MN protocol.
Although in this study a lot of variation was observed in the MN yields obtained with all scoring methods and for all dose points, the dose estimations obtained by using individual labs calibration curves and Dose estimate or CABAS software, were acceptably accurate. The best dose estimations were obtained for the sham-irradiated controls and the low-dose points. For the sham-irradiated controls, 88% of the dose estimates were classified correctly using the 0.5 Gy uncertainty interval for triage dosimetry. The low-dose points of 0.85 and 0.94 Gy showed dose estimates that were correct in 88% and 84% of cases, respectively.
With the high dose points, the percentages of correctly classified doses, using the 20% deviation from the true dose for triage dosimetry, was lower: 47% for the 3.27 Gy dose in IC1 and 74% for the 2.7 Gy dose in IC2. However, when using the triage categories defined in the MultiBioDose guidance (triage categories: low dose 0–1 Gy; medium dose: 1–2 Gy; high dose >2 Gy) (Jaworska et al. Citation2015), 15 out of 17 dose estimates (88%) were placed in the correct triage category for the high-dose point of 3.27 Gy in IC1, whereas for the 2.7 Gy dose in IC2, 23 out of 24 estimates (96%) were classified in the correct dose range category.
Low MN yields were obtained for the PB simulated dose sample, which was not unexpected. From previous studies performed in the framework of the MultiBioDose project it was shown that for heterogeneous exposed blood samples (>4 Gy) the MN yields drop due to radiation-induced proliferation inhibition in this dose range, resulting in low and unreliable dose estimates (Thierens et al. Citation2014). Although MN frequency distributions in general are overdispersed in respect to the Poisson distribution, yielding σ2/μ values >1 as was also observed in this study for the homogeneous irradiated samples, the study of Thierens et al. reported that high values of σ2/μ (1.8–2.5) can be used as an indicator for partial-body irradiation. In this intercomparison exercise all labs, except one, were able to identify the partial-body dose simulated sample based on a σ2/μ ≥ 1.5. According to Thierens et al. the use of the σ2/μ value in partial body exposures necessitates semi-automated scoring, as only in this scoring method can σ2/μ be determined with sufficient accuracy. In the present study values of σ2/μ ≥ 1.5 were obtained with all MN scoring methods. Using the triage categories defined in the MultiBioDose guidance, all dose estimate values for the PB dose sample were higher than 2 Gy and thus correctly classified in the high dose triage category. The mean value (%) that was calculated for the fraction of the body irradiated was 55%, which is very close to the experimental condition in which irradiated and non-irradiated blood was mixed in a 1:1 ratio (50%).
When comparing the accuracy of the three scoring methods, it was observed that for the sham-irradiated sample and the simulated acute whole body doses in IC1 and IC2, the semi-automated method, which implies the visual inspection of galleries of MN-positive binucleate cells, is the most accurate method for triage purposes, with 73% (in IC1) and 100% (88% when non-RENEB partners were included) (in IC2) correctly classified doses using the 0.5 Gy and 20% deviation from the true dose as uncertainty intervals. Also the mean dose estimate values in IC2, obtained by pooling the results of the participating labs, are nearest to the true doses and the SEM are smallest for the semi-automated scoring method ( and ). These findings are in agreement with those of the MultiBioDose study (Thierens et al. Citation2014) in which it was also shown that, compared to automated scoring, semi-automated scoring improves the accuracy of the dose estimation. In the NATO study (Romm et al. Citation2013), satisfactory results were obtained with all scoring methods, although the number of labs performing semi-automated analysis was very small (n = 2). Although the best results were obtained with the semi-automated scoring method in our study, acceptable mean dose estimates with small SEM were also obtained with both the automated and the manual scoring methods. These results indicate that all three scoring methods are suitable for triage biodosimetry.
In an emergency situation, dose estimates should be provided as soon as possible to support critical clinical decision making, and a high throughput scoring method is preferable for triage biodosimetry. Both automated and semi-automated scoring allows rapid and reproducible analysis. However, not all labs having expertise in biodosimetry are equipped with an automated system and manual scoring will also remain a widely used technique in the near future. In this context, specific strategies aimed at minimizing the number of BN cells to be scored should be adopted.
Currently the IAEA recommendation is to analyze 200 BN cells manually for the CBMN assay in triage mode, thus making MN evaluation comparable to the triage mode of dicentrics (McNamee et al. Citation2009; Flegal et al. Citation2010). Our results demonstrated that there is no significant difference in dose estimation accuracy when 2000 or 500 binucleate cells are manually scored.
Conclusion
The results of the two micronucleus intercomparison exercises performed by the RENEB network, demonstrate that the cytokinesis-block MN assay is a useful triage tool for large-scale radiation emergencies. In general, acceptable dose estimates were obtained by the RENEB partners for all three scoring methods adopted, although higher accuracy was achieved with the semi-automated method. The increase in the number of acceptable dose estimates in the second IC exercise compared to the first IC exercise further points to the need for a strong training program to refine the capacity of a biodosimetry network for existing and potentially new members. It also stresses the importance of performing regular intercomparison training exercises within a specialized biodosimetry network.
Acknowledgements
We wish to thank Ms. Toke Thiron, Johanna Aernoudt, Greet De Smet and Leen Pieters for their excellent technical assistance.
Disclosure statement
The authors report no conflicts of interest. The authors alone are response for the content and writing of the paper.
Funding
This work was supported by the EU within the 7th Framework Programme, grant number 295513 and by a University Development Cooperation ‘VLIR Own Initiative Programme’ between Belgium and South Africa (ZEIN2011PR387).
References
- Ainsbury EA, Lloyd DC. 2010. Dose estimation software for radiation biodosimetry. Health Phys. 98:290–295.
- Baeyens A, Swanson R, Herd O, Ainsbury E, Mabhengu T, Willem P, Thierens H, Slabbert JP, Vral A. 2011. A semi-automated micronucleus-centromere assay to assess low dose radiation exposure in human lymphocytes. Int J Radiat Biol. 87:923–931.
- Blakely WF, Carr Z, Chu MC, Dayal-Drager R, Fujimoto K, Hopmeir M, Kulka U, Lillis-Hearne P, Livingston GK, Lloyd DC, et al. 2009. WHO 1st consultation on the development of a global biodosimetry laboratories network for radiation emergencies (BioDoseNet). Radiat Res. 17:127–139.
- Decordier I, Papine A, Plas G, Roesems S, Vande Loock K, Moreno-Palomo J, Cemeli E, Anderson D, Fucic A, Marcos R, et al. 2009. Automated image analysis of cytokinesis-blocked micronuclei: an adapted protocol and a validated scoring procedure for biomonitoring. Mutagenesis. 24:85–93.
- Deperas J, Szluinska M, Deperas-Kaminska M, Edwards A, Lloyd D, Lindholm C, Romm H, Roy L, Moss R, Morand J, Wojcik A. 2007. CABAS: a freely available PC program for fitting calibration curves in chromosome aberration dosimetry. Radiat Protect Dosim. 124:115–123.
- Fenech M, Morley A. 1985. Measurement of micronuclei in lymphocytes. Mutat Res. 147:29–36.
- Flegal FN, Devantier Y, McNamee JP, Wilkins RC. 2010. Quickscan dicentric chromosome analysis for radiation biodosimetry. Health Phys. 98:276–281.
- Garcia O, Di Giorgio M, Vallerga MB, Radl A, Taja MR, Seoane A, De Luca J, Stuck Oliveira M, Valdivia P, Lamadrid AI, et al. 2012. Interlaboratory comparison of dicentric chromosome assay using electronically transmitted images. Radiat Protect Dosimetry. 154:18–25.
- Grégoire E, Ainsbury L, Barrios L, Bassinet C, Fattibene P, Kulka U, Oestreicher U, Pantelias G, Terzoudi G, Trompier F, et al. 2016. The harmonization process to set up and maintain an operational biological and physical retrospective dosimetry network: QA QM applied to the RENEB network. Int J Radiat Biol., in this issue. doi:10.1080/09553002.2016.1206232
- International Atomic Energy Agency (IAEA). 2011. Cytogenetic dosimetry: applications in preparedness for and response to radiation emergencies. EPR-Biodosimetry 2011. Vienna: IAEA. Available from: http://www-pub.iaea.org/MTCD/Publications/PDF/EPR-Biodosimetry%202011_web.pdf
- Jaworska A, Ainsbury E, Fattibene P, Lindholm C, Oestreicher U, Rothkamm K, Romm H, Thierens H, Trompier F, Voisin P, et al. 2015. Operational guidance for radiation emergency response organisations in Europe for using biodosimetric tools developed in EU MULTIBIODOSE project. Radiat Prot Dosimetry. 164:165–169.
- Kulka U, Ainsbury L, Atkinson M, Barquinero JF, Barrios L, Beinke C, Bognar G, Cucu A, Darroudi F, Fattibene P, et al. 2012. Realizing the European Network of Biodosimetry (RENEB). Radiat Protect Dosimetry. 151:621–625.
- Kulka U, Ainsbury L, Atkinson M, Barnard S, Smith R, Barquinero JF, Barrios L, Bassinet C, Beinke C, Cucu A, et al. 2015. Realizing the European network of biodosimetry: RENEB-status quo. Radiat Prot Dosimetry. 164:42–45.
- Lloyd DC, Edwards AA, Moquet JE, Guerrero-Carbajal YC. 2000. The role of cytogenetics in early triage of radiation casualties. Appl Radiat Isot. 52:1107–1112.
- Lue SW, Repin M, Mahnke R, Brenner DJ. 2015. Development of a high-throughput and miniaturized cytokinesis-block micronucleus assay for use as a biological dosimetry population triage tool. Radiat Res. 184:134–142.
- McNamee JP, Flegal FN, Greene HB, Marro L, Wilkins RC. 2009. Validation of the cytokinesis-block micronucleus (CBMN) assay for use as a triage biological dosimetry tool. Radiat Prot Dosimetry. 135:232–242.
- Rodrigues MA, Beaton-Green LA, Wilkins RC. 2016. Validation of the cytokinesis-block micronucleus assay using imaging flow cytometry for high throughput radiation biodosimetry. Health Phys. 110:29–36.
- Romm H, Barnard S, Boulay-Greene H, De Amicis A, De Sanctis S, Franco M, Herodin F, Jones A, Kulka U, Lista F, NATO biodosimetry study. 2013. Laboratory intercomparison of the cytokinesis-block micronucleus assay. Radiat Res. 180:120–128.
- Roy L, Roch-Lefèvre S, Vaurijoux A, Voisin PA, Voisin P. 2007. Optimization of cytogenetic procedures for population triage in case of a radiological emergency. Radiat Meas. 42:1143–1146.
- Schunck C, Johannes T, Varga D, Lörch T, Plesch A. 2004. New developments in automated cytogenetic imaging: unattended scoring of dicentric chromosomes, micronuclei, single cell gel electrophoresis, and fluorescence signals. Cytogen Genome Res. 104:383–389.
- Thierens H, Vral A, Vandevoorde C, Vandersickel V, de Gelder V, Romm H, Oestreicher U, Rothkamm K, Barnard S, Ainsbury E, et al. 2014. Is a semi-automated approach indicated in the application of the automated micronucleus assay for triage purposes? Radiat Prot Dosimetry. 159:87–94.
- Varga D, Johannes T, Jainta S, Schwarz-Boeger U, Kiechle M, Garcia BP, Vogel W. 2004. An automated scoring procedure for the micronucleus test by image analysis. Mutagenesis. 19:391–397.
- Voisin P, Benderitter M, Claraz M, Chamrette V, Sorokine-Durm L, Delbos M, Durand V, Leroy A, Paillole N. 2001. The cytogenetic dosimetry of recent accidental overexposure. Cell Mol Biol. 47:557–564.
- Voisin P, Barquinero F, Blakely B, Lindholm C, Lloyd D, Luccioni C, Miller S, Palitti F, Prasanna PGS, Stephan G, et al. 2002. Towards a standardization of biological dosimetry by cytogenetics. Cell Mol Biol (Noisy-le-grand) [Internet]. 48:501–504.
- Wilkins RC, Beaton-Green LA, Lachapelle S, Kutzner BC, Ferrarotto C, Chauhan V, Marro L, Livingston GK, Greene HB, Flegal FN. 2015. Evaluation of the annual Canadian biodosimetry network intercomparisons. Int J Radiat Biol. 91:443–451.
- Willems P, Liezel A, Slabbert J, Romm H, Oestreicher U, Thierens H, Vral A. 2010. Automated micronucleus (MN) scoring for population triage in case of large scale radiation events. Int J Radiat Biol. 86:2–11.