
Abstract
Purpose: This collaboration of five established European gene expression labs investigated the potential impact of culture conditions on the transcriptional response of peripheral blood to radiation exposure.
Materials and methods: Blood from one healthy donor was exposed ex vivo to a Cobalt 60 source to produce a calibration curve in addition to four unknown doses. After exposure, the blood samples were either diluted with RPMI medium or left untouched. After 24-h incubation at 37 °C the diluted blood samples were lysed, while the undiluted samples were mixed with the preservative RNALater and all samples were shipped frozen to the participating labs. Samples were processed by each lab using microarray (one lab) and QRT-PCR (four labs).
Results: We show that although culture conditions affect the total amount of RNA recovered (p < .0001) and its integrity (p < .0001), it does not significantly affect dose estimates (except for the true dose at 1.1 Gy). Most importantly, the different analysis approaches provide comparable mean absolute difference of estimated doses relative to the true doses (p = .9) and number of out of range (>0.5 Gy) measurements (p = .6).
Conclusion: This study confirms the robustness of gene expression as a method for biological dosimetry.
Introduction
In the past few years, gene expression exercises have illustrated the potential of gene expression for use in biodosimetry (Badie et al. Citation2013; Rothkamm et al. Citation2013; Abend et al. Citation2016). Dose assessment in irradiated blood samples can be obtained by either using dose predictive gene or exon signatures (Paul & Amundson Citation2008; Kabacik et al. Citation2011; Boldt et al. Citation2012; Knops et al. Citation2012; Lucas et al. Citation2014; Macaeva et al. Citation2016) or by monitoring the modification of transcription of single radiation-responsive genes like ferredoxin reductase (FDXR) (Manning et al. Citation2013; Abend et al. Citation2016).
The first gene expression intercomparison exercise of the Realising the European Network of Biodosimetry (RENEB) consortium involving four different European labs was performed using blood samples from five healthy donors using an ex vivo in vitro whole-blood cell culture model (Abend et al. Citation2016). It provided important information on methodological and inter-individual variance in gene expression for specific radiation-responsive genes. For patient blood collection, PAXgene tubes were used in which blood cells are lysed immediately, allowing intra-cellular RNA stabilization. The tubes are convenient for simple collection, transport, and storage of blood. During this exercise, dose estimates were provided by some of the participating labs within hours of receiving the samples with methodological variance among dose estimates being low (CV ≤10% for technical replicates).
After having produced robust calibration curves, the crucial question arose of how relevant the ex vivo generated gene expression data generated are to the in vivo data. Amundson et al. first measured in vivo responses in blood from patients undergoing total body irradiation and confirmed the transcriptional activation of several previously identified biomarker genes (Amundson et al. Citation2004). In the recent work by Abend et al. (Citation2016), the question of validity of an in vitro-constructed calibration curve for in vivo dose estimation was addressed by assessing the dose to the blood of prostate patients treated by radiotherapy. Dose estimates from radiotherapy-treated, locally exposed prostate cancer patients could completely discriminate exposed from unexposed samples. Nevertheless, all Ct-values obtained from in vivo blood samples were up to 7-fold below the unexposed ex vivo in vitro values of the calibration curve obtained by quantitative reverse transcriptase PCR (QRT-PCR) clearly indicating a discrepancy between in vivo and in vitro situations. It necessitated introducing an in vitro to in vivo correction factor which was lab dependent to provide the dose estimates.
In ex vivo studies, several protocols have been used such as cultured peripheral blood mononuclear cells (PBMC) (Dressman et al. Citation2007; Meadows et al. Citation2008, Citation2010; Sprung et al. Citation2011; Boldt et al. Citation2012; Knops et al. Citation2012; Riecke et al. Citation2012; Macaeva et al. Citation2016), cultured whole blood diluted with media (Badie et al. Citation2013; Brzoska and Kruszewski Citation2015, Abend et al. Citation2016) or undiluted whole blood (Manning et al. Citation2013). However, none of these studies have addressed the role of blood culture methods during the incubation time at 37 °C following radiation exposure. Such a comparison would allow the impact, if any, on the transcriptional response to be studied. A wide range of methodologies, reagents and analysis techniques are available for studying gene expression and it is important to identify external factors, apart from radiation exposure, which may cause ‘artificial’ transcriptional modifications in ex vivo studies, like culture conditions or the type of analytical approaches; this is particularly relevant for the calibration curves generated as they are the reference used for in vivo dose assessments. This concern was briefly addressed in Macaeva et al. (Citation2016), where they compared gene expression levels in their study to others in the literature and found that despite varying cell types, radiation quality, dose rate, a core signature of genes was found in common among the studies. However, the role of ex vivo blood preservation has yet to be addressed.
In the present study, we study the impact of blood culture methods following radiation exposure on the expression of radiation-responsive genes and the effect on dose estimation of blinded samples. The role of the protocol for blood preservation during the experiments in mimicking as closely as possible in vivo conditions and its impact on inter-laboratory comparisons is an important factor worth addressing. The addition of culture medium supplements could potentially influence transcriptional changes and artificially modify the response to radiation compared to the natural in vivo response. As a consequence, this could introduce differences between participating labs and most importantly affect the shape of the calibration curves, hence providing inaccurate dose estimates. The use of different platforms may also introduce variability in the dose estimates provided, however, in a recent paper by Macaeva et al. (Citation2016), gene expression profiles from different platforms were used and very comparable gene signatures were obtained. Also, in the first RENEB exercise (Abend et al. Citation2016) different platforms were also used and again comparable results were obtained. The purpose of this exercise was not to use similar platforms hoping for similar estimates, but rather to use different platforms and investigate which provides the most accurate estimates. The fact that all laboratories provided dose estimates which are in good agreement with each other is a strength and, by itself, demonstrates the robustness of gene expression as a method for biological dosimetry.
This work is the second study on gene expression organized and conducted under the umbrella organization RENEB. This exercise was conducted by the same four European labs as in the first RENEB exercise with the addition of the Institute of Nuclear Chemistry and Technology (INCT) in Poland (), thus increasing the assesment of variabilities among labs.
Table 1. General characteristics of technical procedures utilized and experiences of the contributing institutions.
Materials and methods
pH testing of whole blood culture conditions
Peripheral blood from three different donors was drawn into EDTA tubes. One ml of blood was aliquoted per Greiner Cryo.s™ 2 ml vial tube, allowing for gas exchange. Samples from the same donor were kept at the same conditions with a varying time point. Three time-points were tested: 0 h (∼3 h after blood drawing), 2 h (∼5 h after blood drawing), 24 h (∼27 h after blood drawing). Three storage conditions were tested: room temperature (RT), 37 °C incubator without CO2 supply, 37 °C incubator with CO2 supply. At each time-point one blood sample per condition was centrifuged for 10 min at 1500 g at 4 °C. The pH values of plasma were measured immediately after centrifugation using WTW inoLab pH level 1 pH meter (Weilheim, Germany). All procedures followed were approved by the local SCK•CEN Ethics Committee and were carried out in accordance with the ethical standards of the Helsinki Declaration of 1975, as revised in 2000.
Blood sampling, irradiations and distribution to participant laboratories
Peripheral blood was taken from one healthy female blood donor with informed consent and ethical approval from Berkshire Research Ethics Committee (reference number 09/HO505/87). The blood sample was collected into an EDTA-coated tube with one tube per dose. Blood samples were immediately exposed to a gamma Cobalt 60 source at 37 °C (MRC, Harwell Campus, UK) with a dose-rate of 0.7 Gy/min. The absorbed doses were measured using TLD for each dose. The doses for the calibration curve were 0, 0.16, 0.41, 0.70, 1.43 and 2.92 Gy while blind samples were exposed to doses 0.44, 1.08, 1.89 and 0 Gy and labelled A, B, C and D, respectively. After irradiation, each sample was split to be cultured in two different conditions. The whole blood culture conditions consisted of 500 μl whole blood on its own while for the diluted blood conditions whole blood samples were diluted with an equal volume of Roswell Park Memorial Institute (RPMI) 1640 medium containing 10% FCS in a T75 flask. Both samples for each dose were then placed in an incubator at 37 °C for 24 h.
At the 24 h time-point, 1 ml RNALater (RiboPure™ RNA Purification Kit, Ambion, Vilnius, Lithuania) was added to the 500 μl whole blood samples while the diluted blood samples were processed with QIAamp RNA Blood Mini Kit (Qiagen, Hilden, Germany) up to step 6 of the manufacturer’s protocol, (leukocytes lysed in RLT buffer). Both sets of samples were then placed on ice or frozen until shipment.
Shipment
Blood samples were sent in polystyrene shipment boxes with cool packs or dry ice by an overnight courier service. Samples were sent in two lots: (1) Two test samples were sent from each culture condition (four samples in total); (2) The calibration samples from the two culture conditions and blind samples labelled A, B, C and D were sent to each lab separately. The temperature in the polystyrene box with cold packs was measured by temperature loggers.
Shipment conditions for whole blood with RNALater
To test storage conditions during transport, blood was drawn from three different donors and collected into EDTA tubes. The blood was aliquoted into tubes and one blood sample from each donor was placed at (1) RT for 24 h, (2) − 20 °C for 24 h, (3) in a polystyrene box with cold packs for 24 h, (4) on wet ice for 24 h, (5) at −20 °C for 12 h, then in a polystyrene box with cold packs for 12 h, and (6) in a polystyrene box with cold packs for 12 h followed by 12 h at −20 °C.
RNA extraction
RNA was extracted from the whole blood samples using the RiboPure™ RNA Purification Kit (Ambion, Vilnius, Lithuania) following the manufacturer’s instructions. RNA extraction from diluted blood samples was performed using QIAamp RNA Blood Mini Kit (Qiagen, Hilden, Germany) by Labs 1, 2, 3 and 4. Lab 5 used RNeasy Mini Kit (Qiagen, Hilden, Germany) according to the manufacturer’s protocol. In all labs except for Lab 3, samples were treated with appropriate DNAse I reagents provided with the RNA extraction kits. Lab 3 instead used a Trizol step in the protocol which gives rise to a higher purity of RNA. Further details of RNA isolation, cDNA synthesis and quantification for Labs 4 and 5 are given in . Details for the other labs can be found in Abend et al. (Citation2016).
Table 2. Methods used by contributing labs.
Analysis
Analyses of microarrays as well as QRT-PCR assays were performed at the labs according to established protocols (). Detailed analysis protocols for Labs 1, 2 and 3 are described in Abend et al. (Citation2016). DNA microarrays (44 k whole human genome, G4112F, Agilent) were performed according to the manufacturer’s protocols and as described in Knops et al. (Citation2012).
Statistical methods
The precision of reported dose estimates was measured by calculating the mean of the absolute differences (MAD) of estimated doses to their corresponding true doses. Descriptive statistics were calculated in Microsoft Excel or SAS. The analytical statistics (t-test) were performed using SAS (v.9.2; SAS Institute Inc., Cary, NC). In the case of unequal variance, we employed the Satterthwaite method implemented in the SAS procedure called ‘PROC TTEST’. Graphs were created using Sigma Plot 12.5 (Jandel Scientific, Erkrath, Germany).
Results
Different conditions of whole blood culture have no effect on blood pH
Different culture conditions and time-points had no significant effect on the pH of the blood samples from different donors (). We were therefore able to conclude that there is no pH associated modification of the white blood cell environment when storing undiluted whole blood for 24 h.
Table 3. pH levels in whole blood from three donors at varying time-points and conditions.
Shipment conditions for whole blood with RNALater
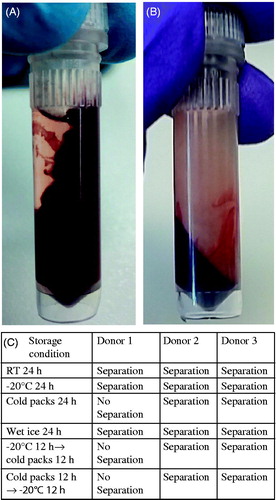
Upon receipt of the test samples which were sent as a pre-experiment, all four labs to which the same samples were shipped, reported that after centrifugation whole blood samples in RNALater would not separate blood from the RNALater reagent. Instead, there appeared to be a smearing of the blood sample throughout the tube as shown in preventing efficient lysis to occur; in contrast normal centrifugations and separation were obtained for the blood samples prepared in the lab where no shipment was involved (). In order to further investigate this issue, an experiment was performed to assess the role of the shipment conditions at RT, −20 °C and with cold packs for three blood donors. Results showed that the smearing of the blood samples appeared in some samples specifically when stored with cold packs (). Although no explanation was found, it was decided that subsequent blood samples would be sent frozen on dry ice.
Figure 1. Different shipment conditions of whole blood with RNALater. (A) Whole blood with RNALater after centrifugation for 1 min without shipment. (B) Whole blood with RNALater after centrifugation for 1 min after shipment on wet ice. (C) Centrifugation results of whole blood with RNALater samples from three donors at varying storage conditions.
RNA extraction
RNA of sufficient quality and quantity was extracted from all samples which were sent on dry ice. The total amount of RNA appeared comparable between labs with the exception of diluted blood samples from Lab 3 where 4.21 micrograms of total RNA was extracted on average compared to 1.34, 1.31, 0.92 and 0.75 µg for Labs 1, 2, 4 and 5, respectively (). Overall, the total amount of RNA recovered was significantly higher when extracted from whole blood. A 4- to 6-fold higher amount of RNA was found for whole blood (mean for all labs, excluding Lab 3: 6.5 ± 3.1 micrograms [amount for 500 microliters ×2]) compared to diluted blood (mean of 1.1 ± 0.36, excluding Lab 3). These differences were of statistical significance (p < .0001). In contrast, the RNA quality as assessed by obtaining RIN values, was significantly lower in whole blood samples (mean RIN for Labs 1–4 was 6.8 ± 0.4) compared to diluted blood (mean RIN for Labs 1–4 was 8.9 ± 0.8 [p < .0001]).
Table 4. Laboratory intercomparison of RNA quality and quantity.
Dose estimation
Calibration curves were obtained in each lab using their own curve fit and results for labs using QRT-PCR are shown in . Calibration curves for QRT-PCR labs, obtained with diluted blood are shown on the left panels and those obtained with whole blood on the right panels, apart from Lab 5 where both diluted and whole blood is shown on the same panel (). Overall, the shapes of the calibration curves are comparable between whole blood and diluted blood. Intra-laboratory differences are evident between genes. For example, Lab 1 () used different calibration curve fits, depending on which best suited each gene. The best fits for the two genes FDXR and CCNG1 used in Lab 2 () are different although they were analyzed simultaneously in a multiplex QRT-PCR assay, hence highlighting the gene specificity of the response to radiation. The fits are therefore gene-dependent and are not affected by the blood culturing conditions. With regards to the difference in expression between whole and diluted blood, the difference can be seen in particular in Lab 4 () and is perhaps most evident in Lab 5 () where the genes are expressed at a higher Ct level in the whole blood samples. The shapes of the calibration curves are very similar for Lab 4 but it is the Ct values that differ, e.g. for MDM2 0 Gy starting at 6 Ct for diluted blood and 8 Ct for whole blood () (Supplementary Table 1, available online). The different blood preservation methods therefore seem to affect baseline expression levels, although the relative expression in response to radiation remains was overall very similar.
Figure 2. Calibration curves from the QRT-PCR labs for diluted blood (left panels) and whole blood (right panels) from Lab 1 (A, B), Lab 2 (C, D), Lab 4 (E, F) and Lab 5 (G). For Lab 5 whole blood and diluted blood calibration curves are both displayed in panel E. Error bars reflect the SEM with n = 3 (Lab 2), n = 12/17 (Lab 4), n = 8 (Lab 5), but for Lab 1 error bars represent min/max CT-values, because measurements were done in duplicate.
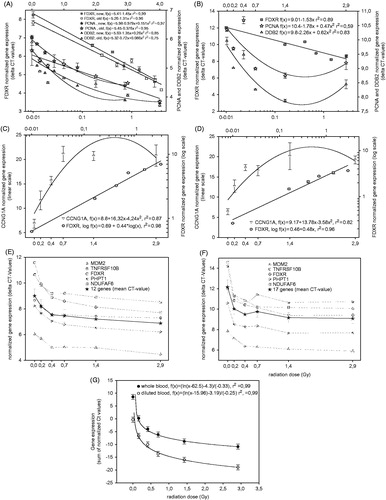
In , calibration curves derived from whole and diluted blood are shown for each of the two genes analyzed in Lab 2. For FDXR () the best fit is obtained using a log fit, while a linear quadratic was the best for CCNG1 (). Coefficients of determination of the calibration curves were 0.98 and 0.96 for FDXR, and 0.87 and 0.83 for CCNG1 for diluted blood and whole blood, respectively. The normalized absolute gene expression values are on average slightly higher for diluted blood and this is more pronounced for FDXR. The normalized gene expression values were plotted versus the true doses of the four blinded samples for whole blood (white stars and squares) and diluted blood (filled triangles) and do show a general good fit with the corresponding calibration curves. For CCNG1, the dose assessment in the 0–1 Gy range is accurate (normalized gene expression of 6.14 [0 Gy] 14.90 [0.44 Gy] and 23.60 [1.08 Gy], respectively) but for higher doses, due to the shape of the calibration curve, estimating the dose accurately becomes problematic as doses of 1.08 and 1.89 Gy could not be discriminated (normalized gene expression of 23.60 and 23.64, respectively). This issue highlights the need for further optimization of gene expression and also the continued search for novel gene biomarkers which may be useful for covering a range of doses, dose-rates and time-points. Importantly, it should be noted that the data presented here were obtained with blood samples exposed ex vivo and it remains to be seen if the same would apply in vivo as it is possible that the plateau phase observed may be due to the experimental conditions and that it may not be detected in vivo. This is also true for FDXR but to a lower extent as normalized gene expression shows a better dose dependency (normalized gene expression of 0.72, 3.28, 6.50, 6.72 for diluted blood and 0.2, 1.66, 3.23 and 4.21 for whole blood corresponding to doses of 0, 0.44, 1.08 and 1.89 Gy, respectively). This is reflected in where, although the whole blood MAD values for both genes are slightly lower (0.2 for whole blood versus 0.3 for diluted blood), no reported dose estimate is out by more than 0.5 Gy for whole blood as compared to diluted blood where doses of 2 and 2.1 were reported (true dose of 1.08 Gy) for FDXR and CCNG1, respectively. Statistical analysis of dose estimates based on diluted versus whole blood did not show significant differences in mean values for true doses such as 0 Gy (p = .3), 0.4 Gy (p = .1) and 1.9 Gy (p = .2). However, mean values at the true dose of 1.1 Gy differed significantly between dose estimates derived from diluted (1.6 Gy) and whole blood (0.9 Gy, p = .0007). These significant differences were observed in all labs analyzed and were not observed at true doses of 1.9 Gy (data not shown).
Figure 3. Normalized expression values of FDXR (A, log fit) and CCNG1 (B, linear-quadratic fit) from calibration (0, 0.16, 0.41, 0.70, 1.43 and 2.92 Gy) and blind (0, 0.44, 1.08 and 1.89 Gy) samples. Irradiation occurred either in diluted blood (filled in shapes) or whole blood (not filled in shapes) samples.
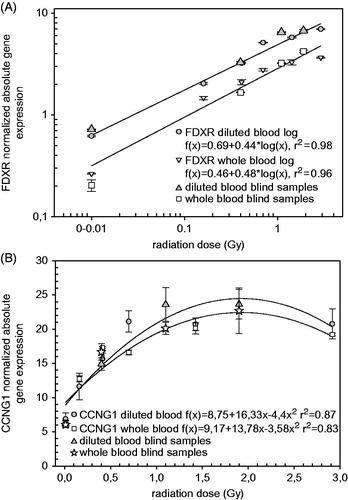
Table 5. Reported dose estimates from labs running QRT-PCR or microarrays for each of the samples irradiated with a known (true) dose.
Results presented in summarize the experimental data generated in the five participating labs obtained by either QRT-PCR or microarrays. Dose estimates from the QRT-PCR labs were either provided for a single gene or for a combination of 12 (diluted blood) and 17 (whole blood) genes (Lab 4), or 8 (Lab 5) genes (). For Lab 4, MAD values for a gene signature should only be reflected by one dose estimate and not for each gene, it was decided to also show the dose estimates per gene as this reflects the robustness of the gene expression approach. Lab 1 also performed the dose estimation using calibration curve samples which were prepared and sent 3 months earlier which provided very similar dose estimates to the calibration curve prepared and used on the same day. It is very useful to know that previously prepared calibration curves can still provide accurate dose estimates months after preparation. The precision of dose estimates using one gene only (e.g. FDXR), as illustrated for Lab 1 and 2, proved to be as precise as dose estimates based on up to eight or 17 genes, which were used by Labs 4 and 5. Overall, the 1.1 Gy blinded sample was less well estimated across all contrilaboratories, an effect which was not observed at higher true dose of 1.9 Gy. Although there is no identified reason for this, it cannot be excluded that something happened to this tube during handling and/or irradiation or that it is approaching the upper limit of detection for gene expression (Abend et al. Citation2016).
The microarray approach employed (1) hierarchical clustering, (2) KNN-based dose assessments, and finally (3) dose estimates based on calibration curves of several genes shown in . Hierarchical clustering revealed that all irradiated whole blood samples resembled more to each other than the irradiated diluted samples (). This strongly suggests that a large difference exists in the response in terms of gene expression due to sample preparation. Furthermore, all irradiated samples were more closely related to each other, i.e. showed more similarities than to their respective control/non-irradiated sample, irrespective of sample preparation. Therefore, both blinded D samples were correctly classified as non-irradiated samples (0 Gy) ( and ).
Figure 4. Microarray dose estimation approach. (A) K nearest neighbour classification based on the two radiation responsive genes FDXR and TNFSF4. For each test sample (whole blood sample A–D and diluted blood sample A–D) the three nearest training samples with known radiation doses (0–4 Gy) were determined. Afterwards, the test sample was assigned to the most frequent radiation dose among its three nearest neighbours. The training samples were derived from ex-situ irradiated blood from six non-related healthy donors (three males and three females of three age classes; Boldt et al. Citation2012). Gene expression of FDXR and TNFSF4 are given as Log2 values. (B) Hierarchical clustering of calibration samples and test samples. The heat-map illustrates the radiation-induced expression changes of the seven signature genes of Lab 3 (Boldt et al. Citation2012). The hierarchical clustering of the samples (columns) reveals that non-irradiated samples can be easily discriminated from irradiated samples (0.16–2.92 Gy). Also, all irradiated whole blood samples as well as all irradiated diluted blood samples form a separate cluster, indicating that sample treatment influences significantly the gene expression response of the signature genes in the irradiated samples. Log2 gene expression values obtained by DNA microarray analysis are colored from red (low) to white (high). (C, D) Regression curves of the signature genes used for dose assessment in Lab 3. C – whole blood samples; D – diluted blood samples. Gene expression is given as Log2 value.
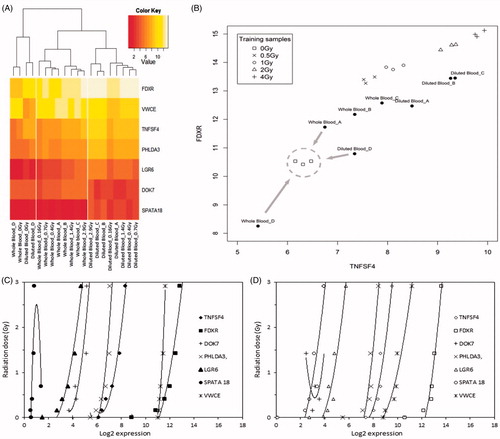
, illustrates the applied KNN approach using the gene expression of the signature genes TNFSF4 and FDXR. The gene combinations with the highest predictive power, i.e. the genes TNFSF4, FDXR, LGR6, VWCE for whole blood samples (four genes) and the genes TNFSF4, FDXR for diluted blood samples (two genes) classified the test samples A–D with good precision. The 0.4 Gy-irradiated sample B was classified as irradiated with 0.5 Gy (diluted blood) and 1 Gy (whole blood) whereas the 1.1 Gy-irradiated sample C was classified as irradiated with 2 Gy for diluted blood, respectively, 1 Gy for whole blood. The 1.9 Gy-irradiated sample D was correctly classified as a 2 Gy-irradiated sample, irrespective of sample preparation (). All non-irradiated samples were correctly classified as unirradiated controls by the KNN method. Overall, the obtained dose estimations obtained by KNN classification were very satisfying keeping in mind that the classification is not based on the calibration sample data but on microarray data from 2008–2011 derived from cultured peripheral blood lymphocytes from six non-related blood donors (for more detail, see Boldt et al. Citation2012).
The dose estimates derived by regression curve analysis () from the three most predictive gene combinations for each culture condition were very similar to each other (Lab 5, regression analysis; ). Moreover, the radiation doses of all whole blood test samples were assessed with a very good accuracy, irrespective of the used gene combinations for the dose assessment. The radiation dose allocation for whole blood samples based on TNFSF4, FDXR and DOK7 showed a deviation of only 0.1 Gy for two of the four samples and allocated the dose for the other two samples correctly. The radiation dose for three of the diluted blood samples was also assessed with good accuracy (≤0.5 Gy), while the radiation dose to the diluted blood sample B was overestimated by >1 Gy, irrespective of the used gene combination.
When analyzing the results of all five labs together, the mean MAD were comparable for diluted and whole blood, 0.38 (SEM = 0.06) and 0.36 (SEM = 0.05), respectively, and differed not significantly (p = 0.9). The average number of dose estimates out of ±0.5 was following the same trend, 1.3 (±0.1) for diluted blood and 1.2 (±0.2) for whole blood (p = 0.6). All labs were able to identify the 0 Gy blinded sample as unirradiated, except for Lab 5 which provided a dose estimate of 0.1 Gy for the whole blood 0 Gy sample. The most precise dose estimate for an irradiated sample was given for the 0.4 Gy sample which, similarly to our previous exercise, again shows that the most accurate dose estimates are given in the linear phase of the calibration curve of <1 Gy (Abend et al. Citation2016). Also, precision of dose estimates based on one gene only (e.g. FDXR with MAD = 0.3–0.4 Gy in different labs) appeared as good as employing gene signatures consisting of up to 17 genes.
Discussion
Monitoring specific gene expression modifications in response to an exposure to ionising radiation is emerging as a promising method for biological dosimetry purposes. However further work is required to learn more about potential technical issues and to further assess the robustness of dose estimates by continuing organising inter-laboratory comparisons. One main purpose of this study was to assess the potential of using undiluted whole blood as a simple alternative to blood preservation by medium dilution. This is an attractive alternative as it is simple and would prevent potential gene expression variability introduced after dilution. In order to compare undiluted whole blood with blood diluted with medium we first verified that whole blood could be kept for 24 h without pH variations. We observed that pH values of ex vivo blood kept at 37 °C over a period of 24 h remained unchanged.
As this was an inter-laboratory comparison, whole blood and diluted blood samples prepared at PHE had to be dispatched to the other four participating labs. During the pilot experiment, we unexpectedly found out that the shipment of whole blood in RNALater on wet ice resulted in what was described as a smearing/clotting of the blood samples preventing the removal of RNALater by centrifugation in the first step of RNA extraction. This was problematic as RNA extraction proved almost impossible with very low yields recovered. This whole blood sample clotting was reported in all four labs which received shipped samples. After investigation of different shipment temperatures, it appeared that clotting only occurred when the samples were stored with cold packs. Interestingly, it seemed that sample clotting was donor-dependent, although this would require further confirmation. One hypothesis is that low temperatures and pressure differences experienced during the flight may cause a precipitation of the salts and lysis of the cells in the RNALater solution, as results from the temperature loggers revealed that the temperatures in the polystyrene shipment box ranged from 22.5 to −3.5 °C (data not shown) during shipment with cold packs. This smearing of samples was also apparent after transportation at RT, which is why we decided to ship samples frozen for the remainder of the exercise. Yet, in the case of a large scale nuclear accident, issues such as the availability of dry ice and the cost of shipping parcels with dry ice could prove problematic. The purpose of sending the blood samples mixed with RNALater is that for samples collected after in vivo exposure, it is a cheap and simple alternative to PAXgene tubes. In the case of a nuclear incident, where potentially thousands of samples would have to be collected in a short period of time, obtaining such a large number of tubes might prove to be problematic as they have a relatively short shelf-life (6 months) and a stock would have to be periodically renewed which comes at a cost. Therefore preserving blood RNA in a simple step by adding RNALater before shipping at RT was an attractive alternative protocol worth investigating. The fact that it does not seem to be compatible with being shipped by aeroplane in liquid form was an unexpected result.
A clear difference in RNA quantity and quality was seen between whole blood preserved with RNALater and RNA extraction performed with the Ribopure kit in comparison with whole blood diluted with medium and RNA extracted with the QIAamp kit. The Ribopure kit produced a higher quantity of RNA but it was of lower quality with RINs ranging between 5.3 and 7.6. While the QIAamp kit produced lower, yet sufficient quantities of RNA, the quality was consistently high with RINs of 9–10. However, it is unclear whether the differences are due to the culture conditions or the extraction kits as each kit is designed to be suited for the different culture condition. Although there was a noticeable difference between the methods in the RIN values they provided, no degradation of RNA was evident in either method and all were of sufficient quality. Although mRNA degradation is a potential issue, it appears that all samples analyzed in the present study were of sufficiently good quality to provide reliable and comparable results. The RNA isolated using both methods was still of sufficient quantity and quality for each downstream application. It is nevertheless worth keeping in mind that the amount of RNA extracted from whole blood preserved in RNALater is 4- to 6-fold higher, which might be important in case of limited volume of blood being available.
Overall, both the 1.1 Gy and 1.9 Gy samples had the most dose estimates which fell into the ±0.5 Gy uncertainty interval. This appears to be a limitation of gene expression which has been previously seen in Manning et al. where the calibration curves appear to plateau at higher doses (≥1 Gy) (Manning et al. Citation2013). Although this issue is also encountered during established biodosimetry techniques, it generally occurs at a much higher dose of about 5 Gy (International Atomic Energy Agency [IAEA] Citation2011). During a radiation accident, people are usually exposed to doses of less than 1 Gy (IAEA), the doses at which gene expression is most accurate (Abend et al. Citation2016). Therefore, this technique, with its fast report time, is still a useful tool in biodosimetry. The doses for the unknown samples were chosen with this issue in mind with a control sample, a dose below 1 Gy, a dose around 1 Gy and a dose above 1 Gy. These doses investigate the accuracy in determining a dose estimate for an unexposed individual, an individual exposed to a low dose and two further higher doses which will test the limit of detection for gene expression.
Some labs used a gene signature for providing dose estimates while others used single genes like FDXR. According to the data presented, gene signatures performed in a comparable way to a single gene approach. This is illustrated by the consistency in dose estimation across labs. However, gene signatures provide more robustness due to redundancy and it is unlikely that a single gene might represent a specific enough response to ionizing radiation independent of the time after exposure and potential confounding factors, such as smoking, gender, chronic irradiation or inflammation. The use of one female donor for this experiment does introduce the issue of variability among male and female blood donors. Previous experiments have found donor sex to be an influencing factor (Kim et al. Citation2007) and use of a female blood donor may introduce bias. The focus of this experiment however, is on blood storage and preparation issues. In order to prevent variabilities being introduced from other factors, one donor was used. Donor variability and variability among male and females has been previously addressed in human blood (Manning et al. Citation2013), although it is unlikely that blood gender would affect blood storage and preparation issues, it is a question that may need to be further investigated on a larger scale. Also, the participating labs used their own methods and data analysis techniques, namely KNN, hierarchical clustering, use of calibration curves derived from single genes or genes combined which provided comparable MADs relative to the true doses and a similar number of out of range (>0.5 Gy) measurements.
Hierarchical clustering of seven radiation-responsive genes (Boldt et al. Citation2012) from microarray results revealed that non-irradiated samples are very different from irradiated samples, irrespective of sample preparation (). Hierarchical clustering has previously proven to be very accurate in separating irradiated from non-irradiated samples, even at very low radiation doses such as 20 mGy (Knops et al. Citation2012). However, sample preparation seems to affect irradiated samples in a general way. Whole blood samples resemble each other more in terms of gene expression, irrespective of dose, than diluted blood samples (). This indicates that the sample preparation influences the gene expression response after irradiation, at least in the seven genes used for the clustering approach. This might also indicate that some factors in the respective solutions interfere substantially with the radiation damage response of peripheral white blood cells.
It has been reported many times that the quantification of gene expression in response to radiation exposure by microarray technology is robust and reliable (Paul & Amundson Citation2008; Boldt et al. Citation2012; Knops et al. Citation2012), and the obtained gene signatures derived in ex situ irradiated blood are shown to be predictive for the radiation dose in vitro as well as in vivo (Paul et al. Citation2011). The gene signature developed by Boldt et al. (Citation2012) was reported to be robust in terms of dose prediction. In the current study the KNN approach was used to predict the radiation dose of the calibration curve samples as well as of the test samples by comparing them to this existing data set derived from six healthy non-related donors. As shown in , this approach results in a good accuracy for radiation dose prediction. This is of major importance because it shows that a satisfying dose classification of blood from a non-related donor, either prepared as whole or diluted blood, is feasible using the independent gene expression data of six non-related donors. This points out to an inherent robustness of the seven gene signature by Boldt et al. (Citation2012). The overall achieved accuracy of the dose estimates by the KNN methodology is very similar to the results reported in Abend et al. (Citation2016) by the same authors.
To summarize the RENEB II exercise, we can conclude that the data presented here demonstrate that the dose estimates are always comparable, irrespective of the approach chosen by the participating labs. Overall, for in vitro studies, we can conclude that labs can use their favorite protocol for preserving blood during incubation times as this does not affect the dose estimates. Dose estimates obtained from diluted or whole blood are also absolutely comparable. For in vivo studies, whole blood preserved in RNALater is a cheap and simple alternative which may be considered for large sample size analyses. However, calibration curves using different blood preservation methods are not interchangeable as illustrated by the different basal levels of expression between whole and diluted blood calibration curves. Finally, we showed that a calibration curve prepared 3 months previously can be successfully used to provide comparable dose estimates as the calibration curve generated specifically for RENEB II ().
In conclusion, this study brought new data drawing important conclusions which will be beneficial to future studies. We are continuing to progress with the learning process of using gene expression for biological dosimetry purposes and it continues to show great promise as a method for accurate and rapid assessment of radiation exposure.
Supplement_table_1.xlsx
Download MS Excel (60.6 KB)Acknowledgements
This report is work commissioned by the National Institute for Health Research. The views expressed in this publication are those of the authors and not necessary those of the NHS, the National Institute for Health Research or the Department of Health.
Disclosure statement
The authors report no conflicts of interest. The authors alone are response for the content and writing of the paper.
Funding
This work was supported by the EU within the 7th Framework Programme [RENEB project, grant agreement No. 295513] and financial support was provided by the National Institute for Health Research Centre for Research in Public Health Protection at the Public Health England.
References
- Abend M, Badie C, Quintens R, Kriehuber R, Manning G, Macaeva E, Nimja M, Oskamp D, Strunz S, Moertl S, et al. 2016. Examining radiation-induced in vivo and in vitro gene expression changes of the peripheral blood in different laboratories for biodosimetry purposes: first RENEB gene expression study. Radiat Res. 185:109–123.
- Amundson S, Grace M, McLeland C, Epperly M, Yeager A, Zhan Q, Greenberger J, Fornace A Jr. 2004. Human in vivo radiation-induced biomarkers: gene expression changes in radiotherapy patients. Cancer Res. 64:6368–6371.
- Badie C, Kabacik S, Balagurunathan Y, Bernard N, Brengues M, Faggioni G, Greither R, Lista F, Peinnequin A, Poyot T, et al. 2013. Laboratory intercomparison of gene expression assays. Radiat Res. 180:138–148.
- Boldt S, Knops K, Kriehuber R, Wolkenhauer O. 2012 A frequency-based gene selection method to identify robust biomarkers for radiation dose prediction. Int J Radiat Biol. 88:267–276.
- Brzoska K, Kruszewski M. 2015. Toward the development of transcriptional biodosimetry for the identification of irradiated individuals and assessment of absorbed radiation dose. Radiat Environ Biophys. 54:353–363
- Dressman H, Muramoto G, Chao N, Meadows S, Marshall D, Ginsburg G, Nevins J, Chute J. 2007. Gene expression signatures that predict radiation exposure in mice and humans. PLoS Med. 4:e106.
- International Atomic Energy Agency (IAEA). 2011. Cytogenetic analysis for radiation dose assessment: a manual. IAEA Technical Reports Series No. 405. Vienna: IAEA.
- Kabacik S, Mackay A, Tamber N, Manning G, Finnon P, Paillier F, Ashworth A, Bouffler S, Badie C. 2011. Gene expression following ionising radiation: identification of biomarkers for dose estimation and prediction of individual response. Int J Radiat Biol. 87:115–129.
- Kim SJ, Dix DJ, Thompson KE, Murrell RN, Schmid JE, Gallagher JE, Rockett JC. 2007. Effects of storage, RNA extraction, genechip type, and donor sex on gene expression profiling of human whole blood. Clin Chem. 53:1038–1045
- Knops K, Boldt S, Wolkenhauer O, Kriehuber R. 2012. Gene expression in low- and high-dose-irradiated human peripheral blood lymphocytes: possible applications for biodosimetry. Radiat Res. 178:304–312.
- Lucas J, Dressman H, Suchindran S, Nakamura M, Chao N, Himburg H, Minor K, Phillips G, Ross J, Abedi M, et al. 2014. A translatable predictor of human radiation exposure. PLoS One. 9:e107897.
- Manning G, Kabacik S, Finnon P, Bouffler S, Badie C. 2013. High and low dose responses of transcriptional biomarkers in ex vivo X-irradiated human blood. Int J Radiat Biol. 89:512–522.
- Macaeva E, Saeys Y, Tabury K, Janssen A, Michaux A, Benotmane M, De Vos W, Baatout S, Quintens R. 2016. Radiation-induced alternative transcription and splicing events and their applicability to practical biodosimetry. Scientific Rep. 6:19251.
- Meadows S, Dressman H, Muramoto G, Himburg H, Salter A, Wei Z, Ginsburg G, Chao N, Nevins J, Chute J. 2008. Gene expression signatures of radiation response are specific, durable and accurate in mice and humans. PLoS Med. 4:e106.
- Meadows S, Dressman H, Daher P, Himburgh H, Russell J, Doan P, Chao N, Lucas J, Nevins J, Chute J. 2010. Diagnosis of partial body radiation exposure in mice using peripheral blood gene expression profiles. PLoS One. 5:e11535.
- Paul S, Amundson S. 2008. Development of gene expression signatures for practical radiation biodosimetry. Int J Radiat Oncol Biol Phys. 71:1236–1244.
- Paul S, Barker C, Turner H, McLane A, Wolden S, Amundson S. 2011. Prediction of in vivo radiation dose status in radiotherapy patients using ex vivo and in vivo gene expression signatures. Radiat Res. 175:257–265.
- Riecke A, Rufa C, Cordes M, Hartmann J, Meineke V, Abend M. 2012. Gene expression comparisons performed for biodosimetry purposes on in vitro peripheral blood cellular subsets and irradiated individuals. Radiat Res. 178:234–243.
- Rothkamm K, Beinke C, Romm H, Badie C, Balagurunathan Y, Barnard S, Bernard N, Boulay-Greene H, Brengues M, De Amicis A, et al. 2013. Comparison of established and emerging biodosimetry assays. Radiat Res. 180:111–19.
- Sprung C, Li J, Hovan D, McKay M, Forrester H. 2011. Alternative transcript initiation and splicing as a response to DNA damage. PLoS One. 6:e25758.