
Abstract
Purpose: Reliable dose estimation is an important factor in appropriate dosimetric triage categorization of exposed individuals to support radiation emergency response.
Materials and methods: Following work done under the EU FP7 MULTIBIODOSE and RENEB projects, formal methods for defining uncertainties on biological dose estimates are compared using simulated and real data from recent exercises.
Results: The results demonstrate that a Bayesian method of uncertainty assessment is the most appropriate, even in the absence of detailed prior information. The relative accuracy and relevance of techniques for calculating uncertainty and combining assay results to produce single dose and uncertainty estimates is further discussed.
Conclusions: Finally, it is demonstrated that whatever uncertainty estimation method is employed, ignoring the uncertainty on fast dose assessments can have an important impact on rapid biodosimetric categorization.
Introduction
Biological markers of radiation exposure are important tools for determining radiation doses for exposed or suspected exposed individuals following a mass-casualty radiation accident or incident (Swartz et al. Citation2014). Members of the European Union (EU) 7th Framework Programme (FP7) Realizing the European Network of Biodosimetry (RENEB) retrospective dosimetry mutual assistance network and European Radiation Dosimetry Group (EURADOS) Working Group (WG) 10 on retrospective dosimetry have been developing and validating existing and new physical and biological exposure markers, to ensure that network members are ready to provide retrospective dosimetry to support emergency responders in the event of a large scale radiological event. Rapid biodosimetric categorization of individuals suspected of being exposed to ionizing radiation is based on dose information from the individual RENEB assays – the biological techniques based on scoring of dicentrics (DIC), micronuclei (MN), gamma-H2AX foci, prematurely condensed chromosomes (PCC), and the physical techniques of electron paramagnetic resonance (EPR) and optically stimulated luminescence (OSL) (Kulka et al. Citation2015, Citation2016).
In the initial phase of a response to a mass casualty exposure scenario, triage of individuals for medical purposes is generally based solely on where individuals were and for how long together with the presence/absence of prodromal signs. However, the stress and uncertainty following such an event and the inherent inter-individual variability mean that these criteria are known to be unreliable. Thus the need for more quantitative secondary triage methods, which can be provided by the biodosimetry community, is well documented (Sullivan et al. Citation2013). Although the main focus of large scale accident biodosimetry is rapid dose estimation to assist emergency responders in identifying those in greatest need of medical intervention, it is important to keep in mind that all biological and physical methods of retrospective dosimetry result in dose estimates with non-zero uncertainties, and the incertitude associated with biological dose estimates can be considerable. Methods of uncertainty estimation for screening doses and biodosimetry triage or rapid categorization were previously developed under the EU FP7 multi-disciplinary biodosimetric tools to manage high scale radiological casualties (MULTIBIODOSE) project (Jaworska et al. Citation2015). Under RENEB, work has continued to refine the biological and statistical aspects of the assays to ensure readiness of the community to respond to a radiological or nuclear accident or incident (Barnard et al. Citation2015; Kulka et al. Citation2015; Abend et al. Citation2016).
In this paper, the results of some recent work to refine the statistical aspects of the dosimetry methods are described, focusing on formal assessment of the uncertainties associated with rapid dose estimates and the associated categorization of individuals to support medical triage. Simulations based on recent data have been used to test and compare uncertainty estimation methods relying on the International Organization for Standardization (ISO) standard method of propagation of errors (ISO19238, Citation2014), a simplification of this method ignoring covariances between experimental factors used under MULTIBIODOSE (Ainsbury et al. Citation2014), Merkle’s method for combining the errors on the yield and curve (Merkle Citation1983, International Atomic Energy Agency [IAEA] 2011) the IAEA simplification of this based on the exact Poisson error (IAEA Citation2011) and a Bayesian method to assess radiation dose (Higueras et al. Citation2015). Where appropriate, the methods have been applied to data from the dicentric, gamma-H2AX, micronucleus and PCC assays. The probability of correct rapid categorization (< 1 Gy; 1–2 Gy; 2+ Gy) given the magnitude of the associated uncertainties was then tested using data from recent MULTIBIODOSE and RENEB inter-comparison exercises and the RENEB ‘table-top’ rapid biodosimetric categorization exercise, which amongst other things has resulted in the creation of a formal expert consensus for fast assessment (Brzozowska et al. Citation2016). Finally, the potential for and implications of inclusion of an assessment of uncertainty into rapid biodosimetric information provided to emergency responders or other medical professionals is considered.
Materials and methods
Data and assumptions
For the dicentric assay, the calibration data were taken from the publication of Barquinero and colleagues (1995) which is analyzed in detailed examples in the IAEA manual (2011). The data analyzed for magnitude of uncertainties come from the DIC data collected during the in vitro exposure simulations carried out under the MULTIBIODOSE and RENEB projects (Romm et al. Citation2014; Oestreicher et al. Citation2016). Uncertainties were calculated based on both whole body, acute, high dose rate (HDR) exposures and chronic/low dose rate (LDR) curves and data. The MN calibration curve data and test data were taken from Thierens et al. (Citation2014), representing data collected under the MULTIBIODOSE project. Uncertainties were again calculated based on both HDR and LDR curves and data. For LDR exposures for the dic and MN assays, a total exposure time of 10 h and a repair time, t0, of 2 h was assumed.
The gamma-H2AX curve data were taken from the 4- and 24-h calibration curves established at Public Health England (PHE) as part of the MULTIBIODOSE project (Rothkamm et al. Citation2013) and the test data were taken from the recent RENEB inter-comparison (Barnard et al. Citation2015). For the gamma-H2AX assay, it is recommended to apply at least one positive control to produce a reference sample ratio value, representing the ratio of the measured response at the chosen dose to the calibration curve response at the corresponding dose value. For this work, a relative reference sample ratio (r) value of 1 and reference sample standard deviation (SD) of sqrt(1) (a Poisson assumption) was assumed. The PCC curve and test data were taken from recent work done under RENEB (Terzoudi et al. Citation2016) for simulated high dose rate acute exposures.
Test data for all assays and scenarios were also taken from the RENEB accident simulation (Brzozowska et al. Citation2016), in order to test the impact of including uncertainty estimation on rapid biodosimetry categorization. Uncertainty calculations were based on the number of aberrations observed in 50 cells for all assays, corresponding to the recommended methods for fast dose assessment purposes.
Uncertainty analysis methods
The uncertainty associated with each assay/scenario was calculated as follows:
ISO propagation of errors (‘ISO method’). In the usual scenario, i.e. that yield of dicentrics/micronuclei and dose follow a linear-quadratic relationship, dose is calculated using EquationEquation (1)
(1) :
For the LDR exposure scenario, the relationship between the yield and dose is also reliant on the total exposure (t) and repair time (t0), and thus β in EquationEquation (1)
This leads to the addition of corresponding components based on t and t0 in EquationEquation (2)
For the gamma-H2AX assay, the situation is simplified in that the dose response is linear, but according to RENEB and MULTIBIODOSE procedures, at least one positive control or reference sample (r) must be included in each analysis to ensure that the applied calibration curve is suitable for the data being analyzed. As such, EquationEquation (1)
The corresponding EquationEquation (2)
For the PCC assay, the relationship between dose and excess PCC fragments is linear and thus EquationEquation (4)
MULTIBIODOSE simplification (‘MBD method’). Given that the uncertainties associated with fast biodosimetry are large and that the relative magnitude of the covariance components is very small, under MULTIBIODOSE it was suggested that the equations above could be simplified for uncertainty calculation for fast assessment purposes by ignoring the covariance components entirely:
Merkle’s method for consideration of Poisson error on yield and error in calibration curve coefficients (‘Merkle method’). The IAEA manual (2011), which is used by many members of the retrospective dosimetry community, presents Merkle’s proposals (1983) as the simplest method for calculation of uncertainties on dose estimates. The method is described in detail in the manual (IAEA Citation2011), however, in brief, it relies on calculation of the upper and lower 95% confidence limits on the yield (yyu and yyl) according to the Poisson distribution, using EquationEquations (6)
Calculation of the upper and lower confidence limits on the curve (ycu(D) and ycl(D)) is then carried out according to EquationEquation (8)
IAEA simplification (‘IAEA’). In addition to the above, several methods for calculating the confidence limits on estimated doses, usually characterised as the 95% confidence limits, are recommended and discussed in the IAEA manual for biodosimetry (2011). As the dominant contribution to uncertainty in rapid categorization mode is likely to be the Poisson error on the number of scored aberrations, the simplified method of calculating uncertainty based on the exact Poisson 95% confidence limits has been implemented here for comparison with the alternative methods. The upper (yyu) and lower (yyl) Poisson confidence limits on the yield are calculated as above. The limits yyu and yyl are then converted to confidence limits on dose by substituting these values into EquationEquation (1)
Bayesian calibrative density calculations (Bayes). A Bayesian approach to biodosimetry data analysis and dose estimation has been gaining popularity in recent years, with several new methods appearing in the recent literature, including the approach of Higueras and colleagues (2015) who developed a new inverse regression model applied to radiation biodosimetry using Poisson or compound Poisson responses, which produces a posterior dose distribution or calibrative density. An R programming language (R Core Team Citation2014) library has recently been created to reproduce the methodology (Moriña et al. Citation2015).
Calculations and simulations
The R programming language (R Core Team Citation2014) core functions and radir library (Moriña et al. Citation2015) were used to calculate calibration curve coefficients and covariance matrices and dose and uncertainty estimations based on the above three methods.
Next, based on the calibration data of Barquinero et al. (Citation1995), dicentric samples were simulated for several fictitious scenarios, simulating numbers of dicentric aberrations caused by irradiations of 0.5 Gy in 50 and 2002 lymphocytes, 1.5 Gy in 50 and 562 cells, and 3 Gy in 50 and 193 cells. These doses and their dicentric distributions are taken from the calibration data, so at each simulated scenario the absorbed dose sample, the test data, is not included in the calibration data set, thus simulating the level of uncertainty implicit in biological dose estimations. The simulations were generated by non-parametric bootstrap methodology, simulating samples with replacement from the original one. At each iteration, the calibration and test data are simulated, then the fitted dose-response coefficients, the variance-covariance matrix and the sample sum of the test data are collected. Finally, the dose estimation uncertainty was calculated using the five different methods analyzed in this manuscript, and it was checked to see whether the confidence (credible) interval contained the absorbed dose. The simulations were performed for 95% confidence (credible) regions, so the value closest to 95% indicates the most accurate estimation method.
Following calculation of the uncertainties using the data as described above for each of the ISO, MULTIBIODOSE, Merkle and IAEA and Bayesian methodologies, probabilities of correct rapid categorization as either <1 Gy; 1–2 Gy or 2+ Gy were then calculated using the cumulative standard normal distribution for doses in increments of 0.05 Gy from 0–3 Gy (results not reported), for each assay/exposure scenario, or using radir to implement the Bayesian methodology of Higueras et al. (Citation2015). For the calibrative density calculations, the absorbed dose prior distribution was assumed to be uniform; the calibration curve information was collected in a univariate prior assumed to be gamma distributed.
The dosimetry data were then taken from the recent RENEB table top exercise to estimate the impact of the findings on fast dose assessment in a real accident. The mean uncertainty reported in rapid categorization mode in the publications listed above was calculated for the relevant exposure scenarios at doses of 0, 0.5, 1, 1.5,2 and 2.5 Gy and applied to the DIC, MN, gamma-H2AX and PCC assay data (doses only) from the RENEB table top exercise (Brzozowska et al. Citation2016). The standard normal distribution was then used to calculate the probability of correct categorization for each data point (consisting of the mean of the dosimetry results from each of the assays) from the RENEB exercise, in order to test the impact of uncertainty on the success of the rapid dose assessment and categorization procedure. For instance, a nominal dose of just above 1 Gy might, in fact, have a larger probability given the applied uncertainty of being in the <1 Gy category than the ‘correct’ 1–2 Gy category.
Results
The fitted calibration coefficients used for the four assays are given in .
Table 1. Calibration curve coefficients and covariances, calculated using R (Citation2014), for the four biodosimetry assays.
describes the results of the simulations of coverage of the various uncertainty characterisation methods applied to the dicentric assay.
Table 2. Non-parametric bootstrap simulation of dicentric assay results to assess the magnitude of the confidence limits actually covered for a desired confidence level of 95%. The most accurate confidence (credible) region values for each experiment, those closer to 95%, are given in bold.
illustrates the relative magnitude of the uncertainties calculated for the MULTIBIODOSE methodology, for doses of 0, 0.5, 1, 1.5, 2 and 2.5 Gy. gives the probability based on the cumulative normal distribution or the Bayesian probability that, given the magnitude of the uncertainties calculated using each method, the categories were correct. illustrates one example from – the posterior dose distribution (calibrative density) for a simulated HDR exposure resulting in a yield of 0.17 dicentrics per cell to give a nominal dose of 1.5 Gy. The expected dose is 1.53 ± 0.28. The probability of being in between 1 and 2 Gy (shaded in grey) is calculated as 0.917.
Figure 1. Comparison of standard deviations based on simulated chromosome aberration data for doses of 0, 0.5, 1, 1.5, 2 and 2.5 Gy using the MBD method for the four assays: bold dotted line – DIC; solid line – MN; bold dashed line – gamma-H2AX; bold solid line – PCC.
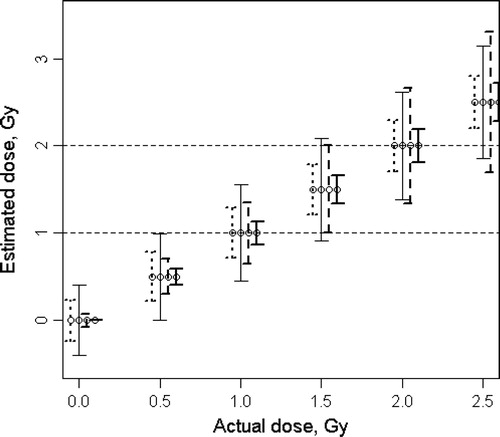
Figure 2. Example normalized posterior dose distribution (‘calibrative density’) for a simulated HDR exposure resulting in a yield of 0.17 dicentrics per cell to give a nominal dose of 1.5 Gy. The expected dose is 1.53 ± 0.28. The probability of being in between 1 and 2 Gy (shaded in grey) is calculated as 0.917.
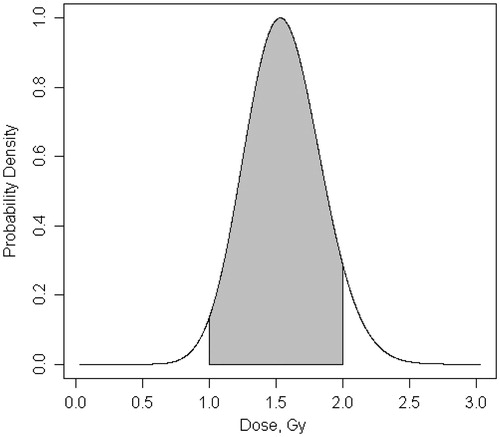
Table 3. Cumulative normal (ISO, IAEA, Merkle and MBD) or Bayesian posterior probabilities of being in correct triage category, given calculated uncertainties, for simulated doses of 0, 0.5, 1, 1.5, 2 and 2.5 Gy.
The average magnitude of the uncertainties was then applied to the RENEB table top exercise data before the cumulative normal distribution was used to calculate the probability that the dose fell in each of the three rapid assessment categories: <1 Gy, 1–2 Gy or 2+ Gy. The category that had the highest probability was assigned in each case. The results were then compared to the category assignments based on dose alone. Overall, less than 2% of the responses based on the probabilities were assigned to categories lower than expected, and these were those responses corresponding to doses just above 1 Gy. For instance, a dose of 1.05 Gy has a standard deviation of approximately 0.68 Gy (mean SD from the four assays combined). This means that there is a cumulative probability of 0.471 that the actual exposure was less than 1 Gy and a probability of 0.447 that the exposure fell between 1 and 2 Gy. Thus, incorporating the uncertainty means that this nominal dose of 1.05 Gy has a slightly higher probability of being incorrectly assigned to the <1 Gy category compared to the correct 1–2 Gy category. Applying the same procedure, 11% of the RENEB samples were categorized as being too high: these are doses above approximately 1.65 Gy (and below 2 Gy) for which the width of the normal distribution around the dose meant that they had a higher probability of being in the 1–2 Gy category.
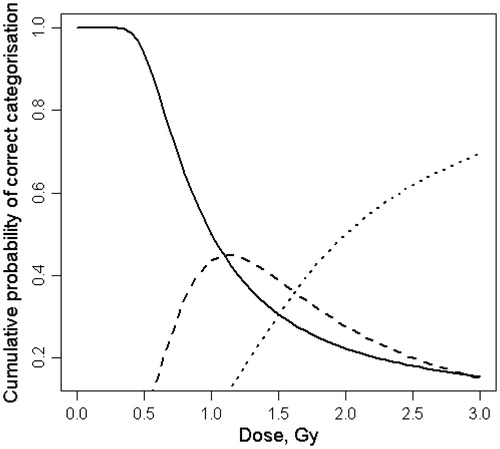
illustrates in full the variation in probability that a dose is placed in the correct category <1 Gy, 1–2 Gy or 2+ Gy with dose.
Figure 3. Cumulative probability of correct categorization – probability that a dose is placed in the category 0–1 Gy (solid line), 1–2 Gy (dashed line) or 2+ Gy (dotted line).
Discussion
Retrospective dosimetry to assist in triage of exposed or suspected exposed individuals following a large scale radiation accident or incident implies provision of dose estimates which are as accurate as possible within the shortest time possible. Biodosimetry is a recognized method to support triage and the large amount of work completed under the RENEB project has ensured that EU laboratories maintain emergency response readiness (Kulka et al. Citation2016). The RENEB ‘toolkit’ contains a number of assays, including the four assessed in this paper – further details of which can be found in Oestreicher et al. (Citation2016) for the dicentric assay; Depuydt et al. (Citation2016) for the micronucleus assay; Moquet et al. (Citation2016) for the gamma-H2AX assay and Terzoudi et al. (Citation2016) for the PCC assay. The results of the most recent RENEB table-top exercise demonstrated a very good agreement between laboratories, with a mean categorization accuracy (defined as the number of triage categorization answers which were the same as the default values, divided by the number of all answers) of 95% throughout the entire exercise (Brzozowska et al. Citation2016).
A large amount of work has shown that analysis of the number of dicentrics in 50 cells is sufficient for this purpose (e.g. Romm et al. Citation2013) and thus, for the comparisons within study, 50 cells was chosen for all assays. However, it should be noted that recommendations differ between the assays. For the micronucleus assay, a larger number of approximately 200 cells is required (Thierens et al. Citation2014); for gamma-H2AX and PCC, 20–30 cells may be sufficient (Barnard et al. Citation2015; Karachristou et al. Citation2015). However, while uncertainties have been analyzed in order to provide an indication of the number of cells that might result in a suitably reliable dose estimate, the impact of uncertainty on the rapid biodosimetry categorization results has not been considered.
In this work, a number of different methods of calculation of uncertainty for biodosimetry dose estimates have been assessed and compared: a method based on the ISO standard methodology; the MULTIBIODOSE simplification of this method ignoring the covariance terms; a method to incorporate Poisson uncertainty on the yield of aberrations with the error on the calibration curve; one other of the suggested methods from the IAEA manual (which, in practice, is what many laboratories are currently using), and a method based on Bayesian assessment of the prior dose and calibration data to produce a posterior ‘calibrative density’ dose distribution which fully incorporates all the uncertainty contributions. In practical terms, the differences in magnitudes of calculated uncertainties between the methods are generally small. Indeed, the simulation results in demonstrate that the most accurate methodology, assessed by the magnitude of the confidence limits, depends on the dose and the number of cells. The Bayesian methodology of Higueras and colleagues (2015) is the most accurate at a relatively low dose of 0.5 Gy for dose assessments in both the routine (∼200–2000 cell) and rapid (50 cell) dosimetry scenarios. For the highest dose of 3 Gy, the Merkle method gave the most accurate coverage, and for the intermediate chosen dose of 1.5 Gy, the ISO/MBD methods were the most successful. The MULTIBIODOSE simplification provides more conservative dose estimation uncertainties than the ISO method, due to the fact that the largest covariance of the calibration curve fitting is negative (). The IAEA simplification is not always conservative, in contrast to the more detailed Merkle methodology which includes both scoring uncertainty and error on the curve coefficients (IAEA Citation2011; Higueras et al. Citation2015), and thus which results in the largest uncertainties.
Further, and demonstrate that when the uncertainty on dose is accounted for by assigning categories based on probability, albeit in a very simplified manner, it is possible that an incorrect categorization may result. For instance, demonstrates that at 1 Gy, as might be expected, there is a probability of approximately 50% that the estimated dose would be placed in the <1 Gy category and approximately 45% that the dose would be placed in the 1–2 Gy category. This highlights the qualitative nature of such categorization. For the ISO, MBD, IAEA and Merkle methodologies, the method of accounting for uncertainty in this publication, by relying on the standard normal distribution, is rather simplistic as the aim is to demonstrate that uncertainty may have a more important role than has previously been considered for emergency biodosimetry. In addition, the R2 regression confidence factor (corresponding to the confidence limit of the Chi-square distribution) was chosen as 7.81 for 95% coverage (IAEA Citation2011). However, some authors have suggested that for the Merkle method, this results in overestimation of the uncertainty, and thus a lower coverage factor should be applied (IAEA Citation2011). This requires further investigation.
General considerations for uncertainty for biodosimetry have recently been addressed by several authors (e.g. Szłuińska et al. Citation2007; Vinnikov et al. Citation2010). Several publications have demonstrated that distributions other than the Poisson may be more applicable to yields of chromosome aberrations (e.g. Ainsbury et al. Citation2013; Higueras et al. Citation2015, Oliveira et al. Citation2016), for example, and thus it is possible that radiation dose estimates may be more accurately described by alternative distributions to the Poisson. The Bayesian approach allows much more accurate characterization of the dose distribution as it is based on the combined information regarding the potential dose and exposure scenario, the calibration coefficients and the yield of aberrations. It should be noted that in some circumstances, the Bayes method applied here, as illustrated in , gives the lowest probability of the ‘correct’ categorization. This stems from the fact that the Bayesian approach intrinsically incorporates the prior information provided and, in this case the least informative approach to Bayesian calculations was also taken here: using an improper uniform dose prior which would be applied in a real life situation if there was no prior dose information available (as does sometimes occur). A more sophisticated analysis based on more appropriate priors for the specific exposure scenario should yield much improved results in real life analyses.
An additional limitation of this study is that only a small amount of data has been tested, and in most cases simplified assumptions have been applied – for instance the use of 50 cells, an exposure time of 10 h and a t0 of 2 h throughout. For the gamma-H2AX assay in particular, although the idea to include a reference sample as a positive control has been incorporated into the uncertainty calculations, several additional experimental variables have been ignored. For instance, in a real life accident exposure scenario, it is highly unlikely that samples would be taken after exactly 4 or 24 h, thus a correction for time should also be included. Indeed, in practice, the uncertainty imparted as a result of all the additional experimental factors needs further consideration in order that these can be fully incorporated into the uncertainty budget.
Further, while the ISO recommendations for uncertainty characterization, based on propagation of errors, can readily be applied to the full range of assays and exposure scenarios explored in this manuscript, the IAEA manual methods are geared towards dicentric analysis following only one specific scenario of acute, high dose rate, low linear energy transfer exposures up to approximately 5 Gy (i.e. those resulting in well-defined linear quadratic dose response relationships up to the ‘saturation dose’; IAEA Citation2011). While these methods were judged to be applicable for the micronucleus assay, and have thus been applied here for both assays in the HDR scenario, it was not judged to be suitable for the other scenarios and assays included in this manuscript. Further work would be required to develop similar simplified methodologies for the gamma-H2AX and PCC assays and for chronic exposures. Also for partial body exposures, which have not been considered in this article.
The calibration curves, assays and exposure scenarios analyzed in this work were chosen in an attempt to sample a wide range of potential situations in which dosimetry might be required. This includes taking a manually scored dicentric curve (i.e. one created by eye rather than by automated dicentric detection) and applying it in acute and chronic exposure scenarios; an automated micronucleus assay curve applied similarly; applying the gamma-H2AX assay for dose assessment at 4 and 24 h, and comparing all these with the PCC assay methodology used in RENEB (Terzoudi et al. Citation2016). Nevertheless, further work will be required to fully assess the impact of all experimental variables in the full range of potential exposure scenarios on the magnitude of the uncertainty. The uncertainties for the additional RENEB/EURADOS operational assays – EPR and OSL – should also be considered in detail, as should those for the newer methods such as thermoluminescence spectroscopy and gene expression which are now being tested and validated (Ainsbury et al. Citation2016). The obvious place for this work and the associated biological and physical development would be as part of RENEB/EURADOS joint exercises going forward.
Overall, in terms of impact on rapid biodosimetry categorization, the results from the RENEB accident simulation exercise show that inclusion of uncertainty has a relatively low impact. However, for doses between ∼1.7 and 2 Gy (within the assumptions of this study), it is possible that individuals may be incorrectly categorized as being of 2 Gy or higher and, more importantly from a medical point of view, for exposures just above 1 Gy there is a clear risk of miscategorization as a 0–1 Gy event. While the above results show that the probability of misclassification increases towards the categorization boundaries (i.e. close to 1 or 2 Gy), a sensible approach in any case might be to check the positions of the 95% confidence limits which will give an indication of the likelihood that the dose and category have been correctly assigned.
It is undoubtedly hugely important for practising members of the international biodosimetry community to have a good grasp of the uncertainties associated with dose estimates in both routine and emergency response scenarios. This comparison of methods has thus been useful in providing a benchmark for the likely levels of uncertainty that will be observed, albeit with the limitations listed above. However, an important point for consideration is whether it will be possible to include the uncertainty estimates in the rapid biodosimetry categorization procedure and, further, whether the medical professionals to whom the dose information will be provided will be interested in the accuracy of the results. The first part of this question was considered in part during the MULTIBIODOSE final biodosimetry triage categorization exercise. The results showed that, considering dose alone, approximately 70% of samples were correctly categorized. However, it was found that incorporating uncertainty estimates into the analysis did not improve dose categorization results, rather the opposite (Ainsbury et al. Citation2014). For the second part of the question, the current consensus within the field is that in a radiation emergency, the acute phase responders will not have time to deal with uncertainty estimates in addition to dose estimates; rather it will be sufficient to say that the retrospective dosimetry estimates provided are highly uncertain, but are the best that can be done given the constraints of acting in fast assessment mode. However, to the knowledge of the authors, this has not yet been discussed in detail with the relevant stakeholders, and thus further work to clarify the related issues will be essential before further development can take place.
Conclusions
Four methods of uncertainty estimation for radiation biodosimetry have been tested and compared. As expected, the Bayesian approach detailed in this publication intrinsically provides the most complete assessment of dose in the form of a posterior probability distribution. However, the approaches recommended by the ISO standard, the IAEA manual (including the Merkle methodology) and the simplified MBD version were comparable in their performance and thus all methods have been shown to characterize uncertainty reasonably well for the purposes of retrospective dosimetry to support emergency response.
The results of this work highlight the importance of accurate characterization of dose uncertainties, which can directly impact rapid biodosimetry categorization of suspected exposed individuals. However, the practical implications of incorporating assessment of uncertainty into fast assessment results provided to medical professionals need to be further considered.
Acknowledgements
The authors would also like to express our thanks to the rest of our RENEB, MULTIBIODOSE and EURADOS colleagues, particularly the management boards, for supporting this work.
Disclosure statement
The authors report no conflicts of interest. The authors alone are responsible for the content and writing of the paper.
References
- Abend M, Badie C, Quintens R, Kriehuber R, Manning G, Macaeva E, Njima M, Oskamp D, Strunz S, Moertl S, et al. 2016. Examining radiation-induced in vivo and in vitro gene expression changes of the peripheral blood in different laboratories for biodosimetry purposes: first RENEB gene expression study. Radiat Res. 185:109–123.
- Ainsbury EA, Badie C, Barnard S, Manning G, Moquet JE, Abend M, Bassinet C, Bortolin E, Bossin L, Bricknell C, et al. 2016. Integration of new biological and physical retrospective dosimetry methods into EU emergency response plans – joint RENEB and EURADOS interlaboratory comparisons. Int J Radiat Biol, in this issue. doi:10.1080/09553002.2016.1206233.
- Ainsbury EA, Barnard S, Barrios L, Fattibene P, de Gelder V, Gregoire E, Lindholm C, Lloyd D, Nergaard I, Rothkamm K, et al. 2014. Multibiodose radiation emergency triage categorization software. Health Phys. 107:83–89.
- Ainsbury EA, Vinnikov VA, Maznyk NA, Lloyd DC, Rothkamm K. 2013. A comparison of six statistical distributions for analysis of chromosome aberration data for radiation biodosimetry. Radiat Prot Dosimetry. 155:253–267.
- Barquinero JF, Barrios L, Caballín MR, Miró R, Ribas M, Egozcue J. 1995. Establishment and validation of a dose-effect curve for gamma-rays by cytogenetic analysis. Mutat Res. 326:65–69.
- Barnard S, Ainsbury EA, Al-hafidh J, Hadjidekova V, Hristova R, Lindholm C, Monteiro Gil O, Moquet J, Moreno M, Rößler U, et al. 2015. The first gamma-H2AX biodosimetry intercomparison exercise of the developing European biodosimetry network RENEB. Radiat Prot Dosimetry. 164:265–270.
- Brzozowska B, Ainsbury E, Baert A, Beaton-Green L, Barrios L, Barquinero JF, Bassinet C, Beinke C, Benedek A, Beukes P, et al. 2016. RENEB accident simulation exercise. Int J Rad Biol, in this issue. doi:10.1080/09553002.2016.1206230.
- Depuydt J, Baeyens A, Barnard S, Beinke C, Benedek A, Beukes P, Buraczewska I, Darroudi F, De Sanctis S, Dominguez I, et al. 2016. RENEB intercomparison exercises analyzing micronuclei (Cytokinesis-block Micronucleus Assay). Int J Radiat Biol, in this issue. doi:10.1080/09553002.2016.1206231.
- Higueras M, Puig P, Ainsbury EA, Rothkamm K. 2015. A new inverse regression model applied to radiation biodosimetry. Proc Royal Soc. A 471 (2174):20140588.
- International Atomic Energy Agency (IAEA). 2011. Cytogenetic dosimetry: applications in preparedness for and response to radiation emergencies. Vienna: IAEA EPR-Biodosimetry Series [Internet]; [cited 2016 March 15]. Available from: http://www-pub.iaea.org/MTCD/publications/PDF/EPR-Biodosimetry%202011_web.pdf.
- International Organization for Standardisation (ISO). 2014. ISO 19238:2014: Radiological protection – performance criteria for service laboratories performing biological dosimetry by cytogenetics. Geneva: ISO Standard. Available from: http://www.iso.org.
- Jaworska A, Ainsbury EA, Fattibene P, Lindholm C, Oestreicher U, Rothkamm K, Romm H, Thierens H, Trompier F, Voisin P, et al. 2015. Operational guidance for radiation emergency response organisations in Europe for using biodosimetric tools developed in EU MULTIBIODOSE project. Radiat Protect Dosimetry. 164:165–169.
- Karachristou I, Karakosta M, Pantelias A, Hatzi VI, Dimitriou P, Pantelias G, Terzoudi GI. 2015. Triage biodosimetry using centromeric/telomeric PNA probes and Giemsa staining to score dicentrics or excess fragments in non-stimulated lymphocyte prematurely condensed chromosomes. Mutat Res Genet Toxicol Environ Mutagen. 793:107–114.
- Kulka U, Abend M, Ainsbury E, Badie C, Barquinero JF, Barrios L, Beinke C, Bortolin E, Cucu A, De Amicis A, et al. 2016. RENEB – Running the European Network of biological dosimetry and physical retrospective dosimetry. Int J Radiat Biol. 92. doi:10.1080/09553002.2016.1206233.
- Kulka U, Ainsbury L, Atkinson M, Barnard S, Smith R, Barquinero JF, Barrios L, Bassinet C, Beinke C, Cucu A, et al. 2015. Realising the European Network of Biodosimetry: RENEB – status quo. Radiat Protect Dosimetry. 164:42–45.
- Merkle W. 1983. Statistical methods in regression and calibration analysis of chromosome aberration data. Radiat Environ Biophys. 21:217–233.
- Moquet JE, Barnard S, Staynova A, Lindholm C, Monteiro Gil O, Martins V, Rößler U, Vral A, Vandevoorde C, et al. 2016. The second gamma-H2AX assay inter-comparison exercise carried out in the framework of the European biodosimetry network (RENEB). Int J Radiat Biol, in this issue. doi:10.1080/09553002.2016.1207822.
- Moriña D, Higueras M, Puig P, Ainsbury EA, Rothkamm K. 2015. radir package: an R implementation for cytogenetic biodosimetry dose estimation. J Radiolog Protect. 35:557–569.
- Oestreicher U, Samaga D, Ainsbury E, Antunes AC, Baeyens A, Barrios L, Beinke C, Beukes P, Blakely WF, Cucu A, et al. 2016. RENEB intercomparisons applying the conventional Dicentric Chromosome Assay (DCA). Int J Radiat Biol, in this issue. doi:10.1080/09553002.2016.1233370.
- Oliveira M, Einbeck J, Higueras M, Ainsbury E, Puig P, Rothkamm K. 2016. Zero-inflated regression models for radiation-induced chromosome aberration data: A comparative study. Biometrical J. 85:259–279
- R Core Team, R Foundation for Statistical Computing. 2014. R: A language and environment for statistical computing. 2014. Vienna, Austria: R Core Team. Available from: http://www.R-project.org/.
- Romm H, Ainsbury E, Barnard S, Barrios L, Barquinero JF, Beinke C, Deperas M, Gregoire E, Koivistoinen A, Lindholm C, et al. 2013. Automatic scoring of dicentric chromosomes as a tool in large scale radiation accidents. Mutat Res. 756:174–183.
- Romm H, Ainsbury E, Barnard S, Barrios L, Barquinero JF, Beinke C, Deperas M, Gregoire E, Koivistoinen A, Lindholm C, et al. 2014. Validation of semi-automatic scoring of dicentric chromosomes after simulation of three different irradiation scenarios. Health Phys. 106:764–771.
- Rothkamm K, Barnard S, Ainsbury EA, Al-Hafidh J, Barquinero JF, Lindholm C, Moquet J, Perälä M, Roch-Lefèvre S, Scherthan H, et al. 2013. Manual versus automated γ-H2AX foci analysis across five European laboratories: can this assay be used for rapid biodosimetry in a large scale radiation accident? Mutat Res. 756:170–173.
- Sullivan JM, Prasanna PGS, Grace MB, Wathen L, Koerner JF, Coleman CN. 2013. Assessment of biodosimetry methods for a mass-casualty radiological incident: medical response and management considerations. Health Phys. 105:10.
- Swartz HM, Williams BB, Flood AB. 2014. Overview of the principles and practice of biodosimetry. Radiat Environ Biophys. 53:221–232.
- Szłuińska M, Edwards A, Lloyd D. 2007. Presenting statistical uncertainty on cytogenetic dose estimates. Radiat Prot Dosimetry. 123:443–449.
- Terzoudi G, Pantelias G, Darroudi F, Barszczewska K, Buraczewska I, Depuydt J, Georgieva D, Hadjidekova V, Hatzi VI, Karachristou I, et al. 2016. Dose assessment inter-comparisons within the RENEB network using G0-lymphocyte prematurely condensed chromosomes (PCC assay). Int J Radiat Biol, in this issue. doi:10.1080/09553002.2016.1234725.
- Thierens H, Vral A, Vandevoorde C, Vandersickel V, de Gelder V, Romm H, Oestreicher U, Rothkamm K, Barnard S, Ainsbury E, et al. 2014. Is a semi-automated approach indicated in the application of the automated micronucleus assay for triage purposes? Radiat Protect Dosimetry. 159:87–94.
- Vinnikov VA, Ainsbury EA, Maznyk NA, Lloyd DC, Rothkamm K. 2010. Limitations associated with analysis of cytogenetic data for biological dosimetry. Radiat Res. 174:403–414.