
Abstract
Purpose: Two quality controlled inter-laboratory exercises were organized within the EU project ‘Realizing the European Network of Biodosimetry (RENEB)’ to further optimize the dicentric chromosome assay (DCA) and to identify needs for training and harmonization activities within the RENEB network.
Materials and methods: The general study design included blood shipment, sample processing, analysis of chromosome aberrations and radiation dose assessment. After manual scoring of dicentric chromosomes in different cell numbers dose estimations and corresponding 95% confidence intervals were submitted by the participants.
Results: The shipment of blood samples to the partners in the European Community (EU) were performed successfully. Outside the EU unacceptable delays occurred. The results of the dose estimation demonstrate a very successful classification of the blood samples in medically relevant groups. In comparison to the 1st exercise the 2nd intercomparison showed an improvement in the accuracy of dose estimations especially for the high dose point.
Conclusions: In case of a large-scale radiological incident, the pooling of ressources by networks can enhance the rapid classification of individuals in medically relevant treatment groups based on the DCA. The performance of the RENEB network as a whole has clearly benefited from harmonization processes and specific training activities for the network partners.
Introduction
The dicentric chromosome assay (DCA), is considered the ‘gold standard’ for radiation biodosimetry (Blakely et al. Citation2009), and as an important tool for radiation dose assessment in small-scale and large-scale radiation accidents. It is necessary to establish an operational network in biodosimetry to handle large numbers of potentially overexposed victims for mutual assistance in case of an emergency. A requirement for acting as an operational network is to achieve comparable results and to apply high-performance standards by all network partners in the techniques used. Quality controlled inter-laboratory exercises were carried out within the RENEB (Realizing the European Network of Biodosimetry) project to guarantee and continuously optimise these basic principles for the DCA. Activities to further enhance performance quality have been identified and implemented in the operational basis of the RENEB network (Kulka et al. Citation2012, Citation2015). For this purpose two practical exercises were organized. The first exercise (1st), included 18 participating laboratories of the RENEB consortium and was organised in two parts (A and B). Initially, part A consisted of the scoring of electronically provided images with the aim of harmonizing scoring criteria between the RENEB partners. The results and further details of this work are described in the paper by Romm et al. (Citation2016), included in this special issue. In part B a realistic accident situation was simulated by sending irradiated blood samples to the participating RENEB partners. In addition to the dose estimations, culture conditions and dose effect curves used by each partner for dose calculations were reported. Based on the outcome of this 1st intercomparison, recommendations to reduce inter-laboratory variability and the opportunity for training events in RENEB partner laboratories were offered before the second exercise (2nd) was initiated. This 2nd intercomparison was intended to be on a global level and the number of participants was significantly increased. In addition to RENEB partners, RENEB candidate laboratories, those intending to join the network in the future, and networks and institutions outside the European community were included. The aim was to survey the performance of the RENEB network and assess the level of improvement since the first exercise, and in addition to compare the results on an international level.
In total, 42 laboratories from 31 countries participated in this global second exercise. The general study design included blood shipment, sample processing, analysis of chromosome aberrations and dose assessment. Blood samples from healthy donors were irradiated in vitro with gamma rays in one laboratory and coded aliquots were sent to the participants. The task was to culture blood lymphocytes and prepare cytogenetic slides according to each laboratories’ standard protocol. Radiation doses were assessed based on the observed yield of aberrations with reference to an appropriate calibration curve in each laboratory. The aim was to determine whether the estimated radiation doses of the participating laboratories were in good agreement with the actual given dose, or if there was a need for further training and harmonization within RENEB.
Materials and methods
Irradiation and shipment
1st exercise, Part B
Eighteen laboratories from 14 European countries involved in the RENEB consortium joined the first quality controlled exercise for the dicentric chromosome assay (DCA) in March 2013. Blood samples (10 ml heparinized tubes) from four healthy donors, three female (22, 38 and 52 years) and one male person (45 years) were irradiated with 137-Cs gamma rays (dose rate 0.495 Gy/min) in a HWM D 2000 unit (Wälischmiller Engineering GmbH, Markdorf, Germany; formerly Hans Wälischmiller GmbH). Peripheral blood samples were obtained, with informed consent, from healthy adult donors, in accordance with ethics approval no. 12084. All blood tubes for each dose point were irradiated simultaneously. In , the radiation details and donor information are given. For one blood sample (coded as RENEB 2), a partial body exposure (PB) was simulated, irradiated blood and unirradiated blood of one donor was mixed in a 1:1 ratio (50% irradiated blood volume). For the simulation of whole-blood exposure (WB) blood samples (coded as RENEB 1,3,4) were homogenously irradiated.
Table 1. Details of irradiation of blood samples for 1st and 2nd exercise and donor information are given.
After a repair time of 2 h at 37 °C the blood was aliquoted to 2 and 5 ml tubes or retained in the 10 ml tubes depending on the total amount of blood needed by the participating laboratories. Blood samples were then coded and sent to the participants of the exercise. Shipment was performed by express service as UN 3373 Biological Substance Category B described in detail in the manual of the International Atomic Energy Agency (IAEA Citation2011). Each package of blood samples included a temperature logger and a dosimeter to monitor the temperature and any dose received by the samples during transport.
2nd exercise
The 2nd exercise in October 2014 also simulated a realistic accident situation and was carried out in a similar manner to the 1st exercise procedure. Two coded blood samples (RENEB 5 and 6) from two healthy donors were homogenously irradiated and distributed to the participating laboratories. The procedure and equipment (HWM D 2000) were the same as for the 1st exercise part B ().
Nineteen RENEB partners from 14 European countries and four laboratories from three European countries, not included in the RENEB project at this time (known as RENEB candidates) were involved in this 2nd intercomparison. In addition, non EU partners, 19 labs from 16 countries (Asian Network, Canada Network and United States partners, Latin America Network, South African Partners, members of BioDoseNet/WHO, members of IAEA Network) participated in this second exercise.
In total 42 laboratories from 31 countries from all over the world participated in this global exercise using the DCA for dose assessment. Shipments were performed in the way as for the 1st exercise. The shipment to three laboratories outside of the European Community had to be repeated, using a specialized shipment service for diagnostic materials. For these shipments a temperature controlled transportes box (15–25 °C) was used.
Cell cultures and dicentric chromosomes analysis (DCA) (1st and 2nd exercise)
Each laboratory was requested to set up at least two lymphocyte cultures per sample following their own standard protocols, and considering the IAEA recommendations (IAEA Citation2011) and International Organization for Standardization (ISO) standards (ISO 19238: Citation2014; ISO 21243: Citation2008). Cell cycle controlled scoring was applied according to the standard protocols of each particular Laboratory. Information about culture variables and calibration curve details have been requested in the scoring sheet as well.
For the non EU networks the sample processing, slide preparation and staining were conducted for each regional or supra-regional network at one particular contact laboratory in Canada, South Africa, Uruguay or Japan. From these central laboratories, slides for each sample were then distributed to the participating network laboratories. The analyses were performed according to the RENEB standard scoring sheet which was provided to the participants (50 cells/slide and two slides/dose-point). The results (dose estimates, dicentric frequency and scoring sheets) were returned to the contact laboratory for each regional or supra-regional network for compilation.
The manual scoring of dicentric chromosomes (Dic) was adapted to handle a large number of samples. Therefore dose estimations were performed based on the yield of aberrations analyzed in 20, 30 and 50 cells/slide. In total two slides (a, b) with up to 50 cells each were analyzed per dose point by each laboratory. To facilitate the comparison of the scoring results, a harmonized scoring sheet was circulated to all participants.
Dose assessment
For dose estimation the laboratories used their own calibration curves based on dicentric chromosomes (Dic) or dicentric chromosomes plus centric rings (Dic + cR) according to the particular established protocol. All calibration curves were generated by fitting the yield of aberrations to linear-quadratic dose dependencies. The dose estimations were performed with the free software CABAS V2.0 (Deperas et al. Citation2007) or different versions of Dose-Estimate (Ainsbury and Lloyd Citation2010), except for three laboratories who used their own software. The partners estimated a dose in gray (Gy) and the corresponding 95% confidence intervals according to the number of dicentrics or dicentrics plus centric rings scored. To identify partial body exposure, the distribution of dicentrics was analysed for deviation from Poisson with the Papworth u-test. In case the u-test was significant, a partial body dose was estimated together with the irradiated volume of the body using the Dolphin method (IAEA Citation2011), assuming a mean lethal dose of 3.5 Gy for gamma rays (Matsubara et al. Citation1974).
Statistics
The coefficient of variation (CV), trueness and z-values were calculated as described by Di Giorgio et al. (Citation2011), according to ISO 5725 (ISO 5725, Citation1998) and ISO 13528 (ISO 13528, Citation2005). The CV was used to compare the reproducibility of the dose assessments and was defined as the ratio SR/x* in percent, where SR is the robust standard deviation and x* is the robust average. The trueness was calculated as (x*- true dose)/x* and represents the agreement between the robust estimated average dose of the participating laboratories and the applied true dose. In addition, for each estimated dose a z-score of the dose was calculated. The z-score allows classification of the participants’ results as satisfactory (| z | < 2), questionable (2 < | z | <3) and unsatisfactory (| z | > 3) (IAEA Citation2011).
Results
Shipment
Almost all blood samples in both exercises were delivered within 24 h inside the European Community without any difficulties. Two RENEB labs received the samples directly because they were next to the irradiation facility. For one RENEB partner the delivery was slightly delayed and arrived in the laboratory after 28 h.
The dosimeters used during all shipments did not record any dose above 1 mSv. The thermologgers showed a wide range between 11 and 30 °C for the 1st exercise and between 11 and 29 °C for the 2nd exercise.
For the shipments outside the European Community (Canada, South Africa, Japan, Uruguay, Serbia) carried out in October 2014 only the packages to Japan and South Africa reached their destination, but with a considerable delay: 63 h for Japan and 75 h for South Africa. However, in both cases cell culture and chromosome analysis was still possible. The packages to Canada and Uruguay never left Europe, even though the shipment was done in accordance with the regulations and packing Instructions 650 for Biological Substances, Category B, because of restrictive customs issues. The package to Serbia, although in Europe but not within the European Union (EU), exceeded a delivery period of 96 h. It was decided to stop the shipments to Serbia, Canada and Uruguay because of these excessive delays and repeat the shipment for the three non-EU partners (Canada, Uruguay and Serbia) using a specialized shipment service for diagnostic materials. The second shipment, unfortunately, had to be postponed due to an ad hoc strike by airline pilots, but finally the blood samples were delivered successfully in temperature controlled transport boxes (15–25 °C). The duration of shipment to Canada was 47 h, Uruguay 44 h and Serbia 46 h.
Variables of lymphocytes culturing
According to the recommendations given after the first intercomparison to the labs with unsatisfactory results, seven RENEB partners adapted the conditions of lymphocyte cultures changing the final concentration of BromodeoxyUridine (5-Bromo-2-DeoxyUridine, BrdU) and/or the concentration and incubation time of Colcemid to increase and improve the quality and quantity of metaphases and to guarantee cell cycle controlled scoring. Two partners also received training in a RENEB partner laboratory. According to the questionnaire received from the participants almost all laboratories (RENEB partners and RENEB candidates) performed whole blood culturing with Roswell Park Memorial Institute medium (RPMI 1640) as culture media supplemented with fetal calf serum (FCS) (10–25%). For the participating networks outside of Europe the coordination laboratories in Latin America and Asia preferred to isolate lymphocytes for culture performance while the others used whole blood cultures. Here also RPMI 1640 is the medium of choice. Two laboratories (RENEB partners, non-EU laboratories) used Minimum Essential Media (MEM) known to achieve a lower growth rate of blood lymphocytes. For the labs (RENEB, RENEB candidates and non-EU countries) using BrdU for cell cycle control the range of concentration in the final culture mixture varied from 3–12 μg/ml but did not exceed the IAEA recommendations. For mitotic arrest Colcemid was used by 14 RENEB laboratories 2 and 4 h before terminating the cultures with a final concentration of 0.05–10 μg/ml. According to the IAEA manual concentration >0.1 μg/ml can cause problems of cell toxicity. Three labs added Colcemid after 24 h with a lower Colcemid concentration of 0.04 μg/ml – up to a maximum of 0.1 μg/ml.
For two RENEB candidates the cell-cycle controlled scoring was not a standard scoring procedure according to the questionnaires. For the non-Europe participants the contact laboratories responsible for processing the samples and preparing slides had standardized cell cycle-controlled protocols.
Dose effect curves
Most participating laboratories used their own calibration curves for dose estimations from the manually observed aberration frequencies. For the RENEB partners the most commonly used source of radiation used for establishing the dose effect curves was Co-60 or to a lesser extent Cs-137. The dose rate varied between 0.24–1 Gy/min and most labs irradiated at 37 ± 0.5 °C. The quality of the curves differed regarding the cell number analysed (between 1000 and 100,000 cells per curve), and in some curves there was no background frequency. Two laboratories did not have their own curves available and used dose effect curves from the literature or from other laboratories. This approach showed suboptimal results in the first exercise. As a consequence, one of these two laboratories established a new calibration curve by increasing the number of analyzed cells and the other lab adapted their curve fitting procedure.
The majority of the RENEB candidates and non-EU participants had established their own dose effect curves for Co-60 gamma rays and some for Cs-137. The dose rates used for the curves were 0.09–1.16 Gy/min. Most of the participants irradiated the blood samples for the dose effect curve at room temperature. The number of analyzed cells used for curve fitting was in the range of 1500–28,000 cells.
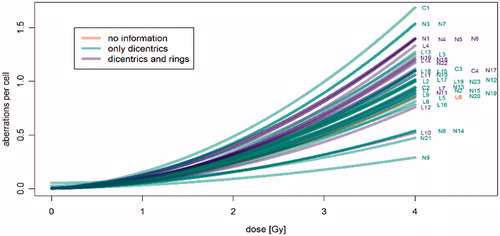
The shape of the dose effect curves for all participants is shown in . A total of 28 labs used the frequency of dicentric chromosomes to establish their curve and for dose estimations. The other 14 laboratories included dicentric chromosomes plus centric rings.
Figure 1. Dose effect curves of the participating laboratories used for dose assessment based on dicentrics, dicentrics and rings or no information was given in the scoring sheet. RENEB partner laboratories (L), RENEB candidates (C) and non-EU organizations (N).
Dose estimation
The dose estimations were performed by all participating laboratories either with the free software CABAS V2.0 (Deperas et al. Citation2007) or different versions of Dose-Estimate (Ainsbury and Lloyd Citation2010), three participants used their own software tools. The 95% confidence interval was given using different methods, combined Poisson error or exact Poisson error (detailed description or details are given in IAEA Citation2011).
In both exercises, two laboratories from the RENEB consortium, but different for the 1st and the 2nd exercise, could not analyze enough cells for dose estimations because the culturing of the blood samples was unsatisfactory or failed completely. There was no obvious reason for the failures and no relation to culture media or additives was apparent. In order to contribute to the intercomparison with a dose-estimation, these labs received cell suspension or slides from another partner for scoring. The ‘Quick score’ method, counting of clearly visible dicentrics in apparently complete cells, described in detail by Flegal et al. (Citation2010), was applied by one lab, all other labs scored complete cells with verifiable 46 centromeres (as detailed in IAEA Citation2011).
In the 1st exercise only the RENEB partners were included. Each laboratory was able to identify correctly the sham control, the low and the high dose sample as well as the partial body sample. The accuracy of the dose estimations was very good for the control and the low dose point (0.94 Gy). When considering a ± 0.5 Gy uncertainty interval, based on the number of cells scored, for the true dose of 0.94 Gy, 81% of the reported dose estimations were correctly classified. The dose range according to the reported dose assessments was between 0.26 and 1.85 Gy and the z-test from two laboratories gave questionable values.
The results for the high dose point (3.27 Gy) were less clear in the 1st exercise. While the z-values were satisfactory for the majority of the estimated doses, only 40% of the dose estimations were correctly classified and within the ±20% uncertainty interval, used for the high dose point. The dose range according to the reported dose assessments was 2.2–5.6 Gy. Based on these findings, the need to optimize the results by identifying weak spots in the laboratories performance and to conduct training events was evident.
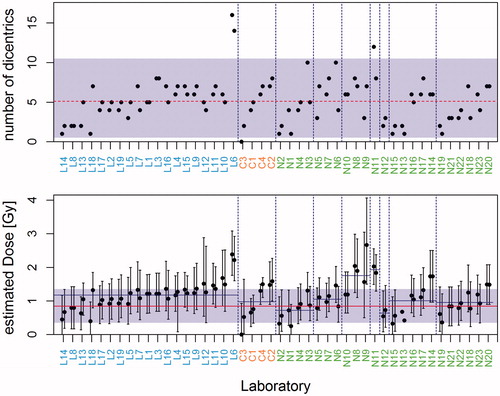
In the 2nd exercise, the lower true physical dose for irradiation of one blood sample RENEB 5 (Re5) was 0.85 Gy. In the diagram on the top shows a very good agreement of the number of dicentrics in 50 cells/slide for all the participating laboratories with the theoretically expected range. This range refers to the mean number of dicentrics of all laboratories (5.13 dics/50 cells; dashed line in top) and the assumption that dicentrics follow a Poisson distribution. Only three labs reported a number of aberrations outside of this range (one for two slides and two for one slide). This is noteworthy as 1–9 outliers are expected on statistical grounds for the 92 dose estimates produced by the laboratories. The estimated doses and 95% confidence intervals for all slides (, bottom) show a tendency for overestimation of the physical dose (solid line). The mean estimated dose for RENEB partners/RENEB candidates/and non-EU partners in 50 cells was 1.18/0.98/1.07 Gy, respectively. Two out of the nine networks reported an average dose (not solid line) lower than the physical dose and seven networks a higher dose; 65 (71%) out of 92 estimates fell into the tolerance region (0.85 ± 0.5 Gy, shaded area) and 73 (79%) out of 92 confidence intervals (alpha 95%, vertical lines) included the true physical dose.
Figure 2. 2nd intercomparison – 0.85 Gy (Re 5) – top: Number of dicentrics in 50 cells scored for both slides of all participating laboratories, RENEB partners (L1–L19), the RENEB candidates (C1–C4) and non-EU partners (N1–N23) (dots), the theoretical expectation range (shaded area) referring to the mean number of dicentrics of all laboratories (5.13 dics/50cells; dashed line) and the assumption that dicentrics are Poisson distributed. bottom: Estimated doses and 95% confidence intervals for all slides, physical dose (solid line), average dose (not solid line) and tolerance region (0.85 ± 0.5 Gy, shaded area).
The true physical dose was 2.7 Gy for the blood sample RENEB 6 (Re6). In the results for the number of aberrations scored (top) and the doses estimations (bottom) are shown. In total, the number of dicentrics analyzed in 50 cells/slide show a good agreement with the expected theoretical range (shaded area). Some 1–9 outliers are theoretically expected to lie outside of this range whereas both slides for one dose-point are unlikely to fail without a systematic factor. Eight of the participating labs were found outside the range, four with one and four with two slides. Generally, the estimated doses and 95% confidence intervals for all slides show again a tendency for an overestimation of the physical dose (solid line) by 12 labs. One laboratory (L8) reported an underestimation with two slides outside of the tolerance region.
Figure 3. 2nd intercomparison – 2.7 Gy (Re 6) – top: Number of dicentrics in 50 cells scored for both slides of all participating laboratories, RENEB partners (L1–L19), the RENEB candidates (C1–C4) and non EU partners (N1–N23), (dots); the theoretical expectation range (shaded area) referring to the mean number of dicentrics of all laboratories (28.8 dics/50 cells; dashed line) and the assumption that dicentrics are Poisson distributed. bottom: Estimated doses and 95% confidence intervals for all slides, the physical dose (solid line), the mean dose (not solid line) and the tolerance region (2.7 Gy ±20%, shaded area).
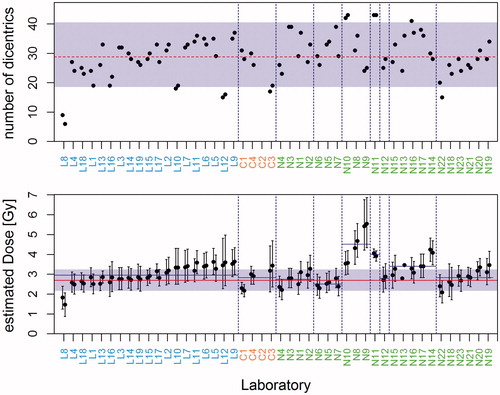
A total of 55 (61%) out of 90 estimates fall into the tolerance region (2.7 Gy ±20%, shaded area) and 60 (67%) confidence intervals (alpha 95%, vertical lines) include the physical dose. One out of nine networks reported an average dose (not solid line) lower than the physical dose, with all of the others reporting a higher average dose.
shows the z-scores for all the estimated doses based on 50 cells/slide (from left to right: Re5a, Re5b, Re6a, Re6b). These were used to evaluate the performance of the networks as a whole. Questionable results (2 < | z | < 3) for at least one slide at one dose were reported by one RENEB laboratory (L8). One lab of the RENEB partners (L6) shows unsatisfactory high results (| z | ≥ 3) for the low dose point. In general a tendency for overestimation of the doses (z > 0) was observed. Some labs systematically reported an overestimate of the dose but they are still satisfactory in all reported values (L7, L9, L10, L11, L12).
Figure 4. The z-scores for all estimated doses based on 50 cells/slide for all participating labs, RENEB partners (L1–L19), the RENEB candidates (C1–C4) and non-EU partners (N1–N23). ![]()
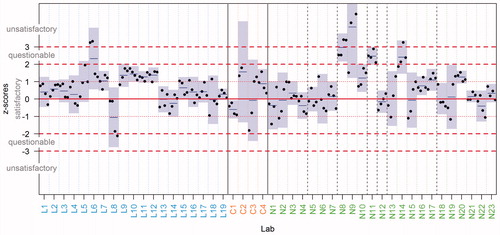
For the RENEB candidates all results were in the satisfactory range, even though, the number of scored cells were very low by two laboratories, therefore showing larger 95% confidence interval of the mean. For the non-EU partners, even the laboratories which received the blood samples with a considerable delay (N10 and N12) obtained satisfactory results, except for two laboratories (N8 (this laboratory participated twice, N8 is also N14) and N9) as shown by the questionable and unsatisfactory z-scores.
Classification of dose estimations
The classification of blood samples into medically relevant doses is required to support the medical management of patients in emergency situations. Therefore the percentage of incorrectly classified samples was calculated for the two dose-points used in the global exercise and for the different number of scored cells (20, 30 and 50 cells) (). For the low dose point, 0.85 Gy, an incorrect classification of samples was defined as ≥2 Gy. For the high dose point the criteria was ≤1 Gy for a misclassification. In , the results show that for the low dose point the percentage of incorrect classifications was between 5.4 and 7.9%, scoring 50–20 cells, respectively, for all participants. Clearly, increasing the number of scored cells from 20–50 had little effect on the misclassification of this dose. For the high dose-point (2.7 Gy) there were no incorrect classifications for any group of labs and different number of cells scored.
Table 2. Classification of dose estimations performed in the frame of the 2nd intercomparison reported by the RENEB partners, RENEB candidates and non-EU laboratories for low dose (0.85 Gy) and high dose (2.7 Gy) for 20, 30 and 50 cells scored.
Discussion
The dicentric chromosome assay (DCA) is an important tool in biological dosimetry to estimate an individual absorbed dose to lymphocytes in peripheral blood (Voisin et al. Citation2004; Romm et al. Citation2009; Wilkins et al. Citation2011). The standardization and harmonization of the method is essential for the successful networking of different laboratories in case of a large-scale emergency situation. The potential and limits of the DCA have been evaluated in the frame of the RENEB project. In contrast to similar activities done previously (Romm et al. Citation2011; Beinke et al. Citation2013; Jaworska et al. Citation2015) the number of laboratories who joined the intercomparison was enhanced and also organizations and established networks outside the European community were included. In total 42 laboratories from 31 countries participated in one of the two intercomparisons and 550 dose estimations for different number of scored cells were recorded and included in the evaluation. Furthermore, European biodosimetry laboratories had the possibility to compare their results, generated within the newly established RENEB network on an international level.
The general study design included shipment of blood samples to the laboratories inside and outside of the European community. The experiences gained from the shipment procedure varied strongly depending on the place of destination. The shipment to the partners within the EU was performed successfully and within 24 h. Outside the European community unacceptable delays were caused by country-specific import regulations and shipments had to be repeated using a specialized and expensive service for diagnostic materials. The results suggest that for large-scale accidents, the shipment of blood samples to non-EU countries is not advisable and can waste valuable time and money. An option would be to include the high expertise of non-EU countries for dose estimation by the use of web-based scoring (see Romm et al. Citation2016). It is obvious that in a real accident situation time is limited and preplanning and exercising for real events are necessary. This includes the preparation of guidelines, information sheets and questionnaires in different languages in advance and to have agreements in place with delivery couriers.
The DCA is a well-established technique but there is not a ‘universal’ protocol used by all biodosimetry laboratories. Despite considerable efforts for harmonization, culture conditions show some range for variability, as reported by the participants of the two RENEB intercomparisons. BrdU and Colcemid concentration differed between laboratories as well as the incubation time with Colcemid. However, in most cases the range fell within the recommendations given in the IAEA manual and ISO documentation. The majority of laboratories have used a cell cycle controlled scoring procedure to avoid an underestimation of doses. Short-term (2–3 h) Colcemid treatment using Fluorescence plus Giemsa (FpG) staining and long-term (24 h) Colcemid treatment are the techniques of choice. Most partners established their own dose effect curves by closely following the IAEA recommendation concerning the dose range (0–5.0 Gy) and the number of dose-points (ideally up to 10). The slope of the curves differed between the partners according to the variations in lab performance and scoring criteria. The use of each lab’s own protocol, based on existing recommendations but established for the particular laboratory, was shown to be appropriate to achieve optimal results in the quality and quantity of metaphases. A crucial point is to apply the same procedure for both, establishing the calibration curve and analyzing chromosome aberrations in case of suspected overexposure. The evaluation of the information sheets revealed that unsatisfactory results for dose estimation were achieved in the intercomparisons when a laboratory did not have their own dose effect curve available. The need for future exercises was also obvious for laboratories scoring systematically too many or too few aberrations and thus providing a dose estimation outside the tolerance region.
In order to guarantee high quality performance within the RENEB network, a long-term training program was designed to maintain reliability of the dose estimate for each assay and for each partner laboratory (Gregoire et al. Citation2016). Here clear criteria for ‘RENEB approbation’ are established. If a given laboratory does not meet several criteria, it is proposed to perform:
Training according to the identified needs. The training can include practical courses including trouble shooting, seminars on QA, statistics, dosimetry, online training (e.g. picture analysis), or other upcoming topics.
The training has to be organized by a qualified laboratory.
Take part in new intercomparisons.
It is also possible to participate in biological dosimetry courses organized by the agencies (IAEA, WHO, IABEARD).
The DCA is highly radiation sensitive, with a threshold for whole-body dose of 0.1–0.2 Gy based on analysis of 1000 metaphase spreads (Wilkins et al. Citation2008). The number of cells analyzed influences the statistical accuracy of the dose estimation. The most reliable results were obtained for individual dose estimates based on analyzing between 500 and 1000 cells. One important strategy for increasing the capacity of the assay in the case of a large accident situation is to increase the number of analyzed persons by reducing the number of analyzed cells to 20 or 50 cells or 30 dicentrics (Lloyd et al. Citation2000). This procedure leads to a larger uncertainty interval, but in the case of a mass casualty scenario, a rapid categorization of potentially overexposed victims into clinically relevant treatment groups is of prime importance (Beinke et al. Citation2013; De Amicis et al. Citation2014). Preliminary individual dose categorization based on a smaller number of cells, is therefore considered as the initial dosimetric information for clinicians to assist the patient management and to identify the ‘worried well’ persons. It is especially important to identify the latter group, comprising people that show radiation sympthoms due to mental stress or pre-existing infection but without having received a corresponding dose, as they could overwhelm medical centers (Kulka et al. Citation2016). In addition, the more accurate, but time-consuming, chromosome dosimetry based on a higer number cells could then be targeted more effectively if required at a later date.
The results produced in the frame of the RENEB project demonstrate very clearly that the classification of the blood samples into medically relevant dose categories was performed very successfully () for lower and higher dose-points by the majority of blood samples analyzed. Therefore the DCA as a part of the operational basis in the RENEB network (Wojcik et al. Citation2016) has to be considered as an important tool to assist in the medical management of radiation injuries. In comparison to the 1st exercise, which also included one low (0.94 Gy) and one high (3.27 Gy) dose, the percentage of correct dose estimations in the 2nd exercise was increased from 39–61% for the high dose-point for the RENEB partners. For the low dose-point, the percentage of correct dose estimations did not change (81–76%). Regularly performed intercomparisons are necessary to identify, improve and maintain the quality of dose estimations from the network.
The relative amount of correctly classified dose estimations did not improve for an acute whole body irradiation, when the number of scored cells was increased from 30–50, for both the low and high dose samples. This confirms results, achieved in previous exercises (MULTIBIODOSE, NATO) that the use of a number of cells as low as 30 or even 20 can give a rough indication of a whole body dose. However it must be kept in mind that larger numbers of cells are appropriate in the case of a partial body irradiation (Lloyd et al. Citation2000). As shown in the MULTIBIODOSE project in order to identify a 50% partial body exposures at 2 Gy with an accuracy of ±0.5 Gy approximately 150 cells would have to be scored (Romm et al. Citation2016).
The joint lab performance in this exercise based on the z-test demonstrates a low number of unsatisfactory results. Overall, a tendency for overestimation of the doses (z > 0) was observed, however the results were still satisfactory in all reported z-values. Investigations performed in the QA/QM program of RENEB evaluated the influence of different calibration conditions on the results of dose estimations within the RENEB partners. Inherent variability on delivered dose from one radiation facility to another can be responsible for systematic bias. More details about this issue are discussed by Trompier et al. (Citation2016) in this special issue.
Conclusions
The two intercomparisons performed in the frame of the RENEB project show very encouraging results for the DCA and validate the assay as an established biodosimetric tool for networks in large-scale radiation scenarios. The pooling of biodosimetry laboratory resources within a network enables a rapid and reliable categorisation of affected persons in medical relevant treatment groups in case of an emergency situation. As a consequence, the network can assist in the clinical and diagnostic needs in emergency situations and contribute to the reassurance of the public by identification of the ‘worried well’ persons.
Acknowledgements
We wish to thank M. Denk, R. Amannsberger and I. Baumgartner for excellent technical assistance and organisational work.
Disclosure statement
The authors report no conflicts of interest. The authors alone are response for the content and writing of the paper.
References
- Ainsbury EA, Lloyd DC. 2010. Dose estimation software for radiation biodosimetry. Health Phys. 98:290–295.
- Beinke C, Barnard S, Boulay-Greene H, De Amicis A, De Sanctis S, Herodin F, Jones A, Kulka U, Lista F, Lloyd D, et al. 2013. NATO Dosimetry Study – Laboratory intercomparison of the dicentric chromosome analysis. Radiat Res. 180:129–137.
- Blakely WF, Carr Z, Chu MC, Dayal-Drager R, Fujimoto K, Hopmeir M, Kulka U, Lillis-Hearne P, Livingston GK, Lloyd DC, et al. 2009. WHO 1st consultation on the development of a global biodosimetry laboratories network for radiation emergencies BioDoseNet). Radiat Res. 171:127–139.
- De Amicis A, De Sanctis S, Di Cristofaro S, Franchini V, Regalbuto E, Mammana G, Lista F. 2014. Dose estimation using dicentric chromosome assay and cytokinesis block micronucleus assay: comparison between manual and automated scoring in triage mode. Health Phys. 106:787–797.
- Deperas J, Szluinska M, Deperas-Kaminska M, Edwards A, Lloyd D, Lindholm C, Romm H, Roy L, Moss R, Morand J, Wojcik A. 2007. CABAS: a freely available PC program for fitting calibration curves in chromosome aberration dosimetry. Radiat Protect Dosim. 124:115–123.
- Di Giorgio M, Barquinero JF, Vallerga MB, Radl A, Taja AR, Seoane A, De Luca J, Oliveira MS, Valdivia P, Lima OG, et al. 2011. Biological dosimetry intercomparison exercise: an evaluation of triage and routine mode results by robust methods. Radiat Res. 175:638–649.
- Flegal FN, Devantier Y, McNamee JP, Wilkins RC. 2010. Quickscan dicentric chromosome analysis for radiation biodosimetry. Health Phys. 98:276–281.
- Gregoire E, Kulka U, Barrios L, Ainsbury E, Bassinet C, Fattibene P, Oestreicher U, Pantelias, G, Terzoudi G, Trompier F, et al. 2016. The harmonization process to set up and maintain an operational biological dosimetry and physical retrospective dosimetry network: QA QM applied to the RENEB network. Int J Rad Biol. 92, in this issue. doi: 10.1080/09553002.2016.1206232.
- International Atomic Energy Agency (IAEA). 2011. Cytogenetic dosimetry: applications in preparedness for and response to radiation emergencies. EPR-biodosimetry. Vienna, Austria: IAEA.
- International Organization for Standardization (ISO). 19238. 2014. Radiation protection-performance criteria for service laboratories performing biological dosimetry by cytogenetics. Geneva: ISO.
- International Organization for Standardization (ISO). 21243. 2008. Radiation protection – performance criteria for laboratories performing cytogenetic triage for assessment of mass casualties in radiological or nuclear emergencies – general principles and application to dicentric assay. Geneva: ISO.
- International Organization for Standardization (ISO). 13528. 2005. Statistical methods for use in proficiency testing by interlaboratory comparisons. Geneva: ISO.
- International Organization for Standardization (ISO). 5725. 1998. Precision of test methods – determination of repeatability & reproducibility for a standard test method by interlaboratory tests. Geneva: ISO.
- Jaworska A, Ainsbury EA, Fattibene P, Lindholm C, Oestreicher U, Rothkamm K, Romm H, Thierens H, Trompier F, Voisin P, et al. 2015. Operational guidance for radiation emergency response organisations in Europe for using biodosimetric tools developed in EU MULTIBIODOSE project. Radiat Protect Dosim. 164:1–5.
- Kulka U, Ainsbury L, Atkinson M, Barquinero JF, Barrios L, Beinke C, Bognar G, Cucu A, Darroudi F, Fattibene P, et al. 2012. Realising the European Network of Biodosimetry (RENEB). Radiat Protect Dosim. 151:621–625.
- Kulka U, Ainsbury L, Atkinson M, Barnard S, Smith R, Barquinero JF, Barrios L, Bassinet C, Beinke C, Cucu A, et al. 2015. Realising the European network of biodosimetry: RENEB-Status Quo. Radiat Protect Dosim. 164:42–45.
- Kulka U, Abend M, Ainsbury E, Badie C, Barquinero JF, Barrios L, Beinke C, Bortolin E, Cucu A, De Amicis A, et al. 2016. RENEB – Running the European Network of biological dosimetry and physical retrospective dosimetry. Int J Rad Biol, in this issue. doi: 10.1080/09553002.2016.1230239.
- Lloyd DC, Edwards AA, Moquet JE, Guerrero-Carbajal YC. 2000. The role of cytogenetics in early triage of radiation casualties. Appl Radiat Isot. 52:1107–1112.
- Matsubara DC, Sasaki MS, Adachi T. 1974. Dose-response relationship of lymphocyte chromosome aberrations in locally irradiated persons J Radiat Res (Tokyo). 15:189–196.
- MULTIBIODOSE. 2012. Multi-disciplinary biodosimetric tools to manage high scale radiological casualties (MULTIBIODOSE) [online]. Available at: www.multibiodose.eu. Accessed 4 April 2014.
- Romm H, Oestreicher U, Kulka U. 2009. Cytogenetic damage analysed by the dicentric assay. Ann Ist Super Sanita. 45:251–259.
- Romm H, Wilkins RC, Coleman CN, Lillis-Hearne PK, Pellmar TC, Livingston GK, Awa AA, Jenkins MS, Yoshida MA, Oestreicher U, Prasanna PG. 2011. Biological dosimetry by the triage dicentric chromosome assay: potential implications for treatment of acute radiation syndrome in radiological mass casualties. Radiat Res. 175:397–404.
- Romm H, Ainsbury E, Bajinskis A, Barnard S, Barquinero JF, Beinke C, Puig-Casanovas R, Deperas-Kaminska M, Gregoire E, Kulka U, et al. 2012. The dicentric assay in triage mode as a reliable biodosimetric scoring strategy for population triage in large scale radiation accidents. Glasgow: IRPA13, Available at: http://www.irpa.net/page.asp?id=54606 TS2.C3. Accessed 29 February 2016.
- Romm H, Ainsbury E, Barquinero JF, Barrios L, Beinke C, Cucu A, Domene M, Filippi S, Monteiro Gil O, Gregoire E, et al. 2016. Web based scoring is useful for validation and harmonisation of scoring criteria within RENEB. Int J Radiat Biol, in this issue. doi: 10.1080/09553002.2016.1206228.
- Trompier F, Baumann M, Barrios L, Gregoire E, Abend M, Ainsbury E, Barnard S, Barquinero JF, Bautista JA, Perez-Calatayud J, et al. 2016. Investigation of the influence of calibration practices on cytogenetic laboratory performance for dose estimation. Int J Radiat Biol, in this issue. doi: 10.1080/09553002.2016.1213455.
- Voisin P, Roy L, Benderitter M. 2004. Why can’t we find a better biological indicator of dose? Radiat Protect Dosim. 112:465–469.
- Wilkins RC, Romm H, Kao TC, Awa AA, Yoshida MA, Livingston GK, Jenkins MS, Oestreicher U, Pellmar TC, Prasanna PG. 2008. Interlaboratory comparison of the dicentric chromosome assay for radiation biodosimetry in mass casualty events. Radiat Res. 169:551–560.
- Wilkins RC, Romm H, Oestreicher U, Marro L, Yoshida MA, Suto Y, Prasanna PG. 2011. Biological dosimetry by the triage dicentric chromosome assay – further validation of international networking Radiat Measure. 46:923–928.
- Wojcik A, Oestreicher U, Barrios L, Vral A, Terzoudi G, Ainsburry E, Rothkamm K, Trompier F, Kulka U. 2016. The RENEB operational basis: complement of established biodosimetric assays. Int J Rad Biol, in this issue. doi: 10.1080/09553002.2016.1235296.