
Abstract
Purpose: Dose assessment intercomparisons within the RENEB network were performed for triage biodosimetry analyzing G0-lymphocyte PCC for harmonization, standardization and optimization of the PCC assay.
Materials and methods: Comparative analysis among different partners for dose assessment included shipment of PCC-slides and captured images to construct dose-response curves for up to 6 Gy γ-rays. Accident simulation exercises were performed to assess the suitability of the PCC assay by detecting speed of analysis and minimum number of cells required for categorization of potentially exposed individuals.
Results: Calibration data based on Giemsa-stained fragments in excess of 46 PCC were obtained by different partners using galleries of PCC images for each dose-point. Mean values derived from all scores yielded a linear dose-response with approximately 4 excess-fragments/cell/Gy. To unify scoring criteria, exercises were carried out using coded PCC-slides and/or coded irradiated blood samples. Analysis of samples received 24 h post-exposure was successfully performed using Giemsa staining (1 excess-fragment/cell/Gy) or centromere/telomere FISH-staining for dicentrics.
Conclusions: Dose assessments by RENEB partners using appropriate calibration curves were mostly in good agreement. The PCC assay is quick and reliable for whole- or partial-body triage biodosimetry by scoring excess-fragments or dicentrics in G0-lymphocytes. Particularly, analysis of Giemsa-stained excess PCC-fragments is simple, inexpensive and its automation could increase throughput and scoring objectivity of the PCC assay.
Introduction
In case of radiological emergency, a considerable number of individuals may be exposed to a wide distribution of doses and, therefore, there is an immediate need to predict clinically relevant responses based on quick and accurate triage biodosimetry methods. The ‘gold standard’ cytogenetic approach (dicentric analysis at metaphase) presupposes lymphocyte stimulation and a two-day culture, failing thus the criterion for rapid dose estimation, which is a high priority in radiation emergency medicine. To overcome this shortcoming, the analysis of radiation-induced chromosomal aberrations in non-stimulated G0-peripheral blood lymphocytes for biodosimetry by means of their fusion with Chinese Hamster Ovary (CHO) mitotic cells using polyethylene glycol (PEG) was first introduced by Pantelias and Maillie (Citation1983, Citation1984, Citation1985a). Specifically, this PCC assay allowed rapid quantification of an exposure by means of the analysis of fragments and rings using Giemsa stain (Pantelias & Maillie Citation1985a, Citation1985b; Lamadrid Boada et al. Citation2013). Subsequently, the PCC assay in combination with the centromeric (C-banding) technique or with the fluorescence in situ hybridization (FISH) methodology was used for the analysis of dicentric chromosomes and translocations directly in G0-lymphocyte prematurely condensed chromosomes (PCC) (Vyas et al. Citation1991; Pantelias et al. Citation1993; Durante et al. Citation1996; Darroudi et al. Citation1998a). Furthermore, the PCC assay was also applied successfully to assess whole and partial body exposure in vivo following irradiation of monkeys (Darroudi et al. Citation1998b). In addition, Fomina et al. (Citation2000, Citation2001) developed and reported on a combination of staining all human centromeres and telomeres with chromosome paint probes in metaphases, in order to assess accurately different types of structural chromosomal aberrations in human lymphocytes, following exposure to radiation of different qualities. Recently, in order to score dicentric and centric ring chromosomes directly in G0-lymphocyte PCC with a level of accuracy not possible previously, the development of centromeric/telomeric (C/T) peptide nucleic acid (PNA) probes in combination with FISH (C/T FISH staining), has offered a new dynamic to the PCC assay (Karachristou et al. Citation2015; M’Kacher et al. Citation2015; Suto et al. Citation2015).
Yet, despite its advantages, dose assessment of an exposure by means of the PCC assay is not at present widely used. In the present work and in the framework of Realizing the European Network of Biodosimetry (RENEB), dose assessment intercomparisons within the RENEB network were carried out performing inter-laboratory exercises using unstimulated blood lymphocyte PCC for harmonization, standardization and optimization of the PCC assay for its use in case of radiological emergency. The experimental design for comparative analysis among the different partners included shipment of PCC slides and galleries of captured images for different doses up to 6 Gy gamma rays in order to obtain calibration data to be used during programmed intercomparisons. Specifically, to unify the PCC methodology and scoring criteria, exercises were carried out among RENEB partners using coded PCC-slides and/or coded irradiated blood samples. Accident simulation exercises for whole or partial body exposure were also carried out. Coded irradiated blood samples or slides were sent to the participating laboratories and analysed in order to assess the suitability of the PEG-mediated cell fusion PCC assay for the rapid categorization of potentially exposed individuals. Overall, the results obtained from the dose assessment intercomparisons showed good agreement within the RENEB network and suggested that the cell fusion PCC assay has the characteristics and potential to become a quick and reliable approach for triage biodosimetry in case of large-scale radiological emergencies.
Materials and methods
Taking into consideration that the PCC assay is technically demanding and not yet widely used, a detailed protocol for PEG-mediated cell fusion and PCC induction in lymphocytes isolated from the peripheral blood using mitotic CHO cells was established by the L1 laboratory and shared with the RENEB partners, in order to harmonize and standardize the PCC assay as well as the scoring criteria. Informed consent was obtained for each blood donor, and packaging, labelling and shipment of blood samples conformed to national and international regulations. A temperature logger, dosimeter to record the temperature and any dose received by the samples during transport, was used together with the standardized sample instruction sheet (ISO21243 Citation2008; ISO19238 Citation2014). The peripheral blood was always sampled in heparinized vials and, for the isolation of lymphocytes, whole blood was carefully layered on top of equal amount of Ficoll-Paque or Biocoll gradient (Biochrom) in a test tube before centrifugation. In order to quantitate radiation exposure by means of initially induced PCC fragments, the PCC methodology was applied as soon as possible, since the initial radiation-induced fragments in excess of 46 PCC decrease with time (Pantelias & Maillie Citation1985a; Darroudi et al. Citation1998a).
Cell cultures and irradiation conditions
Chinese hamster Ovary (CHO) cells were grown in McCoy’s 5A (Biochrom), culture medium supplemented with 10% FBS, 1% l-glutamine and antibiotics (penicillin: 100 U/ml; streptomycin: 100 g/ml), incubated at 37 °C in a humidified atmosphere with 5% CO2. CHO cultures were maintained as exponentially growing monolayer cultures in 75 cm2 plastic flasks at an initial density of 4 × 10⁵ cells/flask. Colcemid (Gibco) at a final concentration of 0.1 μg/ml was added to CHO cultures for 4 h and the accumulated mitotic cells were harvested by selective detachment. Once a sufficient number of mitotic cells had been obtained, they were used as mitotic promoting factors (MPF) supplier to induced PCC in human lymphocytes. Irradiation was carried out in a Gamma Cell 220 irradiator (Atomic Energy of Canada Ltd, Ottawa, Canada) at room temperature and at a dose rate of 30 cGy/min. Different irradiation times were used in order to administer to the blood samples doses ranging from 1–10 Gy. PCC slides and galleries of captured PCC images were distributed among the RENEB partners involved in the 1st intercomparison exercise. In the framework of the 2nd intercomparison exercise for the PCC assay, blood samples were taken from two healthy donors and irradiated at Bundesamt fuer Strahlenschutz (BfS, Germany) with two different doses (0.85 and 2.7 Gy) using 137-Cs gamma rays with a dose rate of 0.478 Gy/min. After a repair time of 2 h at 37 °C the blood samples were coded as RENEB 5 for the dose 0.85 Gy (Re5a, Re5b) and RENEB 6 for the dose 2.7 Gy (Re6a, Re6b), to ensure that the experiment was carried out under blind conditions. The four irradiated and coded blood samples were then sent to all participating laboratories to estimate the dose delivered by means of the cell fusion PCC assay. It is worth noticing that the above irradiation doses were unknown to the participating laboratories and were only disclosed after the completion of the analysis and once all results had been sent to the coordinator of the programme.
Cell fusion mediated premature chromosome condensation
Human lymphocytes were separated from heparinized blood samples using Biocoll separating solution (Biochrom). The blood was carefully layered on top of an equal amount of Biocoll in a test tube before centrifugation at 1900 rpm (400 g) for 20 min. Collected lymphocytes (middle layer) were washed with 10 ml culture medium, centrifuged at 1500 rpm (250 g) for 10 min and kept in culture medium (RPMI-1640 supplemented with 10% FBS, 1% glutamine and antibiotics). Lymphocytes isolated from 1 ml of blood were used for 1–2 experimental points. Cell fusion and PCC induction using PEG has been described previously (Pantelias and Maillie Citation1983; Vyas et al. Citation1991; Darroudi et al. Citation1998a; Karachristou et al. Citation2015; Sebastia et al. Citation2015). Briefly, mitotic CHO cells harvested from a 75 cm2 flask were used for 2–3 fusions. Lymphocytes and mitotic CHO cells were mixed in serum-free RPMI-1640 medium with Hepes in a 15 ml round-bottom culture tube in the presence of colcemid. After centrifugation at 1000 rpm (100 g) for 6 min, the supernatant was discarded without disturbing the cell pellet, keeping the tubes always inverted in a test tube rack on a paper towel in order to drain the pellet from excess liquid. While holding the tubes in an inverted position, 0.15 ml of 45% (w/v) PEG (mol wt 1450, Sigma-Aldrich/serum-free RPMI 1640 with Hepes) was injected forcefully against the cell pellet using a micropipette and immediately after the tube was turned in an upright position and held for about 1 min. Subsequently, 1.5 ml of phosphate buffered saline (PBS) was slowly added, the tube was shaken gently and the cell suspension was centrifuged at 1000 rpm (100g) for 6 min. The supernatant was discarded and the cell pellet was resuspended gently in 0.7 ml RPMI-1640 complete growth medium with colcemid. To optimize cell fusion when a low number of lymphocytes is available, complete lymphocyte growth medium, containing 2% phytohemagglutinin (PHA) and 10% FBS, was used (Pantelias & Maillie Citation1983; Karachristou et al. Citation2015; Sebastia et al. Citation2015). After 60–75 min at 37 °C, cell fusion and PCC induction was completed. Afterwards, cells were treated with hypotonic solution KCl (0.075 M), and fixed with methanol:glacial acetic acid (3:1, v/v), following standard cytogenetic procedures with centrifugation at 200g. Chromosome spreads were prepared, air-dried slides and stained with 3% Giemsa solution. The PCC fragments per cell in excess of 46 PCC were scored for each experimental point using light microscopy and the analysis was greatly facilitated by an image analysis system (Ikaros MetaSystems, Germany).
Centromeric and telomeric staining with PNA probes
Staining of centromeres and telomeres in lymphocyte PCC (C/T FISH staining) was performed using the Q-FISH technique with a FAM-labeled PNA probe, specific for telomere sequences (TelC-FAM), and a Cy3-labeled PNA probe, specific for centromere sequences (Cent-Cy3) (both from Panagene, Daejon, South Korea). Briefly, the slides were kept in an oven at 60 °C for at least 1 h, washed in phosphate buffered saline (PBS) solution for 15 min, fixed in formaldehyde 4% solution for 2 min, washed again in PBS twice for 5 min and digested in a pre-warm pepsin solution (1 mg/ml) for 3 min at 37 °C. After three PBS washes, slides were washed and refixed, dehydrated with 7%, 90 and 100% ethanol and air dried. PNA probes for centromere and telomere staining were applied, co-denaturated for 3 min at 80 °C and incubated for 2 h in a humidified chamber at room temperature in the dark. After hybridization, slides were washed with 70% Formamide, 1% Tris 1M pH7.2, 1% BSA 10%, H2O, twice for 15 min, then in TBS/Tween 0.08% three times for 5 min each, dehydrated with 70, 90 and 100% ethanol series, and finally counterstained with DAPI (1 μg/ml) and mounting medium.
Analysis and scoring criteria
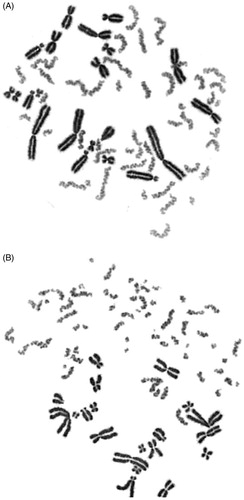
Lymphocyte PCC spreads were located manually and their analysis was facilitated by the use of a semi-automated image analysis system (Ikaros, MetaSystems, Germany). Specifically, the analysis of excess PCC fragments in lymphocyte PCC spreads stained with Giemsa was greatly facilitated by the appearance of the PCC, which are lighter stained than the CHO mitotic cells and, therefore, easily distinguished from the mitotic chromosomes of the CHO cells (). In unirradiated lymphocytes, 45–46 elements were scored in PCC spreads and, in order to calculate the frequency of excess PCC fragments, this number was subtracted from the one obtained in the irradiated lymphocyte PCC. Generally, a number of 20–30 PCC spreads was considered adequate for dose estimation following a single exposure. When C/T staining with PNA probes was applied, dicentrics plus centric ring chromosomes were quantified accurately on the basis of the detection of centromeric regions and telomeric sequences using the ISIS FISH-imaging software (MetaSystems, Germany). Only PCC spreads with 46 centromeres were analyzed.
Figure 1. Giemsa-stained PCC showing 46 single chromatid chromosomes in non-irradiated G0-peripheral blood lymphocyte (A). Sixteen fragments in excess of 46 PCC can be visualized in an irradiated lymphocyte with 4 Gy when analyzed shortly after exposure (B).
Experimental design for dose assessment intercomparisons
Two inter-laboratory exercises were designed and carried out for dose assessment intercomparisons within the RENEB network. In the 1st exercise four groups were involved (L0, L1, L3, L5) with the task to harmonize and standardize the PCC assay and unify the scoring criteria, in order to construct dose-response calibration curves for dose assessment immediately after accidental exposure. Specifically, the detailed protocol established by L1 was shared with the RENEB partners and four of them (L0, L1, L3 and L5) applied it for the present study. In addition, scientists from L2, L6, L8, and L10, as well as from other RENEB partners who where not directly involved in this PCC task, have been also trained in L1 laboratory. Furthermore, coded PCC slides and/or coded irradiated blood samples, as well as galleries of captured images for different doses, were shared among the RENEB partners to be analyzed for intercomparison purposes. In the 2nd exercise, 10 RENEB laboratories participated (L1, L2, L3, L4, L5, L6, L7, L8, L9, L10) and the experimental design focused on dose assessment in cases where blood samples become available at points in time beyond 24 h post-exposure.
Results
1st inter-laboratory exercise
Unification of scoring criteria and generation of calibration data for Giemsa-stained excess PCC fragments. For the 1st exercise, three sets of experiments were performed. In the first experiment, carried out in laboratory L1, peripheral blood lymphocytes were exposed to 0, 1, 2, 4 and 6 Gy of gamma-rays and the PCC assay was applied shortly after irradiation in order to construct the ‘immediate’ dose-response curve. In lymphocyte PCC obtained from non-irradiated blood, 46 distinct single chromatid chromosomes were scored (). Following an in vitro exposure of 4 Gy, 16 fragments in excess of 46 PCC were scored on average when the PCC assay was used immediately after exposure ().
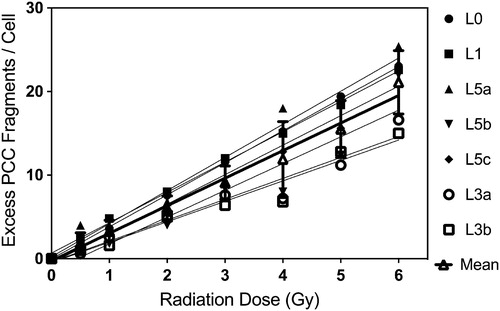
Galleries of 10 captured PCC images per dose point obtained by L1 were distributed among the four laboratories participating in this exercise (L0, L1, L3, L5) for the generation of calibration data to be used during programmed intercomparisons. The objective was to carry out a comparative study within the RENEB network in order to unify scoring criteria on the basis of analysis of galleries with PCC images for different doses. The results obtained for γ-rays-induced fragments in excess of 46 PCC in G0-lymphocytes by the different scorers in each laboratory are presented in .
Figure 2. Comparative results obtained from the analysis of gamma-rays induced excess PCC fragments in human lymphocytes for the construction of ‘immediate’ dose-response curves. (Mean curve in black bold line: linear, α = 3.9 ± 0.13 and β = −0.12.) Same 10 digitally captured PCC images per dose-point were sent to and scored by each laboratory [L0 and L1 one scorer each; L3 two scorers, and L5 three scorers].
![Figure 2. Comparative results obtained from the analysis of gamma-rays induced excess PCC fragments in human lymphocytes for the construction of ‘immediate’ dose-response curves. (Mean curve in black bold line: linear, α = 3.9 ± 0.13 and β = −0.12.) Same 10 digitally captured PCC images per dose-point were sent to and scored by each laboratory [L0 and L1 one scorer each; L3 two scorers, and L5 three scorers].](/cms/asset/ab1db078-ee6a-4002-9c53-72ee682da084/irab_a_1234725_f0002_b.jpg)
The mean values of excess PCC derived from all scorers and the different dose-response calibration curves obtained yielded a linear dose response (, black bold line, α = 3.9 and β = −0.12) with four excess PCC fragments/cell/Gy on the average.
Dose estimates using coded PCC slides
The second set of experiments for dose assessment was designed simulating an accident exercise. Peripheral blood lymphocytes were exposed in vitro to different doses of gamma-rays, 0, 0.5, 1, 2, 3, 4, 5 and 6 Gy, and three slides per dose point were coded and distributed among the participating laboratories. The objective was to perform a comparative analysis within RENEB network for dose assessment on the basis of analysis of coded PCC slides for different doses. Dose estimates were obtained by the analysis of 20 lymphocyte PCC spreads per coded slide by each scorer ().
Table 1. Dose assessments (in vitro)Table Footnotea obtained by the analysis of 20 lymphocyte PCC spreads per coded slide by each laboratory group.
Based on the analysis of 100 lymphocyte PCC spreads per dose-point, a dose-response curve for γ-rays induced fragments in excess of 46 PCC in G0-lymphocytes was generated by each participating lab, as shown in .
Figure 3. Gamma-rays induced fragments in excess of 46 PCC following irradiation to doses up to 6 Gy. (Mean curve in black bold line: linear, α = 3.3 ± 0.16 and β = −0.26) Sets of coded replicate slides were sent to and analysed by each laboratory.
Applicability of the PCC assay to detect the fraction of undamaged/damaged lymphocytes in case of accidental partial body exposure. The 3rd set of experiments was performed to assess the applicability of the PCC assay for the detection of the fraction of undamaged/damaged cells enabling thus dose estimates in case of accidental partial body exposure. Peripheral blood lymphocytes were exposed to two different doses of 2 and 4 Gy of gamma-rays. Each sample was mixed with the same volume of unirradiated blood from the same donor (ratio of 1:1) and PCC was performed for all samples. Slides were coded and distributed among the four participating partners. The data obtained are presented in . On the basis of the percentage of abnormal cells found (>46 PCC), the simple averages from the four participating laboratories were 49.7% for 2 Gy and 53% for 4 Gy partial body exposure.
Table 2. Estimation of the fraction of damaged/undamaged cells using the PCC assay in human lymphocytes exposed to gamma-rays and mixed with unirradiated lymphocytes (1:1).
2nd inter-laboratory exercise
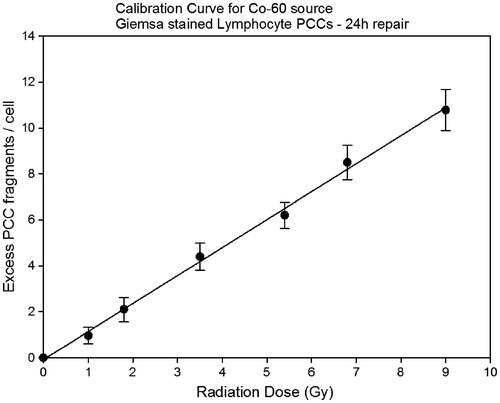
Dose-response calibration curve for Giemsa-stained excess PCC fragments at 24 h post-irradiation. In the 2nd intercomparison exercise for the PCC assay, two galleries of PCC captured images for each Re5a, Re5b and Re6a, Re6b irradiated blood samples were distributed by L1 among all partners. The aim was to perform an intercomparison between the different groups as well as the different scorers in each group. Towards this goal, L1 performed also the necessary experiments to generate a calibration curve for radiation-induced excess PCC fragments after a repair time period of 24 h (). This dose-response calibration curve was distributed among all participating laboratories. The laboratory L6 used its own calibration curve. All other laboratories that participated in this PCC exercise used the dose-response calibration curve constructed at L1.
Figure 4. Dose-response curve for excess lymphocyte PCC fragments at 24 h post-irradiation repair time and for doses up to 9 Gy (Linear, α = 1.2 ± 0.029 β = −0.082). Mean values ± SD are calculated from three independent experiments.
Dose estimation at 24 h post exposure in coded irradiated blood samples on the basis of Giemsa-stained excess PCC fragments. and present the dose estimates obtained by each participating laboratory for samples Re5a and Re5b and Re6a and Re6b, respectively, on the basis of the yield of Giemsa-stained excess PCC fragments/cell using the calibration curve for 24-h repair period at 37 °C from lab L1 (). Lab L6 used its own calibration curve.
Table 3. Dose estimates obtained by each participating laboratory for samples Re5a, Re5b (0.85 Gy) on the basis of the yield of Giemsa-stained excess PCC fragments/cell using the calibration curve for 24-h repair period at 37 °C constructed by Lab L1. Lab L6 used its own calibration curve.
Table 4. Dose estimates obtained by each participating laboratory for samples Re6a, Re6b (2.7 Gy) on the basis of the yield of Giemsa-stained excess PCC fragments/cell using the calibration curve for 24-h repair period at 37 °C constructed by Lab L1. Lab L6 used its own calibration curve.
Laboratory performance of RENEB participating groups
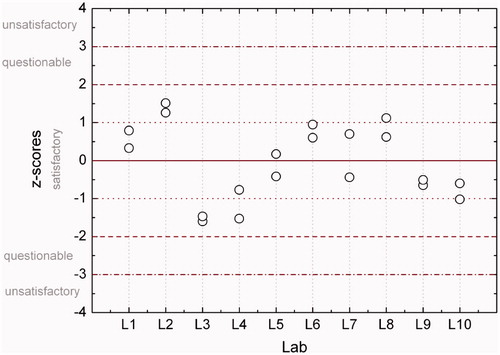
Z-value, intercomparison. The z-test was used to determine the laboratory performance. A z-score for each estimated dose was calculated, allowing the classification of the participants results into satisfactory (| z | ≤ 2), questionable (2 < | z | < 3) and unsatisfactory (| z | ≥ 3) (International Atomic Energy Agency [IAEA] 2011). shows the z-scores for all estimated doses based on the Re5a and Re5b samples. A tendency for overestimation of the dose (z > 0) for Re5 samples is observed. Nearly all labs are satisfactory in their reported values. For Re6a and Re6b all labs are satisfactory in their reported values as shown in .
Figure 5. Z-scores for estimated doses based on 30–40 cells from samples Re5a and Re5b. Dashed lines indicate boundaries of classification according to z-scores.
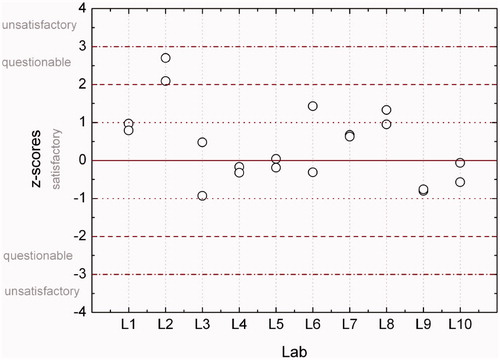
Figure 6. Z-scores for estimated doses based on 30–40 cells from samples Re6a and Re6b. Dashed lines indicate boundaries of classification according to z-scores.
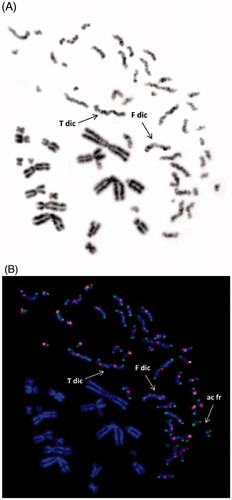
Dose assessment in coded irradiated blood samples at 24 h post-irradiation on the basis of dicentric analysis using C/T staining with PNA probes and FISH in G0-lymphocytes. Dose assessment in coded irradiated blood samples (Re5 and Re6) was carried out by means of the analysis of dicentric chromosomes in G0-lymphocyte PCC at 24 h post-irradiation time-point. For this purpose, C/T staining with PNA probes and FISH was applied to G0-lymphocyte PCC spreads in order to score accurately the dicentric chromosomes and quantify their frequency on the basis of the detection of centromeric regions and telomeric sequences (). Indeed, using the ISIS FISH-imaging software (MetaSystems, Germany) and the inverted grey scale mode as shown in , two dicentric chromosomes T dic (True dicentric) and F dic (False dicentric) can be visualized. However, in addition to the centromeric sequences, the staining of telomeric sequences is also needed in order to enable the detection of true dicentrics accurately, as shown in .
Figure 7. G0-lymphocyte PCC visualized by means of inverted grey scale mode (ISIS-FISH software, MetaSystems) following a 24 h post-irradiation repair period showing two possible dicentric chromosomes (A). True dicentric chromosomes (T dic) can be detected accurately only by means of C/T FISH staining with PNA probes (B). The presence of telomeric staining (Tel-FAM, green) between the two centromeres (Cent-Cy3, red), as shown in this Figure (B), confirms undoubtedly a false dicentric (F dic).
presents the dose estimates obtained with dicentric analysis in G0-lymphocyte PCC, using Telomere-Centromere staining with peptide nucleic acid (PNA) probes, for both samples Re5 and Re6. The three participating laboratories were L1, L2 and L6.
Table 5. Dose estimates obtained by three participating laboratories (L1, L2 and L6) based on dicentric analysis in G0-lymphocyte PCC, using centromere-telomere staining with peptide nucleic acid (PNA) probes, for both samples Re5 (0.85 Gy) and Re6 (2.7 Gy).
Discussion
The RENEB network is organized with the aim to perform rapid individualized dose estimates in case of large-scale radiological emergencies. The rationale for triage biodosimetry is to set a reasonable cut-off of dose absorbed, below which treatment is not expected to impact survival rates and above which treatment is necessary to improve survival rates. This cut-off is generally set at 2 Gy, but this threshold could be plausibly set higher, e.g. 3 Gy, if the numbers of affected individuals were beyond the capabilities of the medical system (Grace et al. Citation2010; Rea et al. Citation2010, Flood et al. Citation2011; Swartz et al. Citation2014; Kulka et al. Citation2015). Essentially, the aim in triage biodosimetry is to classify the exposed individuals, as rapidly as possible, into three categories: those who have suffered radiation injury, for whom immediate medical intervention could mean the difference between life and death; those with intermediate doses, for whom medical intervention will be necessary to mitigate the short, medium and long-term effects of exposure, and the ‘worried well’ with probable low doses, for whom no deterministic effects are expected but long-term monitoring may be required (Ainsbury & Barquinero Citation2009). In the present work, inter-laboratory dose assessment intercomparisons were performed within the RENEB network for the harmonization, standardization and optimization of the cell fusion PCC assay by the analysis of excess PCC fragments or dicentrics directly in unstimulated G0-peripheral blood lymphocytes. Towards this goal, two inter-laboratory exercises were designed and carried out.
The 1st exercise aimed to the harmonization of the PCC assay and the unification of scoring criteria, in order for all the RENEB partners involved to be able to construct dose-response calibration curves for dose assessment, immediately after accidental exposure. Interestingly, in their analyses of control unirradiated samples (), no aberrant cell with more than 46 PCC was observed/reported. Also, in irradiated blood samples with a dose as low as 0.5 Gy, no normal cell with 46 PCC was observed. This indicates that with the PCC assay, even the analysis of few cells allows the discrimination between unexposed and exposed individuals at a dose level of ≥0.5 Gy (whole body irradiation). The results presented in show that dose-response calibration curves for Giemsa-stained excess PCC fragments, constructed by the different partners, are mostly in good agreement. The mean values of excess PCC fragments derived from all scorers yielded on the average a linear dose response with 4 excess PCC fragments/cell/Gy (e.g. see ). Similar data were obtained by the L0 and L1 groups when analyzing PCC-images for different doses (). At L5 and L3 (), three and two persons scored the images, respectively. Results obtained from one of the scorers at L5 for all doses were similar to those obtained by the L0 and L1 groups. Overall, there was no difference between different scorers, at lower doses and differences appear at higher doses (higher than 2 Gy). However, the mean value of PCC derived from all scorers yielded a linear dose response curve (, black bold line: linear, α = 3.9 ± 0.13 and β = −0.12) and approximately 4 breaks/cell/Gy was obtained.
The dose estimates shown in were obtained from the analysis of coded PCC slides by the RENEB partners in the 1st inter-laboratory exercise, through the analysis of only 20 lymphocytes per slide by each scorer using calibration data from the set of images produced by L1 and distributed among the participating laboratories. Differences in dose estimates were observed among participating laboratories, as well as between the different scorers, particularly for doses above 2 Gy, as shown in . However, the mean dose estimates, 3.5–4 fragments/cell/Gy () and shape (linear, α = 3.3 ± 0.16 and β = −0.26) of the dose-response curve were close to those expected. The dose assessment was performed based on an existing calibration curve (α = 4.1 and β = 0.07) generated at L0 using peripheral blood lymphocytes from 10 donors exposed to X-rays (200 kV, 4 mA). The data revealed a positive correlation between expected and estimated doses of irradiation, for all doses at 95% confidence limits while, in some cases, the doses of exposure were underestimated. The mean values especially for doses of 2–5 Gy were 20–30% lower than the expected ones ( and ).
Regarding the ability of the PCC assay to detect the fraction of undamaged/damaged lymphocytes in case of accidental partial body exposure, the data from all groups were in good agreement with each other, with a simple average of 49.7 and 53% detected for doses of 2 and 4 Gy, respectively, versus the actual ratio of 50%. Furthermore, the yield of radiation-induced excess PCC fragments in aberrant cells was successfully used to estimate the exposure dose (). In fact, the data by L0 and L1 showed 1.8 Gy (lower confidence limit [LCL] = 1.6 Gy and upper confidence limit [UCL] = 2.1 Gy) for a sample exposed to 2 Gy (and mixed 50% with unirradiated blood lymphocytes), and 3.4 Gy (LCL =3.1 Gy and UCL = 3.8 Gy) for the sample exposed to 4 Gy. The estimates derived by the L3 and L5 groups showed lower doses.
Laboratories specialized in biological dosimetry which use the PCC assay should construct immediate dose-response calibration curves, mainly for X-rays and gamma radiation sources such as Co-60 or Cs-137, and use them for dose estimation when blood samples are received in the laboratory immediately after accidental exposure. Most importantly, though, appropriate dose-response curves for Giemsa stained excess PCC fragments or dicentrics with C/T staining must be also constructed for dose assessment, since blood samples most likely become available at points in time beyond 24 h post-exposure and repair of DNA damage that may have occurred during this time interval has to be taken into account. Towards this goal, the 2nd exercise was designed to construct first a dose-response curve at 24 h post-exposure () and then use it for dose assessment of the coded irradiated blood samples Re5 and Re6. The dose estimates obtained by the different RENEB partners following blood sample irradiation at BfS with 0.85 Gy (Re5) and 2.7 Gy (Re6) (Oestreicher et al. Citation2016), were mostly in good agreement ( and ). The use of the z-test on the performance of the different laboratories involved showed a tendency for overestimation (z > 0) for the samples Re5a and Re5b irradiated with 0.85 Gy (). However, based on the reported dose estimates for samples Re6a and Re6b irradiated with 2.7 Gy, z-score for all laboratories indicated a satisfactory performance ().
Dose estimation for the irradiated coded samples Re5 and Re6 was also obtained following C/T FISH staining for scoring dicentric and centric ring chromosomes in G0-lymphocyte PCC (). Three laboratories (L1, L2 and L6) participated and used linear-quadratic dose-response curves for PCC-dicentric and centric ring chromosomes as well as the readily available specialized software ‘CABAS’ or ‘Dose Estimate’ (IAEA Citation2011). The results reported are in good agreement with those obtained scoring Giemsa-stained excess PCC fragments ( and ). However, although the C/T staining with peptide nucleic acid (PNA) probes enables a rapid detection of dicentrics and centric ring chromosomes in lymphocyte PCC with accuracy and ease, the procedure is still laborious, expensive and time-consuming when compared to the analysis of Giemsa-stained excess PCC fragments. Consequently, the analysis of Giemsa-stained PCC fragments may provide an inexpensive and quick alternative solution, since scoring of even only 10 PCC spreads provides satisfactory dose estimates and comparable results to those obtained from the analysis of 15–20 or 30–40 spreads for both coded doses ( and ). Indeed, Karachristou et al. (Citation2015) reported that using the t-test, no statistically significant difference was found between the doses estimated by the C/T-PCC-FISH method or the method based on Giemsa-stained excess PCC fragments when 10 cells were scored (p = .981), when 20 cells were scored (p = .731) or when 30 cells were scored (p = .757).
In summary, the dose assessment intercomparisons within the RENEB network with G0-lymphocyte PCC were in good agreement and showed that the PCC assay is a quick and reliable methodology for triage biodosimetry scoring either excess PCC fragments or dicentrics and centric rings in G0-lymphocytes. Indeed, this technique has the potential to deliver data for dose assessment in a significant shorter period of time than any other biological assay being used currently, as only few cells need to be analyzed in order to detect exposed individuals. PCC assay can as well accurately discriminate between whole- and partial-body exposure and this feature is of great importance for designing a better strategy for the treatment of individuals exposed to life-threatening high doses of radiation. Moreover, the analysis of Giemsa-stained excess PCC-fragments is a simple and cost-effective alternative to the C/T-PCC-FISH method that enables a rapid estimation of absorbed dose within 2 h. In addition, its automation could potentially increase throughput and scoring objectivity of the PCC assay.
Acknowledgements
We wish to thank Mrs Carmen Garces for editorial assistance.
Disclosure statement
The authors report no conflicts of interest. The authors alone are response for the content and writing of the paper.
References
- Ainsbury EA, Barquinero JF. 2009. Biodosimetric tools for a fast triage of people accidentally exposed to ionising radiation. Statistical and computational aspects. Ann Ist Super Sanita. 45:307–312.
- Darroudi F, Fomina J, Meijers M, Natarajan AT. 1998a. Kinetics of the formation of chromosome aberrations in X-irradiated human lymphocytes, using PCC and FISH. Mutat Res. 404:55–65.
- Darroudi F, Natarajan AT, Bentvelzen PA, Heidt PJ, Van Rotterdam A, Zoetelief J, Broerse JJ. 1998b. Detection of total- and partial-body irradiation in a monkey model: a comparative study of chromosomal aberration, micronucleus and premature chromosome condensation assays. Int J Radiat Biol. 74:207–215.
- Durante M, George K, Wu H, Yang TC. 1996. Rejoining and misrejoining of radiation-induced chromatin breaks. I. experiments with human lymphocytes. Radiat Res. 145:274–280.
- Flood AB, Nicolalde RJ, Demidenko E, Williams BB, Shapiro A, Wiley AL Jr, Swartz HM. 2011. A framework for comparative evaluation of dosimetric methods to triage a large population following a radiological event. Radiat Meas. 46:916–922.
- Fomina J, Darroudi F, Boei JJ, Natarajan AT. 2000. Discrimination between complete and incomplete chromosome exchanges in X-irradiated human lymphocytes using FISH with pan-centromeric and chromosome specific DNA probes in combination with telomeric PNA probe. Int J Radiat Biol. 76:807–813.
- Fomina J, Darroudi F, Natarajan AT. 2001. Accurate detection of true incomplete exchanges in human lymphocytes exposed to neutron radiation using chromosome painting in combination with a telomeric PNA probe. Int J Radiat Biol. 77:1175–1183.
- Grace MB, Moyer BR, Prasher J, Cliffer KD, Ramakrishnan N, Kaminski J, Coleman CN, Manning RG, Maidment BW, Hatchett R. 2010. Rapid radiation dose assessment for radiological public health emergencies: roles of NIAID and BARDA. Health Phys. 98:172–178.
- International Atomic Energy Agency (IAEA). 2011. Cytogenetic dosimetry: applications in preparedness for and response to radiation emergencies. Vienna: IAEA.
- ISO19238 2014. Radiation protection-performance criteria for service laboratories performing biological dosimetry by cytogenetics. Geneva: ISO.
- ISO21243 2008. Radiation protection – performance criteria for laboratoriesperforming cytogenetic triage for assessment of masscasualties in radiological or nuclear emergencies – general principles and application to dicentric assay. Geneva: ISO.
- Karachristou I, Karakosta M, Pantelias A, Hatzi VI, Karaiskos P, Dimitriou P, Pantelias G, Terzoudi GI. 2015. Triage biodosimetry using centromeric/telomeric PNA probes and Giemsa staining to score dicentrics or excess fragments in non-stimulated lymphocyte prematurely condensed chromosomes. Mutat Res Genet Toxicol Environ Mutagen. 793:107–114.
- Kulka U, Ainsbury L, Atkinson M, Barnard S, Smith R, Barquinero JF, Barrios L, Bassinet C, Beinke C, Cucu A, et al. 2015. Realising the European Network of Biodosimetry: RENEB – status quo. Radiat Prot Dosimetry. 164:42–45.
- Lamadrid Boada AI, Romero Aguilera I, Terzoudi GI, Gonzalez Mesa JE, Pantelias G, Garcia O. 2013. Rapid assessment of high-dose radiation exposures through scoring of cell-fusion-induced premature chromosome condensation and ring chromosomes. Mutat Res. 757:45–51.
- M’Kacher R, El Maalouf E, Terzoudi G, Ricoul M, Heidingsfelder L, Karachristou I, Laplagne E, Hempel WM, Colicchio B, Dieterlen A, et al. 2015. Detection and automated scoring of dicentric chromosomes in nonstimulated lymphocyte prematurely condensed chromosomes after telomere and centromere staining. Int J Radiat Oncol Biol Phys. 91:640–649.
- Oestreicher U, Ainsbury E, Baeyens A, Barrios L, Beinke C, Beukes P, Cucu A, De Amicis A, De Sanctis S, Di Giorgio M, et al. 2016. RENEB Intercomparisons analysing dicentric chromosomes (Dicentric Assay). Int J Radiat Biol. DOI: 10.1080/09553002.2016.1233370.
- Pantelias GE, Iliakis GE, Sambani CD, Politis G. 1993. Biological dosimetry of absorbed radiation by C-banding of interphase chromosomes in peripheral blood lymphocytes. Int J Radiat Biol. 63:349–354.
- Pantelias GE, Maillie HD. 1983. A simple method for premature chromosome condensation induction in primary human and rodent cells using polyethylene glycol. Somatic Cell Genet. 9:533–547.
- Pantelias GE, Maillie HD. 1984. The use of peripheral blood mononuclear cell prematurely condensed chromosomes for biological dosimetry. Radiat Res. 99:140–150.
- Pantelias GE, Maillie HD. 1985a. Direct analysis of radiation-induced chromosome fragments and rings in unstimulated human peripheral blood lymphocytes by means of the premature chromosome condensation technique. Mutat Res. 149:67–72.
- Pantelias GE, Maillie HD. 1985b. The measurement of immediate and persistent radiation-induced chromosome damage in rodent primary cells using premature chromosome condensation. Health Phys. 49:425–433.
- Rea ME, Gougelet RM, Nicolalde RJ, Geiling JA, Swartz HM. 2010. Proposed triage categories for large-scale radiation incidents using high-accuracy biodosimetry methods. Health Phys. 98:136–144.
- Sebastia N, Montoro A, Hervas D, Pantelias G, Hatzi VI, Soriano JM, Villaescusa JI, Terzoudi GI. 2015. Curcumin and trans-resveratrol exert cell cycle-dependent radioprotective or radiosensitizing effects as elucidated by the PCC and G2-assay. Mutat Res. 766–767:49–55.
- Suto Y, Gotoh T, Noda T, Akiyama M, Owaki M, Darroudi F, Hirai M. 2015. Assessing the applicability of FISH-based prematurely condensed dicentric chromosome assay in triage biodosimetry. Health Phys. 108:371–376.
- Swartz HM, Williams BB, Flood AB. 2014. Overview of the principles and practice of biodosimetry. Radiat Environ Biophys. 53:221–232.
- Vyas RC, Darroudi F, Natarajan AT. 1991. Radiation-induced chromosomal breakage and rejoining in interphase-metaphase chromosomes of human lymphocytes. Mutat Res. 249:29–35.