
ABSTRACT
The Basel 3 guidance on bank regulation includes a new definition of real estate valuation which differs from existing bases. Prudently conservative valuation or prudent value includes four criteria which include the exclusion of ‘expectations of price increases’ and it must be ‘adjusted to take into account the potential for the current market price to be significantly above the value that would be sustainable over the life of the loan’. ‘National supervisors should provide guidance’ and ‘If a market value can be determined, the valuation should not be higher than the market value’. Prudent value has synergies with existing post Global Financial Crisis (GFC) debates concerning long-term valuations for commercial real estate bank loan origination and monitoring purposes. This paper outlines the concepts of long-term and prudent values in more detail, reviews the literature on long-term valuation and develops a framework for prudent value. It also puts that literature into a wider perspective on the analysis of market cycles and portfolio disaggregation within performance measurement, and suggests ways in which the property industry could implement the current Basel 3 prudent value proposals.
Introduction
In 2017 the Bank for International Settlements Basel Committee, which provides guidance on financial regulation internationally, proposed a new definition or framework for real estate valuation called prudent value. Although the Basel Committee only produce guidance, many jurisdictions are committed to following it wherever possible. The European Commission is the first jurisdiction to declare its intention to adopt this new valuation framework within its Capital Requirements Regulations (CRR) (EC, Citation2021). In November 2022, the UK Prudential Regulation Authority consulted on proposed changes to its financial regulations including the introduction of prudent value for real estate. The results of their consultation are not yet published but expectations are that the prudent valuation framework will remain. The framework relates to valuations for lending purposes at both loan origination and for monitoring purposes.
It is not clear how the revised framework will be implemented and that is the focus of this research. The prudent value framework fits very closely into a wider research agenda addressing the usefulness of valuations within the bank lending and regulation process. A series of major property market cyclical boom and bust situations over the last 50 years have been followed by criticisms of valuations (and valuers) and a number of initiatives concerning the valuation part of the lending process have been suggested to try and mitigate the impact of over-lending in boom periods leading to significant defaults in downturns.
Part of that wider research agenda following the global financial crisis of 2007–2009 was the generation of long-term value to replace or supplement the usual basis of market value. This paper accepts the arguments that market value is purely an identification of exchange price at the date of valuation and provides no information on any change in values/prices in the future, and therefore does not identify situations whereby values might fall in the future.
Lenders and regulators have rather belatedly discovered the limitations of the market value basis within bank lending and monitoring processes but there is now general recognition within international and national regulation authorities of the need to supplement it with an alternative valuation framework which attempts to provide a longer-term perspective of property prices and values; hence, the generic term long-term valuation.
The objectives of this paper are to:
Identify methodologies for the development of long-term valuation models and make recommendations for a preferred methodology.
Identify how they might be developed across individual countries within Europe and further develop previous research on data requirements and availability.
Examine whether a common harmonised approach across individual countries within Europe is feasible and whether it needs to be applied at an individual property or market segment level.
Provide guidance to national real estate industry organisations and professional institutions on their role in supporting the development of a rational and deliverable long-term value methodology. This may vary significantly for different national industry and professional organisations.
This paper outlines the concept of long-term and prudent values in more detail, reviews the literature on long-term valuation, briefly puts that literature into a wider perspective on the analysis of market cycles and portfolio disaggregation within performance measurement, and suggests ways in which the property industry could implement the current prudent value proposals. It has a major policy objective but the discussion is grounded in a number of property valuation and real estate market analysis debates such as valuation concepts and definitions, portfolio disaggregation and performance measurement and long-term equilibrium and uses databases specifically constructed for this research programme, as well as existing MSCI data.
The implications of this research are significant. The prudent value framework set out in the next section is substantially different to market value and presents a huge challenge to valuers and their institutions. Basel is global guidance and therefore should impact on banking regulation globally; the European initiatives may just be the start and it is preferable that practices work efficiently and are consistently applied internationally if we are to avoid a repeat of the financial difficulties that have followed previous real estate market downturns. This paper concentrates on commercial real estate but has implications for residential real estate which could benefit from a similar approach.
Prudently conservative valuation framework
Due to its role in the Global Financial Crisis (GFC), commercial real estate (CRE) has been a major component in initiatives to prevent the GFC happening again (ICB, Citation2011). A major focus (but not the only one) of the debate surrounding the role of CRE has been the influence property valuation. The valuation debate has focussed on the inadequacies of existing valuation practices and how they might be improved and a number of initiatives from a range of stakeholders in the process have come together to frame the discussion. These include financial system advisors and regulators (for example, the Basel Committee for Banking Supervision (BCBS) of the Bank for International Settlements (BIS), the International Monetary Fund (IMF) and a number of central banks including the European Central Bank (ECB) and the Bank of England (BOE)), the self-regulating institutions of valuation practices (i.e. The International Valuation Standards Council (IVSC), The European Group of Valuers (TEGOVA) and RICS, and other real estate industry groups (For example, the Property Industry Alliance (PIA), Investment Property Forum (IPF), the Commercial Real Estate Finance Council Europe (CREFC Europe), European Mortgage Federation (EMF) and the Long-term Sustainable Value Network (L-TSV)).
The main basis for lending purposes is market value (MV). There is another approach to valuation used within this sector called mortgage lending value (MLV). These bases are well established (market value globally and MLV in some jurisdictions in Europe, including Germany and Spain). The definition of MV is set out in existing EU regulations within Article 4 paragraph 76 of the existing Capital Requirements Regulation (CRR) and MLV in paragraph 74. MLV has received some scrutiny within the property valuation academic literature with some of that aimed at the lack of any theoretical basis for its application, even its supporters do not claim any theoretical underpinning (Crosby et al., Citation2000; Borio et al., Citation2001, p. 36; Lind, Citation2005).
The MV definition for bank lending purposes is the same as in the major valuation standards and ‘means, for the purposes of immovable property, the estimated amount for which the property should exchange on the date of valuation between a willing buyer and a willing seller in an arm’s-length transaction after proper marketing wherein the parties had each acted knowledgeably, prudently and without being under compulsion’. (EU CRR Article 4, Paragraph 76).
MLV ‘means the value of immovable property as determined by a prudent assessment of the future marketability of the property taking into account long-term sustainable aspects of the property, the normal and local market conditions, the current use and alternative appropriate uses of the property’ (EU CRR Article 4, Paragraph 74).
In 2017, the Basel Committee on Banking Supervision (BCBS) within the Bank for International Settlements (BIS), having identified a loss of faith in banks’ reported risk-weighted capital ratios and the need for reform post GFC, produced detailed guidance within the Basel III accord to strengthen the regulation, supervision and practices of banks worldwide, with the purpose of enhancing financial stability. The BCBS aimed to create a banking system that is ‘resilient and able to support the real economy and contribute positively to sustainable economic growth over the medium term’ (BCBS, Citation2017, p. 1).
They set out proposed prudently conservative criteria for the valuation of real estate. At the time of writing, both the EU and the UK were expected to adopt the Basel III valuation principles with implementation planned for 2025. The Basel III definition is:
‘Value of the property: the valuation must be appraised independently using prudently conservative valuation criteria. To ensure that the value of the property is appraised in a prudently conservative manner, the valuation must exclude expectations of price increases and must be adjusted to take into account the potential for the current market price to be significantly above the value that would be sustainable over the life of the loan. National supervisors should provide guidance, setting out prudent valuation criteria where such guidance does not already exist under national law. If a market value can be determined, the valuation should not be higher than the market value … ’ (BCBS, Citation2017)
The elements that make it very obviously different to MV are that ‘the valuation must exclude expectations of price increases’ and “must be adjusted to take into account the potential for the current market price to be significantly above the value that would be sustainable over the life of the loan. It is different also from MLV but there are obviously some synergies between the above two criteria and ‘long-term sustainable aspects of the property’ within MLV.
There is also a requirement for national supervisors to provide guidance on the criteria where none exists and, importantly, for prudent value not to exceed MV.
Prudent value related literature
Any discussion of alternative valuation bases is grounded in the well-established and well-documented theories surrounding the meaning of value within the context of property valuation. Özdilek (Citation2016) reviews the challenges faced by valuers in assessing value and suggests that value is a more subjective concept than price, cost or income (PCI). He reviews the contributions of numerous authors across the centuries under the headings of value bases, expressions and estimation, including seminal contributions from as far back as Ricardo (Citation1821) and Adam Smith (Citation1776). He discusses the formation of price through the utility of different stakeholders in the process and states that ‘Exchange value in PCI is a joint matter (requiring negotiation), whereas an isolated use value is envisaged purely from a personal standpoint. The exchange value of an event tends towards an average of all the individuals’ expressions of value’. The differences between an individuals’ expression of value and exchange value are well documented in the property valuation literature (examples include Baum et al., Citation1996, 2021; McParland et al., Citation2000; Mooya, Citation2016) and are formalised within international valuation standards with specific definitions of Investment Value and Market Value (IVS, Citation2022)
Long before 2017, concerns surrounding bank lending valuations had been raised and debated within UK CRE regulators and participants. The first question is whether market value is a flawed basis of assessing the value of property for secured lending purposes? This discussion sits within the behavioural economics arguments surrounding bubbles and crashes which argues that market participants act irrationally, wave-surfing the boom supported by a flow of ultimately unsustainable finance, underpinned by inappropriate investment manager and banker bonus structures and the limited liability of participants (see, for example, Allen & Gale, Citation1999; Brunnermeier & Pedersen, Citation2009; Jensen & Meckling, Citation1976). Stiglitz (Citation1990) characterised a bubble as when prices were high only because investors believed that prices would be high tomorrow (longer term in real estate markets) but fundamental factors did not support that. Crosby and Hughes (Citation2011) illustrated that a bubble existed in UK commercial property markets in the period 2005 to 2007 by comparing market values with investment values and that the crash in 2007 to 2009 was a correction back to values backed by the economic fundamentals. This work subsequently formed the basis for the Bank of England’s assessments of commercial real estate markets within their Financial Stability Reports from 2015 onwards (Bank of England, Citation2015).
The conclusion within the regulators concerning market value was that it was pro-cyclical and, without proper attention to loan-to-value ratios in a rising market, higher price levels lead to higher market valuations, which lead to higher lending, which in turn may fuel rising prices into a spiral upwards beyond any fundamental underpinning. It leads to larger potential defaults in any (inevitable) downturn as evidenced by Clarke (Citation2018) and by the ESRB (Citation2022) as loans granted in the last 2 years of a rising market in 2005–2007 become the loans with the largest default margins.
Conventional cost-based methods also do not address the issues surrounding cycles within real estate prices as they use comparison of current prices for the land element. A different approach is needed to address the fundamental problem that valuations based on current prices encourage excessive lending at the top end of a bull market and discourage it in a bear market.
In 2014, a UK industry report encouraged by the UK central bank had suggested that a long-term sustainable value was needed to support market value (REFG and IPF, Citation2014). The Crosby and Hughes (Citation2011) analysis suggested a calculation of fundamental worth (investment value without reference to the individual investor) could be the answer. A subsequent working group set up to address the long-term valuation recommendation tested MLV, and IV against MV at an all property and office, retail and industrial segment levels, through the last two major property downturns in the UK, 1990 and 2007 (Cardozo et al., Citation2017). This work confirmed the Crosby and Hughes findings for the GFC but IV did not work for the UK 1990 downturn. It also illustrated that the concerns over MLV were well founded in that it lacked a conceptual basis and relied on prescribed inputs.
Cardozo, et al., (Citation2017) illustrated that the 1990 and 2007 downturns came from two very different ‘bubbles’. They found that not all crashes are the same and any analysis has to pick up on both occupier market cycles (1990) and asset value/capitalisation rate cycles (2007) if any long-term value modelling is to identify a potential future downturn.
Long-term value research is set within the seminal equilibrium rent modelling work of Hendershott (see, for example, Hendershott et al., Citation2002 and Citation2002). The modelling of cap rates is grounded in the work of a number of authors (see, for example, A
mbrose & Nourse, Citation1993; Chen et al., Citation2004; Chervachidze & Wheaton, Citation2013; Chervachidze et al., Citation2009; Duca & Ling, Citation2018; Hendershott & MacGregor, Citation2005a, Citation2005b; Jud & Winkler, Citation1995; Rachel & Smith, Citation2015, Gourinchas and Rey, Citation2019; Sivitanides et al., Citation2001; Wheaton, Citation1999) who have variously looked at cap rates, discount rates, expected inflation and risk premia.
IPF (Citation2020) created long-term datasets for the UK and tested a variety of models and inputs based on the large number of market analyses cited above. They found that forecasting of rental growth was not good enough to identify cyclical upturns or downturns and tested the various long-term equilibrium models against the last two downturns. They found that all of the various long-term trend models successfully identified over-pricing in the 2 years before the peak across the three main UK CRE segments, including a simple past trend model. But they also found that an econometric model using a 15-year rolling set of inputs performed marginally better than any others, as it was able to take some account of any structural change in markets (for example, the change in retailing and logistics markets in the recent past).
Crosby and Hordijk (Citation2021) sets out the literature, methods and results for the sustainable, long-term rental analysis within that work. The detail of the cap rate modelling in that report has not yet been subjected to peer-review.
Research questions
This paper does not aim to identify the best method of analysis. The literature illustrates that most long-term equilibrium models tested indicated positive results, in that they identified both major UK CRE downturns with at least a two-year early warning signal. The main location has been the UK as it is the most transparent global market (JLL, Citation2022) with the data capacity to undertake market analysis of prices to determine estimates of long-term equilibrium value which, when compared with the current level of prices, can determine estimates of prudent value adjustments to market value at any particular point in time.
The major question for this research is whether this modelling is a reliable and consistent basis for constructing a prudent value regime. The precise questions are:
Does the definition of prudent value within Basel III set out above fit with the long-term through-the-cycle modelling undertaken within the IPF (Citation2020) study and, if so, what is the precise definition for the prudent value framework?
How can market value adjustment factors be calculated? Can the same approach be used in all countries across Europe and ultimately, as Basel III is global guidance, across all countries? This question raises the major issue of data requirements and availability.
Can market adjustment factors be identified at the individual property level?
If a market segment-level adjustment is needed, what is the acceptable level of aggregation to provide?
Finally, who provides the valuations?
These questions have been addressed within two industry-backed and funded research reports Crosby and Hordijk, Citation2021 and Citation2023 and this paper summarises the findings.
The definition of prudent value
RICS Europe (Citation2018) illustrated a simple interpretation of through-the-cycle and under-the-cycle models and their relationship to market value ()
Figure 1. A stylised view of the different approaches to prudent value (source RICS Europe, Citation2018).
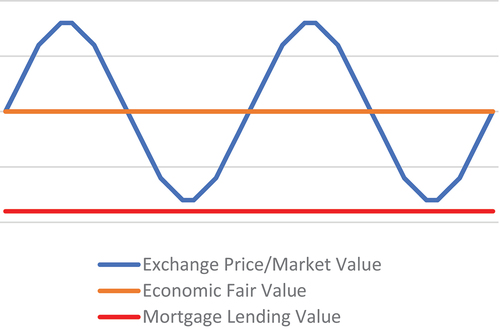
Economic fair value is represented as a through-the-cycle model based on the investment value definition and discussed in the industry funded paper by Burston and Burrell (Citation2015) entitled ‘What is Fair Value’ (not to be confused with accounting fair value). The under-the-cycle model is MLV.
The reconciliation with the prudent value framework is based on the four criteria set out in the BCBS (Citation2017) guidance.
First, ‘To ensure that the value of the property is appraised in a prudently conservative manner, the valuation must exclude expectations of price increases’. This specifically excludes positive growth forecasts but not negative forecasts of value falls. This is a major issue as most prices are based on the expectations of investors and these may include expectations of nominal value change in the future. In times of high inflation and growth in nominal rents in, for example, the 1980s in the UK, around two-thirds of the value was predicated on high expectations of nominal growth. Implied rental growth rates reached over 10% in the late 1980s in some segments.
If this criterion is taken literally, the growth element of all prices must be ignored and so the capitalisation rate should be based on long-term nominal discount rates based on risk-free rates plus risk premium. The risk premium for property includes uncertainty around the implied growth estimates so should the risk premium be adjusted? But long-term equilibrium values are not static through time. This criterion illustrates a simplistic and fairly nonsensical understanding of the dynamics of real estate pricing and intrinsic value, the intention would be better addressed than the reality. The intention is surely to restrict the valuation to a figure that takes no account of unreasonable or economically unrealistic expectations of price increases. A through-the-cycle model does that. The second criterion is more attuned to this approach. The ‘potential for the current market price to be significantly above the value that would be sustainable over the life of the loan’ fits the intention above as it talks about ‘significantly above’ rather than just above.
The third criterion is that – ‘National supervisors should provide guidance, setting out prudent valuation criteria where such guidance does not already exist under national law’ and the fourth that ‘If a market value can be determined, the valuation should not be higher than the market value’. This makes MV a pre-requisite for the prudent value and prudent value can be related to an adjustment to MV. So MV should be part of every prudent valuation report.
As a through-the-cycle assessment can be both above or below MV, the prudent value definition becomes either MV or long-term through-the-cycle value, whichever is lower.
The responsibility for setting these rules will be the national supervisors, but Crosby and Hordijk (Citation2021, Citation2023) recommend strongly that this is undertaken in partnership with the leading international and national professional valuer (and CRE industry) associations. They cite evidence of where the finance community has failed to discuss valuation-basis issues with the valuation and wider real estate community, leading to impractical and, in one case, farcical outcomes (post-1990 introduction within the UK of Estimated Realisation Price). Some aspects of the prudently conservative valuation criteria support that perception of poor understanding.
Prudent valuation methods at the individual property and/or market segment level
Burston and Burrell (Citation2015), Crosby and Hughes (Citation2011) and Cardozo, et al. (Citation2017) all used a basic cash flow investment valuation model using required returns and forecasts of value change through a five-year time horizon to identify what the present value of the cash flow should be, and then compared it with the market value capitalisation rate to determine any mismatch. This model can be applied at both the individual and market segment level.
Cardozo, et al., (Citation2017) and IPF (Citation2020) illustrated that this model did not give early warning signals prior to the occupier market crash in 1990 in the UK. This was because the forecasting models had momentum within them and assumed rental growth extended well into the downturn. So IPF (Citation2020) tested econometric and past trend models using market segmented data and established a preferred method which used past data back 15 years and did not have the issues attached to an IV approach.
Their preferred approach to the long-term value component of prudent value requires long-term datasets. IPF (Citation2020) consolidated existing data back to 1967, compared the three major sources (IPD/MSCI, CBRE and JLL) of UK property market indices, as well as developing long-term stock data across the three main segments of office, retail and industrial. These long-term data sets are not published or available at the individual property level.
However, current time-specific data for market valuation is another matter entirely and is currently collected for every valuation undertaken, regardless of method. For example, current rental value and capitalisation rate data is collected for market valuations undertaken using investment methods and for the MLV of investment property. Current price data is collected for both the MV and MLV of properties usually valued comparatively directly to capital value.
This suggests that MV can be implemented at the individual property level and long-term value is more easily implemented at a market segment level. All of the long-term value/prudent value existing research points to the removal of long-term valuation from the valuation arena and placing it in the hands of the market analysts using econometric modelling of market segments. If the global financial difficulties related to CRE are based on cyclical markets and not individual asset loan characteristics, this response makes perfect sense.
A market valuation at the individual property level is required to pick up on any asset-specific issues that impact on value (location, tenure, occupation, building quality, etc.), notwithstanding the need to verify the asset actually exists (to insure against fraud).
The conclusion of the IPF (Citation2020) research was that a market segment level long-term value assessment using a variety of methods based on the econometric rent and yield modelling research literature (see below), creating an adjustment to MV at loan origination in both the periods 1988 to 1990 and 2005 to 2007 would have had a significant impact on the number of loans in technical default, post downturn.
Table 1. Basic demand and supply side variables for econometric modelling of sustainable rents.
Table 2. CRE market size and MSCI coverage estimates – MSCI global annual index properties.
Table 3. CRE MSCI market size and coverage estimates – other countries.
Table 4. Segment correlations with all-property and office, retail and industrial sectors 2001–2022.
The recommendation to take the prudent value adjustment out of the hands of the individual valuer at individual asset level also makes sense for the efficient operation of any system. An individual property long-term prudent valuation, given the criteria, would cause major uncertainty and inconsistency over the outcomes. It would require individual valuers to determine when markets were over-priced, and many valuers undertaking bank lending valuations do not have either the expertise or the data to make that call. Some do and they may well identify adjustments earlier than those who do not. In regimes where banks have regularly sued valuers for negligence in the aftermath of earlier crises, there is the spectre of those valuers who did not read the cycle at the same time as others being found guilty of prudent valuation negligence. Indemnity insurance premiums would rise, and many valuers may be forced to give up this work leaving the lenders with a reduced panel of valuers.
Given that conclusion the next question is how a market-wide system could be implemented. Subject to further research refining the detail of the methods and models, the major constraint is data, and this is addressed in the next section.
Prudent value methods across Europe
The two jurisdictions actively proposing to adopt the Basel III prudent value framework are the EU and the UK. This section concentrates on these two jurisdictions but the range of market maturities across Europe is quite wide and therefore forms a good, but not perfect, case study for the practical difficulties in implementing a market segment-level set of market value adjustment factors globally. The range of different markets is fully illustrated by the JLL Transparency Index (JLL, Citation2022) which suggests that Europe has 7 of the 12 Highly Transparent countries, 13 of the next 22 Transparent countries, 7 of the Semi-Transparent countries, 2 of the 20 Low Transparency countries but none of the 18 Opaque countries. It could form an evidence base for a significant range of different global markets apart from the opaque countries.
There are two elements to implementation and these both relate to data. What are the data requirements of the modelling process and what is the availability of that data across Europe?
Data requirements – rent modelling
The data used for various rent modelling exercises used within the literature is set out in Appendix 1 .
summarises the different demand and supply side data requirements of the different models included in Appendix 1 across the three main sectors of commercial real estate markets.
Crosby et al. (Citation2022) tested various equilibrium rent models set out in Appendix 1 using long-term UK data across the three main CRE segments, assessing the ability of these models to identify any over pricing at least 2 years before the UK downturns of 1990 and 2007. They found all models tested, including even a basic trend model, were able to pass that criterion for both downturns. The best results came from an equilibrium rent model using 15-year past data rolling inputs including a specially constructed floorspace variable and real GDP (offices and industrial) and real household consumption (retail).
Data requirements – cap rate modelling
The Reading/Cambridge (IPF, Citation2020) identified a number of basic indicators used for the determination of cap rates. The basic Gordon and Shapiro (Citation1956) model is predicated on the capitalisation rate being a function of the target rate of return less the expected growth (k = r – g) where k= cap rate, r = target or discount rate and g = expected growth. The target rate is the risk adjusted risk-free rate based on a risk-free rate plus risk premium. Where g is real, the risk-free rate should also be based on real interest rates. Where g is nominal, the risk-free rate should also be nominal. For long-term equilibrium values, these drivers should also be sustainable through time rather than based on current levels. Expected growth is net of depreciation unless the model is expanded to include d = depreciation rate (k = r – g + d).
Ambrose and Nourse (Citation1993) used the interest rate spread between long-term bond and short-term bond rates to proxy expected inflation. Sivitanides et al. (Citation2001) investigated the relationship between cap rates, the discount rate and rental growth. Chervachidze et al. (Citation2009) and Chervachidze and Wheaton (Citation2013) introduced two new variables to the Sivitanides et al. (Citation2001) modelling, the degree of general risk aversion in the economy and the availability of debt. The data for debt availability was the annual change in total debt outstanding-to-GDP ratio.
Duca and Ling (Citation2018) use survey data of risk premia as their source. Rachel and Smith (Citation2015) looked at the spread between the risk-free rate and the return on capital and there is a continuing debate over the long-term natural level of risk-free rates (see for example, Gourinchas and Rey, Citation2019).
The two capitalisation rate models developed for the IPF (Citation2020) study were an econometric model and an Ex-Ante model using expected growth rates and target rates. That study also looked at both historical trends and historical average yields or reversion to the mean.
The data required for most of the econometric and past trend models is based on past capitalisation rates, real interest rates, inflation, risk premia and rental growth rates. The literature identifies the detail of the data, dependent upon the model used and includes both past series and future expectations. Trying to identify indicators of structural change is a major challenge.
Data availability across Europe
Rent and vacancy variables used in these studies have been almost always obtained from private sector, proprietary data sources at a cost to the research. Property value data is normally more readily available than floorspace or vacancy in a European context. Stock tends to be tracked at city rather than national level by such sources. Where public data on stock exists, it can be erratic and, in the UK Reading/Cambridge study, some extrapolation was necessary to join different series together.
There are some technical issues with the data. For example, the rent variables (whether asking rents, transaction-based rents or appraisal-based rental values), often (but not always) reflect headline levels of rent that are not adjusted for incentives. These incentives to let can be major elements especially in weak occupational markets and can disguise the true extent of any occupier market downturn.
Normally, demand variables have been obtained from public sources such as national or local statistical agencies. Employment series are more likely to be available at a local level than output-based measures. Many studies have used sector-specific employment measures (such as financial or ‘office-based’ employment) more frequently than sector-specific output measures. Again, private sector forecasting and consultancy firms in some markets hold more tailored employment and output variables for local-level modelling.
Crosby and Hordijk (Citation2023) audited data availability across Europe. There are some major sources for general economic indicators across countries such as Eurostat, OECD and World Bank as well as individual country statistics.
For example, Eurostat has data on a number of themes at a country-specific level, concentrating on the 27 EU countries but including a number of other countries in its various datasets.
Relevant demand and supply side datasets include:
GDP and household expenditure − 38 countries – Quarterly from Q1 1995 –countries include the EU 27 of European countries. The list is Belgium, Bulgaria, Czechia, Denmark, Germany (until 1990 former territory of the FRG), Estonia, Ireland, Greece, Spain, France, Croatia, Italy, Cyprus, Latvia, Lithuania, Luxembourg, Hungary, Malta, the Netherlands, Austria, Poland, Portugal, Romania, Slovenia, Slovakia, Finland, Sweden plus Montenegro, North Macedonia, Albania, Serbia, Bosnia and Herzegovina, Kosovo (under United Nations Security Council Resolution 1244/99) United Kingdom, Switzerland, Iceland, Norway and Turkey.
Unemployment monthly from 1983 for the EU 27 plus Iceland, Norway, Switzerland, United Kingdom, Turkey, United States and Japan.
Construction - monthly volume index from 1980 broken down into construction, buildings and civil engineering. Main data start from about 2000 onwards and includes the EU 27 plus Norway, the United Kingdom, North Macedonia and Turkey.
Sector-specific demand series include retail trade volumes monthly from 1991 onwards (but only for a few countries) with most countries covered from 2000 onwards. The countries included are the EU 27 plus Norway, Switzerland, United Kingdom, Montenegro, North Macedonia, Albania, Serbia and Turkey. They also include manufacturing statistics for the EU 27 plus from 2005 (EU 27 plus Iceland, Liechtenstein, Norway, Switzerland, United Kingdom, North Macedonia, Albania, Serbia, Turkey and Bosnia and Herzegovina).
Financial data includes:
Inflation - monthly from 1996 for the EU 27 plus the United States, Iceland, Norway, Switzerland, United Kingdom, North Macedonia, Serbia and Turkey. Not all countries have a full series.
Long-term (10 years) Government Bond rates - Monthly from 1980, full coverage of all 27 EU countries from around 2005. Short-term interest rates not available for more than around 8 countries
There is no data on direct commercial real estate prices or vacancies but there are a series of regular sentiment surveys on, for example, retail and financial services.
OECD is more global and has detailed data on 55 countries of which 26 are within the European zone. They have developed data on regions and cities within individual countries and economic and financial statistics are available for certain indicators. For example, for cities across 21 countries in Europe, there is OECD data on demographics, real GDP growth, a range of employment and unemployment data and household disposable income. For regions within those 21 countries, there is data on different aspects of the economy. The World Bank mimics much of the basic financial and economic data from OECD and Eurostat but covers a wider range of countries.
The second source of data is national CRE data in the public domain. Even in the UK, classified as the most highly transparent market globally (JLL, Citation2022), there are few examples of nationally collected, structured and freely available CRE data. The required property-based elements of the modelling process are not in the public domain internationally nor are they the subject of major data collection within national statistics. The UK Office of National Statistics collects virtually no information on real estate values other than for property company (REIT) prices.
The Federal Statistics Office of Germany and Stabel Belgium have construction and residential price indicators but no value statistics for commercial real estate. Statistics Netherlands also has house prices and construction prices from 2015 but no commercial real estate series. France does have commercial rent statistics from March 2005 for Metropolitan France as well as housing and construction price indices. It is therefore an outlier as far as commercial real estate price data is concerned.
In 2015 and 2016, the European Systematic Risk Board (ESRB, Citation2015, Citation2016) identified both real estate as a major contributor to the financial crisis and the lack of commercial real estate data as a major constraint to financial stability policy making.
They concluded that ‘Establishing a more harmonised framework for monitoring developments in the RRE and CRE markets, the segments of the real estate sector most relevant for financial stability purposes, is therefore crucial to ensure early identification of vulnerabilities that could lead to future financial crises. Policymakers need to have a certain set of relevant information available, including a reliable set of key indicators, to help identify the build-up of systemic risks and assess the potential need for macroprudential intervention. In addition, these indicators can play an important role in determining whether and when to tighten or release the harmonised macroprudential instruments targeting lenders that are available under Union law’. (ESRB, Citation2016, p. 2). A similar set of indicators are needed for the assessment of long-term and prudent value.
These observations were based on the ESRB (Citation2015) report on CRE and financial stability which concluded that ‘data on CRE are in general scarce, incomplete or inconsistent ‒ especially compared with RRE data ‒ making it difficult to describe accurately and compare risks in and across national markets’. (ESRB, Citation2015, p. 3). While a Eurostat (Citation2017) report shows some progress, it has been slow and CRE data remains largely in private hands.
The sparse nature of publicly available commercial real estate price data in the mature economies of Europe is in stark contrast to the significant databases in private hands. Most of these private sources are either appraisal-based or judgement-based in nature, where judgements might be informed by knowledge of transactions, but the series are not directly derived from transactions (see Crosby & Devaney, Citation2019, 172-91). Data from these sources has been used/purchased for real estate modelling purposes within studies set out in the literature review. They are also used to provide commentaries on different segments across CRE markets in Europe.
MSCI are the largest providers of CRE investment performance data and have a global reach. set out their global annual index size and coverage.
Another pan-European dataset is being developed by the European Association for Investors in Non-Listed Real Estate (INREV). It has a quarterly index of data across Europe commencing in 2014. At present it does not have the longevity needed to operate long-term equilibrium value analysis. It is also dominated by the four largest markets of the UK, Germany, France and the Netherlands with 80% by value within these markets. These are the only markets where country-level data is published. But the data covers 20 European countries, so it is a potential future alternative to MSCI. These countries are Austria, Belgium, Czech Republic, Denmark, Finland, France, Germany, Hungary, Ireland, Italy, Luxembourg, Netherlands, Norway, Poland, Portugal, Slovakia, Spain, Sweden, Switzerland and the UK. As at September 2022, the number of properties included was 6,615 with a combined market value of 214.5 billion euros. It is still small by MSCI standards but is being increasingly supported by European investors.
There are significant property market datasets locked inside a number of Global and Pan-European organisations. These include firms such as Property Market Analysis, Real Capital Analytics, now part of the MSCI group, the German Property Index within RIWIS, and a variety of international property consultants such as BNP Paribas, CBRE, Colliers, Cushman and Wakefield, Knight Frank, JLL and Savills. Appendix 2 includes descriptions of some of these companies and their datasets.
In order to identify the type of data held by private consultants more accurately, specific requests were made to nine organisations to verify the type of data held in the firms’ databases, the length of any time series and the level of disaggregation. Replies detailing the data sets held within these organisations were received from five of these organisations; Capital Economics, CBRE, Cushman and Wakefield, Knight Frank and Savills.
The results are summarised alphabetically below.
Capital Economics covers 21 European countries including some of the less transparent or CEE countries of Czech Republic, Greece, Hungary, Poland, Romania, Russia, and Turkey. They track office market data on London and major regional cities in the UK and industrial data for major regions. In the rest of Europe, they have data for major cities for industrial, retail and office markets, plus some national and regional aggregations. The data includes mainly rents and yields but, in some locations, also includes capital values, returns, completions, vacancy, take up, future completions, and investment volumes. The data has a time series of 15–20 years, longer for the more mature European markets.
CBRE hold data for 29 European countries and property market segments including offices, retail, logistics, data centres and hotels. The data includes 66 European cities. The data is collected quarterly and extends to over 450 individual office locations, around 250 retail and nearly 150 industrial locations across their European and Middle Eastern region (EMEA). The type of data collected includes prime rents, rent-free periods, prime yields, vacancy rates, total stock, completions, take-up and investment volumes. The precise amount of data and time series varies by country and location but some rent and yield data for mature markets goes back to the 1970s. The Hotel and multi-family residential data starts in the 2010s. CBRE are not specific about the starts dates of their data for less mature European markets, but it is prior to 2010 giving at least a 15-year time series.
Cushman and Wakefield have a highly disaggregated dataset of European rent and yield series across 33 countries with approaching 300 office rent points, over 250 retail high street, over 150 retail parks and more than 100 logistics and light industrial rent points. The time series are variable with some annual data going back to the early 1980s and quarterly data from 1993. But the vast majority of rent points have at least a ten-year history across all segments. In the office segment there is a variety of stock, take-up, availability and completions data for over 200 rent points with time series of 10 years or more. The less mature countries and those in CEE are Bulgaria, Cyprus, Czech Republic, Estonia, Greece, Hungary, Latvia, Lithuania, Macedonia, Poland, Romania, Serbia, Slovakia, Slovenia and Turkey.
Knight Frank monitor 49 cities across 22 countries for office, retail and industrial segments (46 office, 39 retail and 47 industrial). These are prime locations within each city and, in addition, a number of secondary locations are monitored for offices. They collect data on rents, yields and investment volumes for all segments. In addition, they collect take-up for industrial and offices and stock, completions and vacancy for offices and report a comprehensive time-series from around 2000 onwards, although some of the larger markets have data back into the 1990s. The locations include the capital cities of CEE countries Czech Republic, Estonia, Hungary, Latvia, Lithuania, Poland and Romania, plus Poznań in Poland.
Savills report that they collect data on 33 city/city regions across 18 European countries disaggregated to five property segments (Office, Logistics, High Street Retail, Shopping Centres and Retail Warehouses). They hold prime/secondary, rental levels and cap rates for all segments; vacancy rates, growth rates and take-up for offices and logistics; and development completions and national-level investment volumes for offices. The time series runs from 1990 in the UK and 2001 across mainland Europe and the locations include Poland, Czech Republic, Romania and Hungary.
For those firms who did not respond directly, there is some basic information in the public domain regarding their datasets and this is also set out in Appendix 2.
Data availability in the UK
The UK is the largest European commercial real estate investment market and is the largest market within MSCI outside of the US. This is the market which has therefore received the most attention regarding European long-term value modelling and testing and IPF (Citation2020) used the MSCI UK Quarterly Index and MSCI UK Monthly Index as its property market evidence base, splicing the two indices together to form a long-run quarterly index. In addition, IPF (Citation2020) also used the JLL Property Index and the CBRE Rent and Yield Monitor.
The MSCI UK Quarterly Index covers around 25% of the UK market, compared to around 35% for the annual index (MSCI, Citation2022). Due to the large coverage and large size of the market in the UK, the MSCI data can be disaggregated by geography and sector, and also produces location (town/city) specific local market indicators. It can also be analysed by other property characteristics such as size or lease structure. It produces a range of measures including market rental value growth, capital growth and the level of capitalisation rate or yield for over the last 20 years. In reality, as this is an interactive database made up of individual assets, subscribers can aggregate the assets using a wide variety of criteria, although they cannot access data on the individual assets.
The JLL and CBRE property indices also used in the IPF (Citation2020) study can also be disaggregated by property type and region. The JLL index is the longest running with quarterly three main sector continuous data back to 1977 and annual data back to 1967. CBRE have two major indices, a monthly index for the three main sectors and a hypothetical quarterly rent and yield monitor discussed earlier. As part of the IPF (Citation2020) study, these three sources were compared and found to be highly correlated, and the use of all three within the various modelling processes used gave the same early warning results. The detailed analysis is freely available at https://www.ipf.org.uk/resourceLibrary/ipf-long-term-value-methodologies-in-commercial-real-estate-lending-comparison-of-property-market-indices–july-2020–.html.
Property Market Analysis (PMA) started in the UK in the 1980s and has a particularly comprehensive set of UK data with detailed coverage of over 450 locations (listed in https://www.pma.co.uk/home/files/PMA%20UK%20coverage%20PROMIS%202020.pdf). Co Star is active in the UK, as well as in the US and Canada, and collects data on physical and tenure characteristics of individual properties and transactions in those properties where they are made publicly available. They claim to track 580,000 UK commercial buildings and have been operating in the UK for over 30 years providing ‘extensive and accurate’ commercial real estate building information. EG Radius, formerly Egi, tracks individual property data, transactions and other specific asset and market data, similar to Co Star.
In addition to these various property performance measurement and individual asset based, data sets there are numerous internal databases held by the property consultants, some of which were listed in the section on data availability in Europe. Many of these firms had their genesis in the UK before expanding into mainland Europe and their UK databases are in those cases the most comprehensive that they hold.
The UK is therefore the largest and most transparent CRE investment market in Europe and the most comprehensively documented and researched.
Transparency
The fact that data exists does not make it freely available. French (Citation2020) undertook research for the European Group of Valuers’ Organisations (TEGOVA) investigating the use of comparable evidence in property valuation. The responses were grouped by whether they came from a Highly Transparent, Transparent or Semi-Transparent country within Europe, according to the JLL Transparency Report (JLL, Citation2022). In the highly transparent countries, 80% of the respondents rejected the notion that it was difficult to get information because of either access or culture. This dropped to 45% and 50% for the transparent countries. The responses from the semi-transparent countries across Europe was almost a mirror image of the highly transparent responses with 80% and 73% saying that both access and culture, respectively, were a major issue with value-based property market data.
The over-riding conclusion of the research into data availability and access is that long-term national and local commercial property market data remains in private hands and is subject to payment for its release. The transfer of private information between market participants is subject to different attitudes and constraints within the different parts of Europe. The more information that is available for purchase within transparent markets, the less proprietorial the main property consultants become with their own information.
Any industry-wide modelling would come at a cost to the industry and/or to the regulators, if they chose to take on this task. For both reasons of availability and attitude to release of data, it would appear implementation of a long-term value regime would become progressively more difficult as national market immaturity increases.
Segment aggregation
A further question for any prudent valuation regime is the level of disaggregation necessary, if any, for the generation of market value adjustment factors. Regardless of what model is used, does disaggregation add to the accuracy of the adjustments or would a national all property adjustment factor produce the early warning signal necessary for the regulators to apply any constraints on CRE lending behaviours?
The results of Cardozo et al., (Citation2017) and IPF (Citation2020) suggest that both the All Property and the segment adjustment factors gave similar results. Crosby and Hordijk (Citation2023) undertook some preliminary analysis of the relationship between the All-Property index of MSCI and various disaggregation across that index by property type, region and city. This analysis is set within the academic literature on index disaggregation.
Fuerst and Marcato (Citation2011) found that traditional segmentation by property type and geographical regions’ main use was to describe the broad characteristics of a portfolio rather than as a predictor of performance. Different segmentations such as lease structure, yield levels and size of the property were better predictors of performance. Previous studies to this found for the UK that sector was an important determinant of performance, but region was less important (Hoesli et al., Citation1997, Lee, Citation2001; Lee & Devaney, Citation2007). There is, however, a significant academic literature on specific asset risk versus systematic risk and how many individual assets are required to create portfolios that eliminate most of the specific risk (Callendar et al., Citation2007). Recently, Reid (Citation2019) used ‘asset-level data from over 9,000 office assets in the MSCI Global Annual Property Index to explore the performance of small portfolios (1 to 30 assets) over two separate five-year periods (2007–2011 and 2013–2017) in 16 national markets’. He found that even quite small portfolios can substantially reduce volatility but that the results varied considerably across different markets and through time. The results were not always consistent, and this is important for this research as it raises the spectre that any results from analysis of one market are not necessarily going to be repeated across all markets within Europe.
illustrates the capital value index performance for the main sectors within the MSCI UK Quarterly Index. It suggests that between December 2000 and September 2022, there has been some commonality between the different sectors, apart from residential. An initial conclusion is that commercial and residential investment markets are different, and it is right that they have been separated for the purposes of this study. Within the commercial sectors, the largest differences in performance relate to retail and industrial and there is a well-documented debate on the impact of on-line shopping on property, with the rise of the warehouse/distribution sector at the expense of the high street. The retail sector has fallen in nominal value since 2000 by 7% overall while the industrial segment has risen in nominal capital value by nearly 140%.
Figure 2. UK capital value index 2000–2022.
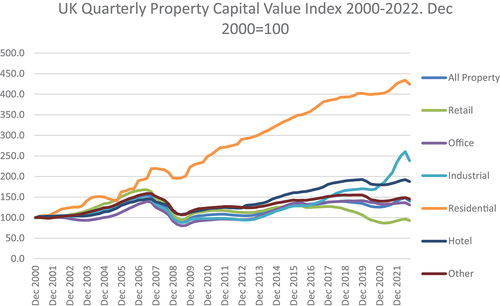
The disaggregation to main sector only hides some additional significant differences within sectors. shows the average quarterly capital value change over the last 22 years of the different segments within the MSCI Index. High street standard shop units have remained static while shopping centres have fallen by over 50% in value. Retail warehouses have grown in nominal value by 10% and supermarkets by over 90%. There are also major discrepancies between standard offices and office parks with an over 40% increase in the standard office against a nearly 30% fall in office park values. Standard industrial and distribution/warehouse values have grown by over 100% with standard industrial outstripping the distribution warehouse values.
Figure 3. Property segment and all-property correlations and capital growth 2001–2022.
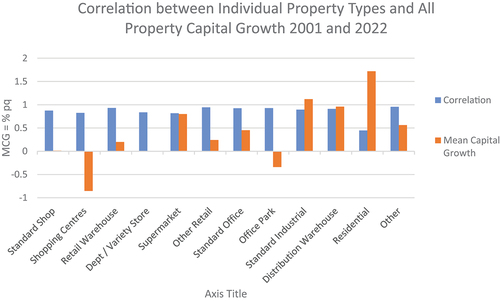
But the shape of the changes is much more consistent and correlations between the various segments and the All-Property quarterly capital value change are relatively high. So, while individual-sector performance varies, an all-property measure should capture when CRE markets are over-heated and market values require adjustment.
The alignment of different sectors to the cycles is illustrated in .
Figure 4. UK quarterly capital value change 2001–2022.
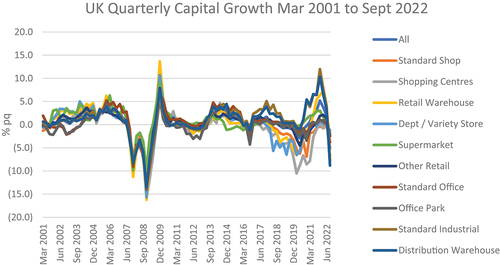
Despite the preliminary conclusion that a single all-property adjustment factor would work, the outcomes set out in illustrate that, in all cases, disaggregation to sector-level does improve the outcome. Only the relationship between retail and supermarkets does not improve to over 90%.
The picture of high correlations despite differences in the performance of the property segment is also true of regional differences.
Given the level of disaggregation possible within the MSCI UK index, the analysis of the similarities in cyclical movements could be extended across an almost infinite number of variations across regions and property types, and it could be extended into various other characteristics. However, the Crosby and Hordijk (Citation2023) preliminary analysis has shown identical characteristics across questions of property type and region.
Given the differences in CRE data availability between the mature and immature markets within Europe, city-level data may be the only possibility in the short term to developing long-term value MV adjustment factors within immature markets. So a legitimate question is the relationship between city-level performance and the performance of the whole market.
Crosby and Hordijk (Citation2023) looked at the relationship between the performance of the All-Property and main segment MSCI Quarterly Index with 14 UK cities outside London. The results showed a similar pattern with significant variation in performance but relatively high correlations between the cities and the All-Property Index, and that improved in most cases when each City sector was compared to the corresponding main segment index.
The preliminary overall conclusion is that any lack of disaggregation or the use of City level data due to data availability constraints is not fatal to the hypothesis that high-level through-the-cycle analysis of long-term prudent value will enable early identification of major mismatches between prices and sustainable long-term values caused by boom-and-bust cyclical movements in CRE values. But disaggregation across the UK market did provide some minor benefits to the detail of the analysis and improved the outcome of the modelling. And it should be noted that much of the econometric analysis within IPF (Citation2020), which produced the best test results when compared to the 1990 and 2007 CRE market downturns, was undertaken at a sector level using sector-specific inputs.
More sophisticated statistical analysis of the relationship between the different CRE market segments is necessary to support that conclusion.
Conclusions
The overall aim of the research was to assess the practicality of implementing a long-term prudent value model as a supplement to the market valuation model for use within UK and European CRE lending markets. The prudent value discussion is grounded in a number of different theories and concepts relating to real estate valuation and investment. The academic and professional literature on concepts of value and how they can be developed into definitions of value appears to have been ignored by regulators. This paper argues that prudent value is not a realistic definition that can be delivered through traditional valuation processes. It argues that prudent value is tied to investment market analysis and therefore theories of portfolio management and disaggregation have driven the response of this paper to the implementation of prudent value.
The specific objectives of the research were to:
Identify methodologies for the development of long-term valuation models and make recommendations for a preferred methodology.
Identify how that might be developed across individual countries within Europe and further develop previous findings on data requirements and availability.
Examine whether a common harmonised approach across individual countries within Europe is feasible and whether it needs to be applied at an individual property or market segment level.
Provide guidance to national professional valuer organisations on their role in supporting the development of a rational and deliverable long-term value methodology.
Over the last 15 years post GFC, a through-the-cycle long-term value method has been developed and tested against two major property market downturns. Since the Basel III prudent value framework was announced, the long-term valuation method produced from that work has been mapped onto it and a prudent value definition suggested which is:
Prudent value should be defined as the lower of either MV or a through-the-cycle long-term value.
Prudent value is not MV. MV does not fit the requirements of the Basel III prudent value framework. However, prudent value can be characterised as an adjusted market value. A long-term through-the-cycle value can be both higher and lower than MV, a situation specifically disallowed under the Basel III framework. Under the Basel III framework, market valuations in under-priced markets will exercise a major constraint on lending at a time when it would be prudent to encourage it. However, through-the-cycle prudent value will constrain lending in an over-priced market late-cycle boom period, which is when the vast majority of individual loan defaults occur and when such constraints are needed. The case study analysis found that the early warning signals for the 1990 and 2007 downturns were at least 2 years. We have not tested the impact on individual lender loan portfolios where there may be a wide diversity of loan-to-value ratios and therefore risks of a major downturn putting the lender’s loan book in jeopardy.
The proposed prudent value method relies on the analysis of markets via segments of the market rather than the analysis of individual properties to produce market value adjustment factors. It is market analysis, not valuation. Prudent value cannot be left to the inconsistent assumptions of individual valuers valuing individual properties.
In order to implement this method across the whole of Europe this research has examined the major constraints identified in the existing research, data requirements and availability. These questions were addressed by identifying the data the models need to operate them (both CRE and other economic and financial data) and the availability of that data across the different countries within Europe. This can be matched to the various long-term market analysis models, which require a range of different data across finance, investment, construction and real estate sectors.
That data exists at a national level, but the type of data and level of disaggregation is very variable across Europe. The main issues arise from the lack of public domain real estate data, but there are CRE datasets in private hands. The major property performance datasets in private ownership concentrate on the major institutional real estate markets, such as the three largest (UK, France, and Germany). However, there is some systematic data collection for the less mature CRE markets, particularly in capital cities and that may form the basis for an approach which is harmonised to some extent across the various groupings of highly transparent to semi-transparent markets.
This paper concentrates on the UK and Mainland Europe but only because these are the two jurisdictions that are actively considering implementation of the Basel 3 prudent value regime. Basel 3 is global guidance and Europe has a range of different market structures and maturities, including data availability across commercial real estate markets. This paper therefore has global implications for the implementation of Basel 3 across the full range of market maturities.
This paper is policy-based and has accepted the existing research which identified particular models and tested them comprehensively (IPF, Citation2020). So, the analysis of correlations between the performance of high level and more disaggregated segments is preliminary but confirms existing research into the relationship between different sectors within real estate markets. Segments tend to behave similarly and there is a property market effect that ranges across all geographical and property type segmentations. This phenomenon is also present in securities markets with a high level of correlation between individual company shares within the same segment of the economy. The overall conclusion is that an analysis of the equilibrium value at a low level of disaggregation, coupled with an individual property market valuation, will provide robust market value adjustment factors to be applied to an individual property market valuation. This needs to be further tested in more detail and with sophisticated statistical techniques.
If the EU and the UK continue on the current path of introducing a prudent valuation framework to be Basel III compliant, which seems very likely, a consistent and systematic approach needs to be found to operationalise the framework. The observations and recommendations are that:
It is virtually impossible to construct a robust, consistent prudent valuation regime at the level of the individual property.
It is possible to develop a relatively harmonised prudent value regime based on market analysis at a market segment level. A consistent and evolving regime which accords with the Basel III prudent valuation framework guidance is deliverable across the EU and the UK.
The regime should be based on the provision of asset-specific market valuations, which take into account-specific asset characteristics, coupled with centrally managed market adjustment factors, which can be developed and updated periodically based on long-term analysis of real estate market cycles.
There are some major constraints to implementation, not least that the necessary property market data is mostly in private hands and, in most jurisdictions, is not collated systematically outside of the major cities.
National regulators and CRE industry/valuation institutions need to collaborate and establish a working model for each individual country, and free the private data to run it. This will need regular funding and technical support as some of the models are highly technical and require specialists to operate them. National regulators and professional institutions need to be contracted with a funding stream so that MV adjustment factors can be identified and updated periodically. As datasets and methods evolve so can the level of disaggregation, which may or may not (subject to monitoring) improve the functionality of the models (which also need monitoring and potential upgrading).
At the time of writing, the proposed implementation date for the EU CRR is 2025. The amount of work necessary to source the necessary data and develop the modelling framework across the full range of European locations is significant. If the European real estate industry wants to show it can deliver this approach, they need to start developing the data and modelling very soon. Probably the only property data that has been consistently collected across both the mature and less mature markets in Europe is capital city-level data and the dominance of market factors rather than individual property asset factors on performance would suggest that may be enough to develop a simple data set and model that fulfils the early warning signal criteria. There is a coalition of European organisations emerging who support this approach and feel that these next steps need to be undertaken quickly to inform EU thinking on the implementation of this part of Basel 3. It is important that the EU and UK implementation is sound as it may form the template for global application of Basel 3 prudent value. Basel 3 is guidance, but many global jurisdictions aim to implement Basel Accords into legislation.
The overall message of this research is that, despite the virtual impossibility of developing prudent valuation methods at the individual property level, a relatively harmonised prudent value regime based on market analysis in accordance with Basel III guidance is deliverable across the EU and the UK, possibly with some major short-term variation between countries.
Disclosure statement
No potential conflict of interest was reported by the author(s).
Additional information
Funding
Notes on contributors
Neil Crosby
Neil Crosby, MRICS has over 40 years of experience in real estate and is Professor Emeritus of the University of Reading, formally retiring in 2022 having held the Chair in Real Estate for 29 years, following previous academic positions at Oxford Brooks University (1989–1993), University of Reading (1986 – 1989) and Nottingham Trent University (1977 – 1986). He has been a member of the RICS Global Valuation Expert Working Group, formerly the Valuation Standards Board, since the 1990s and published over 150 papers on commercial real estate and appraisal and valuation theory and practice.
Aart Hordijk
Aart Hordijk, MRICS has 35 years of experience in real estate and is Professor Emeritus of Tilburg University having held the ROZ chair in Real Estate Valuation from 2010 to 2013. Previous academic positions include Associate Professor Valuation at the University of Amsterdam (2000–2004), Visiting Professor in Real Estate Economics at Antwerp Management School since 2003, Visiting Professor Valuation at Delft University of Technology (2005–2015) and Professor at Nyenrode University between 2007 and 2010. Industry appointments include the Director ROZ Real Estate Council (1995–2016) in the Netherlands, and director of ROZ/IPD Netherlands Property Index (until 2011) playing a leading role in the development of the major property index in the Netherlands.
References
- Adams, Z., & Füss, R. (2012). Disentangling the short and long-run effects of occupied stock in the rental adjustment process. The Journal of Real Estate Finance & Economics, 44(4), 570–590. https://doi.org/10.1007/s11146-010-9250-7
- Allen, F., & Gale, D. (1999). Bubbles, crises, and policy. Oxford Review of Economic Policy, 15(3), 9–18. https://doi.org/10.1093/oxrep/15.3.9
- Ambrose, B., & Nourse, H. (1993). Factors influencing capitalization rates. Journal of Real Estate Research, 8(2), 221–237. https://doi.org/10.1080/10835547.1993.12090706
- Bank of England. (2015) Financial stability report, December. https://www.bankofengland.co.uk/financial-stability-report/2015/december-2015
- Baum, A., Crosby, N., & MacGregor, B. (1996). Price formation, mispricing and investment analysis in the property market: A response to “A note on ‘the initial yield revealed: Explicit valuations and the future of property Investment’”. Journal of Property Valuation and Investment, 14(1), 36–49. https://doi.org/10.1108/14635789610107480
- BCBS. (2017). Basel III: Finalising post-crisis reforms. Bank for International Settlements. https://www.bis.org/bcbs/publ/d424.pdf
- Borio, C., Furfine, C., & Lowe, P. (2001). Procyclicality of the financial system and financial stability: Issues and policy options in marrying the macro- and microprudential dimensions of financial stability. Bank for International Settlements (BIS) Papers, 1–57.
- Brounen, D., & Jennen, M. (2009a). Asymmetric properties of office rent adjustment. The Journal of Real Estate Finance & Economics, 39(3), 336–358. https://doi.org/10.1007/s11146-009-9188-9
- Brounen, D., & Jennen, M. (2009b). Local office rent dynamics: A tale of ten cities. The Journal of Real Estate Finance & Economics, 39(4), 385–402. https://doi.org/10.1007/s11146-008-9118-2
- Bruneau, C., & Cherfouh, S. (2015). Long-run equilibrium for the greater Paris office market and short-run adjustments. Journal of Property Research, 32(4), 301–323. https://doi.org/10.1080/09599916.2015.1089310
- Brunnermeier, M. K., & Pedersen, L. H. (2009). Market Liquidity and Funding Liquidity. The Review of Financial Studies, 22(6), 2201–2238. https://doi.org/10.1093/rfs/hhn098
- Burston, B., & Burrell, A. (2015) What is fair value? IPF short paper 24. Investment Property Forum. https://www.ipf.org.uk/resourceLibrary/what-is-fair-value---april-2015--short-paper.html
- Callendar, M., Devaney, S., Sheahan, A., & Key, T. (2007). Risk reduction and diversification in UK commercial property portfolios. Journal of Property Research, 24(4), 355–375. https://doi.org/10.1080/09599910801916279
- Cardozo, C., Clarke, R., Crosby, N., & McTique, J. (2017). Prudent value methodologies and real estate lending. Report for the Property Industry Alliance. Investment Property Forum / Commercial Real Estate Finance Council Europe. http://www.ipf.org.uk/asset/D05FA2C5-487D4C76-997B57F3A3D72BAD/
- Chau, K. W., & Wong, S. K. (2016). Information asymmetry and the rent and vacancy rate dynamics in the office market. The Journal of Real Estate Finance & Economics, 53(2), 162–183. https://doi.org/10.1007/s11146-015-9510-7
- Chen, J., Hudson-Wilson, S., & Nordby, N. (2004). Real Estate Pricing: Spreads & Sensibilities: Why Real Estate Pricing is Rational. Journal of Real Estate Portfolio Management, 10, 1–22. https://doi.org/10.1080/10835547.2004.12089692
- Chervachidze, S., Costello, J., & Wheaton, W. (2009). The secular and cyclic determinants of capitalization rates: The role of property fundamentals, macroeconomic factors and “structural changes”. The Journal of Portfolio Management, 35(5), 50–69. https://doi.org/10.3905/JPM.2009.35.5.050
- Chervachidze, S., & Wheaton, W. (2013). What determined the great cap rate compression of 2000–2007, and the dramatic reversal during the 2008–2009 financial crisis? The Journal of Real Estate Finance & Economics, 46(2), 208–231. https://doi.org/10.1007/s11146-011-9334-z
- Clarke, R. J. (2018). The CRE Lending Black Hole: Steady gains followed by extreme pains. Report for the Property Industry Alliance Debt Group. Lipton Rogers. https://propertyindustryalliance.files.wordpress.com/2018/10/cre-lending-report-final.pdf
- Crosby, N., & Devaney, S. (2019) Appraisal-based indices In MacGregor, B. D, Schulz, R, and Green, R. K. (eds.), Routledge Companion to real estate investment (pp. 172–91). Routledge .
- Crosby, N., Devaney, S., Lizieri, C., & Mansley, N. (2022). Modelling sustainable rents for estimation of long-term or fundamental values of commercial real estate. Journal of Property Research, 39(1), 30–55. https://doi.org/10.1080/09599916.2021.1913441
- Crosby, N., French, N., & Oughton, M. (2000). Bank lending valuations on commercial property – Does European mortgage lending value add anything to the process?. Journal of Property Investment & Finance, 18(1), 66–83. https://doi.org/10.1108/14635780010316663
- Crosby, N., & Hordijk, A. (2021) Approaches for Prudent Property Valuations across. Europe. https://www.rics.org/globalassets/rics-website/media/upholding-professional-standards/sector-standards/valuation/approaches-for-prudent-property-valuations-across-europe-report-2021-05-10.pdf
- Crosby, N., & Hordijk, A. (2023). The implementation of long-term prudent valuation models across the UK and Mainland Europe for financial regulation purposes. Research Report for Investment Property Forum and Property Research Trust. https://www.ipf.org.uk/resourceLibrary/the-implementation-of-long-term-prudent-valuation-models-across-the-uk-and-mainland-europe-for-financial-regulation-purposes–march-2023–report.html
- Crosby, N., & Hughes, C. (2011). The basis of valuations for secured commercial property lending in the UK. Journal of European Real Estate Research, 4(3), 225–242 . https://doi.org/10.1108/17539261111183425
- De Francesco, A. J. (2008). Time-Series characteristics and long-run equilibrium for major Australian Office Markets. Real Estate Economics, 36(2), 371–402. https://doi.org/10.1111/j.1540-6229.2008.00217.x
- Duca, J. V., & Ling, D. C. (2018). The other (commercial) real estate boom and bust: The effects of risk premia and regulatory capital arbitrage. Journal of Banking and Finance, 112(2020), 105317. https://doi.org/10.1016/j.jbankfin.2018.03.006
- EC. (2021) Proposal for a regulation of the European Parliament and of the council amending regulation (EU) No 575/2013 (the Capital Requirements regulation or CRR). https://ec.europa.eu/commission/presscorner/detail/en/ip_21_5401.
- Englund, P., Gunnelin, Å., Hendershott, P. H., & Söderberg, B. (2008). Adjustment in property space markets: Taking long-term leases and transaction costs seriously. Real Estate Economics, 36(1), 81–109. https://doi.org/10.1111/j.1540-6229.2008.00208.x
- ESRB. (2015). Recommendation of the European systemic risk board of 15 December 2015 on the assessment of cross-border effects of and voluntary reciprocity for macroprudential policy measures (ESRB/2015/2) (2016/C 97/02). European Systematic Risk Board.
- ESRB. (2016) Recommendation of the European Systemic Risk Board of 31 October 2016 on Closing Real Estate Data Gaps(esrb/2016/14) (2017/C 31/01). https://www.esrb.europa.eu/pub/pdf/recommendations/2016/ESRB_2016_14.en.pdf
- ESRB. (2022, March). Review of the EU macroprudential framework for the banking sector : A concept note. European Systematic Risk Board.
- Eurostat. (2017). Commercial property price indicators: Sources, methods and issues. European Union. https://op.europa.eu/en/publication-detail/-/publication/22b5dd78-e539-11e7-9749-01aa75ed71a1/language-en
- French, N. (2020) Pricing to market - an investigation into the use of comparable evidence in property valuation. TEGOVA. https://tegova.org/data/bin/a5eff013f34586_Report_on_Comparable_Evidence_in_Property_Valuation.Nick_French.June_2020.pdf
- Fuerst, F., & Marcato, G. (2011). Re-thinking commercial real estate market segmentation. SSRN Electronic Journal. Available at SSRN or. https://doi.org/10.2139/ssrn.1692953
- Gordon, M. J., & Shapiro, E. (1956). Capital equipment analysis: The required rate of profit. Management Science, 3(1), 102–110. https://doi.org/10.1287/mnsc.3.1.102
- Gourinchas, P.-O., & Rey, H. (2019) Global Real Rates: A Secular Approach. Econometric Modeling: Macroeconomics eJournal. https://www.semanticscholar.org/paper/Global-Real-Rates%3A-A-Secular-Approach-Gourinchas-Rey/3389346877cd2ea2986b1d0fdc75e197d61570bf
- Hendershott, P. H. (1996). Rental adjustment and valuation in overbuilt markets: Evidence from the Sydney office market. Journal of Urban Economics, 39(1), 51–67. https://doi.org/10.1006/juec.1996.0003
- Hendershott, P. H., Jennen, M., & MacGregor, B. D. (2013). Modelling space market dynamics: An illustration using panel data for US retail. The Journal of Real Estate Finance & Economics, 47(4), 659–687. https://doi.org/10.1007/s11146-013-9426-z
- Hendershott, P. H., Lizieri, C. M., & MacGregor, B. D. (2010). Asymmetric adjustment in the city of London office market. The Journal of Real Estate Finance & Economics, 41(1), 80–101. https://doi.org/10.1007/s11146-009-9199-6
- Hendershott, P. H., & MacGregor, B. D. (2005a). Investor rationality: An analysis of NCREIF commercial property data. Journal of Real Estate Research, 27(4), 445–476. https://doi.org/10.1080/10835547.2005.12091167
- Hendershott, P. H., & MacGregor, B. D. (2005b). Investor rationality: Evidence from U.K. Property capitalization rates. Real Estate Economics, 33(2), 299–322. https://doi.org/10.1111/j.1540-6229.2005.00120.x
- Hendershott, P. H., MacGregor, B. D., & Tse, R. Y. C. (2002). Estimation of the rental adjustment process. Real Estate Economics, 30(2), 165–183. https://doi.org/10.1111/1540-6229.00036
- Hendershott, P., MacGregor, B., & White, M. (2002). Explaining real commercial rents using an error correction Model with Panel Data. The Journal of Real Estate Finance & Economics, 24(1/2), 59–87.
- Hoesli, M., Lizieri, C., & MacGregor, B. (1997). The spatial dimensions of the investment performance of UK commercial property. Urban Studies, 34(9), 1475–94. https://doi.org/10.1080/0042098975529
- Ibanez, M. R., & Pennington-Cross, A. (2013). Commercial property rent dynamics in U.S. Metropolitan areas: An examination of office, industrial, flex and retail space. The Journal of Real Estate Finance & Economics, 46(2), 232–259. https://doi.org/10.1007/s11146-011-9347-7
- ICB. (2011) Final Report Recommendations, Independent Commission for Banking, September 2011. https://webarchive.nationalarchives.gov.uk/ukgwa/20120827143059/http://bankingcommission.independent.gov.uk///
- IPF. (2020). Long-term value methodologies in commercial real estate lending. Investment Property Forum.
- IVS. (2022). International valuation standards. IVSC.
- Jensen, M. C., & Meckling, W. (1976). Theory of the firm: Managerial behaviour, agency cost and ownership structure. Journal of Financial Economics, 3(4), 305–360. https://doi.org/10.1016/0304-405X(76)90026-X
- JLL. (2022). Global real estate transparency index, 2022. Chicago.
- Jud, D., & Winkler, D. (1995). The capitalization rate of commercial properties and market returns. Journal of Real Estate Research, 10(5), 509–518. https://doi.org/10.1080/10835547.1995.12090801
- Ke, Q., & White, M. (2009). An econometric analysis of Shanghai office rents. Journal of Property Investment & Finance, 27(2), 120–139.
- Ke, Q., & White, M. (2015). Retail rent dynamics in two Chinese cities. Journal of Property Research, 32(4), 324–340. https://doi.org/10.1080/09599916.2015.1092464
- Lee, S. (2001). The relative importance of property type and regional factors in real estate returns. Journal of Real Estate Portfolio Management, 7(2), 159–168.
- Lee, S., & Devaney, S. (2007). The changing importance of sector and regional factors in real estate returns: 1987–2002. Journal of Property Research, 24(1), 55–69. Lee, 2001. https://doi.org/10.1080/09599910701297671
- Lind, H. (2005). Value concepts, value information and cycles on the real estate market: A comment on Crosby, French and Oughton. Journal of Property Investment & Finance, 23(2), 141–147.
- McCartney, J. (2012). Short and long-run rent adjustment in the Dublin office market. Journal of Property Research, 29(3), 201–226. https://doi.org/10.1080/09599916.2012.689990
- McParland, C., McGreal, S., & Adair, A. (2000). Concepts of price, value and worth in the United Kingdom – towards a European perspective”. Journal of Property Investment & Finance, 18(1), 84–102. https://doi.org/10.1108/14635780010316672
- Mooya, M. (2016). Real Estate Valuation Theory. Springer Verlag.
- Mouzakis, F., & Richards, D. (2007). Panel data modelling of prime office rents: A study of 12 major European markets. Journal of Property Research, 24(1), 31–53. https://doi.org/10.1080/09599910701297713
- MSCI. (2022) Real Estate Market Size Report 2021-2022 (https://www.msci.com/documents/10199/8f62c2a3-8374-cbf9-a7d2-a8c2c5e63e62#:~:text=information%20on%20individual%20real%20estate,investment%20portfolios%20was%20%242.5%20trillion)
- Özdilek, Ü. (2016). Value Expectation, Expression and Estimation. Journal of Creating Value, 2(2), 245–256. https://doi.org/10.1177/2394964316674755
- Rachel, L., & Smith, T. D. (2015). Staff working paper No. 571 Secular drivers of the global real interest rate. Bank of England https://www.bankofengland.co.uk/working-paper/2015/secular-drivers-of-the-global-real-interest-rate.
- REFG and IPF. (2014) . A vision for Real Estate Finance in the UK. Real Estate Finance Group and Investment Property Forum.
- Reid, B. (2019). Risk reduction and tracking error in small commercial real estate portfolios. The Journal of Portfolio Management, 45(7), 130–140. https://doi.org/10.3905/jpm.2019.1.101
- Ricardo, D. (1821). On the Principles of Political Economy and taxation (3rd ed.). John Murray.
- RICS Europe. (2018) Bank lending valuations and mortgage lending value. RICS Professional Standards and Guidance, Europe. RICS Europe: https://www.rics.org/globalassets/rics-website/media/upholding-professional-standards/sector-standards/valuation/bank-lending-valuations-and-mortgage-lending-value-1st-edition-rics.pdf.
- Sivitanides, P., Southard, J., Torto, R. G., & Wheaton, W. C. (2001). The determinants of appraisal-based capitalization rates. Real Estate Finance, 18(2), 27–38.
- Smith, A. (1776). The wealth of nations.
- Stevenson, S. (2007). Exploring the intra-Metropolitan dynamics of the London office market. Journal of Real Estate Portfolio Management, 13(2), 93–98. https://doi.org/10.1080/10835547.2007.12089774
- Stiglitz, J. E. (1990). Symposium on bubbles. Journal of Economic Perspectives, 4(2), 13–18. https://doi.org/10.1257/jep.4.2.13
- Wheaton, W. C. (1999). Real estate “cycles”: some fundamentals. Real Estate Economics, 27(2), 209–230. https://doi.org/10.1111/1540-6229.00772
- White, M., & Ke, Q. (2014). Investigating the dynamics of, and interactions between, Shanghai office submarkets. Journal of Property Research, 31(1), 26–44. https://doi.org/10.1080/09599916.2013.765500
Appendix 1 – Modelling literature and variables used in the modelling
Table A1. Data used for error correction modelling of office rents.
Table A2. Data used for error correction modelling of retail rents.
Table A3. Data used for error correction modelling of industrial rents.
Appendix 2 – Additional property market data held in private datasets
Property Market Analysis is a private company specialising in global real estate data which claims to be the “world’s leading independent real estate research consultancy”. It has an extensive dataset for the UK and also operates within the US, Europe and Asia Pacific markets. Its core markets are offices, retail, logistics and hotels. In Mainland Europe, 17 countries are covered (Austria, Belgium, Czech Republic, Denmark, Finland, France, Germany, Hungary, Ireland, Italy, Luxembourg, The Netherlands, Norway, Poland, Portugal, Spain and Sweden). The 29 cities covered are Vienna, Antwerp, Brussels, Prague, Copenhagen, Helsinki, Lille, Lyon, Marseille, Paris, Berlin, Cologne, Dusseldorf, Frankfurt, Hamburg, Munich, Stuttgart, Budapest, Dublin, Milan, Rome, Luxembourg, Amsterdam, Rotterdam, Oslo, Warsaw, Lisbon, Barcelona, Madrid and Stockholm. The European list of locations matched to the four main property segments identified above can be seen at https://www.pma.co.uk/home/files/PMA%20European%20Coverage.pdf. The reported data availability for these European locations is quarterly including rents, yields, capital values, vacancies, starts, net additions, and net absorption.
Real Capital Analytics, now part of the MSCI group, claims to be “the industry’s only global real-time database of commercial real estate transactions” (MSCI indices discussed above are valuation-based) having recorded over $40 trillion of commercial property transactions linked to over 200,000 investor and lender profiles during a 20 year + time period. It also links to a number of specialised datasets for CRE in Canada, Germany, China, US, Portugal, Australia, Hong Kong, South Korea, France, Austria, Malaysia, Japan, India, Brazil, the Netherlands and South Africa. Some of these are highly localised, such as “The Network” in Canada, serving two territories only, and it includes RIWIS in Germany.
The RIWIS dataset was used by Adams and Füss (Citation2012) for their study of rents in 30 German cities between 1991 and 2007 (See ). RIWIS produce the German Property Index (GPI) which is a property-performance-index, calculated on the basis of available market data collected by RIWIS. The GPI provides the total return, based on the capital growth return and cash flow return. The index draws upon market data for 127 German cities, covering the office, retail, residential and logistics markets. Results can be disaggregated by region and sector as well as by city. MSCI also have a German Index (see Table 5).
JLL publish office rents for 23 European city locations with an index from 2005.
BNP Paribas monitor around 40 city locations across Europe
Colliers’ European snapshot reports on 13 countries including Romania, Czech Republic and Poland.