
ABSTRACT
Aphasia research uses the length of time within rehabilitation sessions as the main measure of dosage. Few papers detail therapeutic ingredients or outline the number of times these were delivered over the treatment period. The present observational study identified therapeutic ingredients in the Very Early Rehabiltiation in SpEech (VERSE) trial and explored the dosage provided using a model of cumulative intervention intensity (CII). Therapists video recorded one therapy session per week and 53 (12%) randomly selected therapy videos were analysed. The videos were coded for number of error productions, self-corrections and type and frequency of therapist cueing. The Western Aphasia Battery Revised-Aphasia Quotient (WABR-AQ) was used for measuring patient outcome with total verbal utterances (p < 0.001) and cues used with success (p < 0.001) being independent positive predictors of WABR-AQ score at six months post stroke and hypothesized as key therapeutic ingredients. The CII was calculated by counting identified therapeutic ingredients and multiplying this by the number of sessions completed. Collectively, the key ingredients occurred on average 504 times per session and over 10,000 times per participant during the treatment period. This paper reports a novel approach for identifying key treatment ingredients and detailing the dosage delivered within an early aphasia rehabilitation trial.
Introduction
The rehabilitating brain and dosage
Rehabilitation has progressed from a focus on rheumatic diseases in the nineteenth century, through war time needs, to the present day. More people are surviving brain injury than ever before, resulting in greater demands placed on rehabilitation services (van de Sandt-Koenderman et al., Citation2012). For rehabilitation to be successful, the brain relies on complex chemical and neuronal mechanisms to induce permanent adaptation in cognitive processes. Learning is a cognitive process essential to successful rehabilitation. Behavioural therapy for impairments after a brain lesion do not aim to provide a cure but to maximize the capacity of the damaged networks to re-learn with experience and for learning to alter the neural functioning at a synaptic level (Murphy & Corbett, Citation2009; Varley, Citation2011). Identifying the optimal treatment and its dosage is highly complex given the myriad of factors that may influence the effect of treatment (Kamhi, Citation2012). Important components of the rehabilitation jigsaw may include dosage, therapeutic relationship, medium of therapy delivery, client motivation, cognitive ability, neurological stability (Whitworth et al., Citation2014) as well as task-specific practice (Lang et al., Citation2015). Developing an understanding of the key elements of therapy needed and the dosage with which these should be delivered are likely to be an important piece of the rehabilitation jigsaw.
Learning within neurorehabilitation sessions is concerned both with client acts and inputs from the therapist (Kleim & Jones, Citation2008). The dosage at which these are delivered is crucial. Treatment sessions aim to capitalize on and enhance the brain’s natural inherent plasticity that underpins learning (Crosson et al., Citation2019). Neurorehabilitation focuses largely on practice dependent learning that occurs when an individual repeatedly uses a skill to induce lasting neuronal change (Robbins et al., Citation2008). This focus is grounded largely in Hebbian learning theory which proposes learning occurs by connections that develop through inputs that co-occur and can be summarized by “neurons that fire together wire together” (Hebb, Citation1949). It requires repetition to induce lasting cellular changes that add stability to the network (Pulvermuller & Berthier, Citation2008). Neuronal assemblies must be repeatedly active at the same time when forming links (Pulvermuller & Berthier, Citation2008). Increased repetition of a newly learned behaviour may be required to induce lasting neural changes (Kleim & Jones, Citation2008) and so, in theory, the more frequently two relevant brain events occur together, the more the critical connections will be strengthened (Pulvermuller & Berthier, Citation2008). Assuming that therapy can induce coincidental learning, it has been hypothesized that more training will help improve learning and may change behaviour (Pulvermuller & Berthier, Citation2008). It is also hypothesized that there is a point of diminishing return to increasing the amount of therapy and so the dosage associated with a therapeutic “sweet spot” is yet to be discovered (Yoder et al., Citation2012). Additionally, there is the term “reaction range” indicating that the response to therapy varies depending on the individuals brain functioning (Gottesman, Citation1963; Yoder et al., Citation2012). Both of these concepts need to be considered in neurorehabilitation as increasingly, particularly with aphasia therapy, intense may not be better (Godecke et al., Citation2018).
Defining dosage
There is no consensus for a definition of dosage within the stroke rehabilitation literature. Dosage has been defined as the amount of the active ingredient delivered at any one time, the frequency with which the active ingredient is delivered and time duration or length of time across which the active ingredient needs to be delivered in order to produce the desired effect (Lang et al., Citation2015). Frequently, in the stroke rehabilitation literature, the terms intensity and dosage are used interchangeably. There has been a call for consistent distinct terminology as the terms intensity and dosage have been used to refer to a greater number of therapeutic events occurring in a shorter amount of time, greater number of hours in therapy massed or distributed, or a greater number of total hours of therapy (Harnish et al., Citation2014). Definitions of dosage vary in the physical therapy literature with some defining dose as the amount of time actively spent in practice and others as the number of repetitions of a movement. However, the concept of repeated episodes of intervention over a period of time is common across the different definitions of dosage (Baker, Citation2012). In a meta-analysis of dose–response relationships in stroke rehabilitation, the dosage measure of therapy time was used as this was the most consistently reported measure in studies (Lohse et al., Citation2014). The authors acknowledged that ideally active time in movement practice or movement repetitions would be reported and used in subsequent meta-analyses. Although the measurement of limb movements or repetitions is different to the measurement of repetition in language based activities, the same challenges associated with measuring dosage are present. This paper uses the definitions of dose and intensity outlined by Warren et al. (Citation2007) which is explained further. Regardless of how dosage is defined, increasing the dose of rehabilitation interventions is a major challenge for therapists (Vratsistas-Curto et al., Citation2019). Computerized or technology-based therapies have the potential to support increasing the dose of therapy as patients may practice independent of the therapist and be set dose targets to attain. There may be additional benefits to computerized therapies such as obtaining data on dose and practice fidelity without relying on therapist report or monitoring therapist participant interactions.
Measuring dosage
The measurement of dosage is complex in behavioural interventions however needs to be considered in planning and monitoring interventions. In planning an intervention it is not only important for researchers to specify a therapy type but also whether an intended level of dosage (amount in the session) is a key component of the therapy. In the implementation of the intervention the level of dosage provided should be measured and then reported within publications. These processes are needed in order to develop a greater understanding of the impact of the dosage within the interventions being trialled. Despite the complexity in measuring dosage it is vitally important to make sure the minimum required dosage level is planned for and achieved in treatment efficacy research. Specifying dosage will allow for improved treatment fidelity, facilitate the completion of replication studies and better therapy delivery to patients (Harnish et al., Citation2014). As an example, Bakheit et al. (Citation2007) reported that only thirteen of the fifty one participants received the intensive aphasia intervention as planned. The study cited that it was likely the amount of therapy received by the intensive therapy group was below the threshold that is required to significantly enhance recovery of language function (Bakheit et al., Citation2007; Robey, Citation1998).
A formula for dosage
While it is acknowledged that is important to measure the dosage of an intervention, a definition of dosage and a method of measuring dose is not yet well accepted. Warren et al. (Citation2007) called for behavioural scientists to adopt a similar approach to the pharmacological studies and investigate therapeutic effects for different dosage levels. They proposed a comprehensive model of intervention intensity and this was adapted and applied by Baker (Citation2012). The model provides a method of determining the dose of a treatment, or the Cumulative Intervention Intensity (CII), across an intervention period by first considering the task in which the teaching episode takes place. In the CII formula the focus is shifted from session duration to the number of times an ingredient occurs per session. Session duration in minutes is only considered when measuring a dose rate (Dose/session duration (mins)). The concept has been praised for encouraging researchers to develop a quantitative model of interactive factors to describe a treatment approach. outlines Baker’s (Citation2012) application of Warren et al. (Citation2007) dosage concepts visually.
Figure 1. Reproduced with permission from Baker (Citation2012).
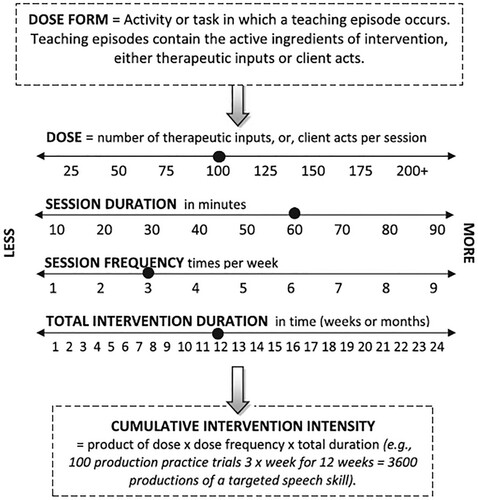
Parameters involved in determining the optimal intensity of intervention, based on Warren et al. (Citation2007).
The application of most of these parameters appears straight forward for aphasia research. However, even the simplest treatments are multifaceted (Warren et al., Citation2007) and identifying the teaching episodes that contain the active ingredients is the most difficult aspect of implementation. It is unclear which factors contribute to cumulative intervention intensity and whether these will influence treatment outcome in aphasia (Crosson et al., Citation2019). Even a picture naming task in therapy involves many cognitive processes that could contain a number of active ingredients such as the cueing or feedback used by the therapist, and whether the task is at the correct challenge point for the people with aphasia (PWA). There is the additional complexity of whether the accuracy of production counts or discounts a teaching episode. For example, an error made during stimulus production may exclude that attempt in the dosage calculation, depending on the underlying theory of the treatment. Warren et al. (Citation2007) suggest that this is one of the benefits of the model in that it requires clinicians and researchers to think about and specify what their active ingredients are as well as the theory underpinning them. More broadly, researchers need to consider whether interventions could be examined to identify the active ingredient/s in order to measure these and prescribe a dose (Baker, Citation2012).
Active ingredients in aphasia therapy
Behavioural interventions are thought to have one or more active ingredients. Articles about complex treatments often don't provide information on active ingredients (Behn et al., Citation2019; Ludemann et al., Citation2017; Yamato et al., Citation2016) or their corresponding dosage because it hasn’t been investigated, possibly due to the challenges associated with measuring these components (Cherney, Citation2012). Aphasia and other complex interventions can be viewed as a “black box” containing therapeutic inputs and clients’ outputs with little understanding of how the components of therapy work. Dissecting the “black box” of treatments, in order to identify the active ingredients and explain how they work, is a challenge for researchers and practitioners. One explanation for why we lack more detailed understandings of therapies is that rehabilitation practice is frequently not theory driven (Dijkers et al., Citation2014). If researchers were able to disaggregate interventions to test theory driven hypotheses about potential active ingredients we may have more knowledge about the individual and joint effects of our treatments not just whether they work or not (Dijkers et al., Citation2014).
When the targeted goals are complex, defining teaching episodes becomes very challenging (Hoffman, Citation2009). Baker (Citation2012) has highlighted that dosage can only be determined accurately when active ingredients within teaching episodes have been identified. In doing this it is important to consider how the underlying theory is applied in the development of the treatment. For example, neuroplasticity principles state that accurate, error-free practice of a skill is beneficial for rehabilitation outcomes (Biernaskie & Corbett, Citation2001; Nudo, Citation2013; Raymer et al., Citation2008). Therefore, investigations of therapy may focus on the quantity and accuracy of language produced by PWA. The rationale for examining how much PWA say is that (a) improvement in therapy is experience dependent and (b) a lack of experience of practice may result in learned non-use (Pulvermuller et al., Citation2001; Pulvermuller & Berthier, Citation2008). Therapy should involve practising tasks, involving an error minimization approach, to avoid a lack of experience causing atrophy in the network as well avoiding the strengthening of negative neural networks (Varley, Citation2011). If recovery depends both on the quantity and accuracy of PWA production then therapist behaviours, including cueing to facilitate successful outputs from the PWA, together with the PWA’s production or output within therapy, are key to recovery. This is in line with Baker’s (Citation2012) view that active ingredients can involve therapeutic inputs or client acts.
Aphasia rehabilitation and dosage
According to the most recent Cochrane review, speech therapy is beneficial for people with aphasia (Brady et al., Citation2016). However, there is a dearth of literature on the optimal intervention intensity and the dose with which intervention should be delivered (Baker, Citation2012; Off et al., Citation2016). As such, the optimal treatment regimen in aphasia rehabilitation is unknown (Dignam et al., Citation2015). Despite the existence of definitions for intensity and dosage (Baker, Citation2012; Warren et al., Citation2007), operational definitions of treatment intensity and dosage have not been agreed upon and are not applied consistently within aphasia research. Additionally, when time in therapy is used as a definition on treatment intensity and/ or dosage, there is inconsistency in the description of what constitutes high and low dose therapy provision. For example dosage is described, within the Cochrane review (Brady et al., Citation2016), as hours of therapy provided reflecting the way in which dosage is most commonly reported in studies in the review. The number of therapy hours in the “high dose” speech language pathology (SLP) intervention varied from twenty seven hours up to 208 h whereas “low dose” received five hours to 78 h. The inconsistency in terminology presents a challenge for researchers and clinicians.
When intensity has been investigated as a key factor in the outcome of therapy it is unclear if the impact of therapy is due to the intensity with which the therapy was provided or what was contained within the therapy (Sage et al., Citation2011). While many aphasia studies, as per the Cochrane review, report intervention dosage using time, they give little insight into active ingredients or within session therapy dosage. When Cherney (Citation2012) compared eleven studies across 195 participants for high and low intensity aphasia they found that only 3 studies provided information on the dosage level delivered within the session, or the number of times a teaching episode containing an active ingredient occurred per session. It is not only that intervention studies are not reporting optimal intensity, but the dosage of a “typical” aphasia therapy session is also unknown as benchmarking studies are rarely undertaken (Enderby, Citation2012). This means many therapists are therefore unaware of the dosage they are providing in usual care, or the active ingredients of the therapy, so it is also important to establish normative data prior to dosage manipulation (Dignam et al., Citation2015).
Efforts have been made more recently to specify key therapeutic ingredients and report the dosage of these within trials. Dignam et al. (Citation2015) provided the cumulative treatment intensity as per Warren et al.’s (Citation2007) model for the treatment delivered in the first dosage controlled, parallel-group design study to compare the short and long term therapeutic outcomes of massed versus distributed comprehensive aphasia programme in participants with chronic aphasia. Distributed over massed practice was favoured in which therapy in the distributed arm involved 6 h per week for 8 weeks days whereas participants in the intensive practice arm received 16 h per week for 3 weeks. All participants received Aphasia LIFT therapy (Rodriguez et al., Citation2013), a combination of impairment, functional, computer based and group therapy. Over the treatment period the semantic feature analysis component delivered 118.3 teaching episodes and the phonological component analysis delivered 114.3 teaching episodes. This represents a high level of dosage analysis for an aphasia trial. Another attempt at measuring the dosage of active ingredients is a case series study from Harnish et al. (Citation2014) who used a targeted cueing programme for aphasia rehabilitation. Eight participants attempted to name fifty target pictures, eight times during each session for a total of 400 attempts per session. The reported cumulative intervention intensity was 3200 teaching episodes and the treatment resulted in significant gains in reacquiring problematic words (Harnish et al., Citation2014). This study has been praised for its well-constructed theory driven protocol that provides the foundation for continued and deliberate dosage investigations (Off et al., Citation2016). It is plausibly easier to conceptualize measuring dosage in single word treatments as opposed to conversational treatments and this presents a challenge for discourse rehabilitation.
Study aims
This study investigated the dose form and dose frequency (Warren et al., Citation2007) provided within the Very Early Rehabilitation in SpEech (VERSE) trial (Godecke et al., Citation2016) sessions with the following aims:
Analyse the dosage level provided within a session for:
The two intensive therapy groups (Usual Care-Plus and VERSE)
Aphasia severities (mild, moderate and severe)
Identify key ingredients in the intervention that are correlated with the primary outcome at 12 and 26 weeks post stroke.
Calculate the cumulative intervention intensity for both intensive therapy groups (Usual Care-Plus and VERSE) (Warren et al., Citation2007).
Method
Very Early Rehabilitation in SpEech (VERSE) Trial
VERSE investigated whether intensive prescribed aphasia therapy (VERSE treatment) and intensive non-prescribed usual care therapy were more effective and cost saving than non-prescribed usual care training in very early aphasia recovery after stroke (Godecke et al., Citation2013). VERSE was a RCT with the interventions offered in the trial as follows:
Usual Care: Participants randomized to this group received care that is typical for aphasia management and at the discretion of the treating SLP. It also included management of other speech pathology impairments such as dysphagia, dysarthria and/or apraxia of speech however only aphasia specific hours were included as therapy hours within the primary study analysis.
Usual Care-Plus: Participants received treatments typical of direct aphasia therapy, at the discretion of the treating SLP, but with a defined therapy regimen of daily (5 days per week) aphasia therapy sessions for 45–60 min duration over 20 sessions. Direct aphasia therapy included 1:1 impairment based therapy, impairment based computer training, social training, group impairment based therapy, group social training or Augmentative and Alternative Communication (AAC) training. As the Usual Care-Plus condition in the trial did not include a prescribed treatment type, specified active ingredients or dosage schedule, there is a unique opportunity for measurement of a “typical” aphasia session.
VERSE intervention: The intensity of this intervention arm matched that of the Usual Care Plus arm but the intervention was prescribed and standardized according to a VERSE intervention protocol. As per treatment fidelity recommendations, significant consideration was given when planning the prescribed intervention to highlight theoretical underpinnings, allowing these to be monitored and evaluated. The goal of the VERSE prescribed treatment, was to facilitate and improve verbal output with therapists using a targeted cueing hierarchy to promote successful, independent verbal production. Therapists were instructed to use cues that were most likely to be successful once participants produced an incorrect response. Participants were encouraged to repeat the target for practice in connected speech. The rationale behind the treatment postulated that correct production of the target as quickly as possible would strengthen the networks responsible for language production and that high repetition of output with reduced error production would lay the foundations for improved language and communication outcomes in early stroke recovery. In this way, cueing was thought to be a key ingredient as well as the dosage level of error free productions achieved by the participant in a session.This impairment based intervention was founded on principles of promoting neuroplasticity through targeted early intensive language therapy. The main principles that guided the VERSE prescribed intervention were (a) massed practice (b) error-free learning (c) task complexity (d) salience and (e) maximizing communicative success through interactive functional tasks.
Participants
Participants were recruited to VERSE if they had aphasia secondary to an acute intracerebral haemorrhage or ischaemic stroke, were 18 years of age or over, had corrected hearing and vision, were medically stable at or before 14 days post stroke and could participate in aphasia therapy in English without the need for an interpreter. Exclusion criteria included pre-existing aphasia prior to hospital admission, a history of progressive neurological disease, brain injury, neurosurgery or major depression, and an inability to maintain alertness for 30 consecutive minutes at 14 days post stroke. Following baseline assessment, participants were randomized using a computer-generated, block randomization sequence, stratified for aphasia severity via the REDCAP web-based programme (Harris et al., Citation2009). VERSE recruited 246 participants, 81 in usual care, 82 in Usual Care-Plus and 83 in the VERSE condition (Usual Care-Plus and VERSE conditions being the intensive conditions). Participants were recruited from sites across Australia and New Zealand and were assessed at baseline, 12 and 26 weeks post stroke on a range of impairment, psychosocial and economic based measures. The primary outcome measure and dependent variable for VERSE was the WAB-AQ (Kertesz, Citation2006) at 12 weeks post stroke. Please refer to the VERSE protocol paper (Godecke et al., Citation2016) for full study details. Recruitment was completed in February 2018 and the last patient visit was undertaken in August 2018.
Therapists
In the UC+ and VERSE conditions SLPs were contracted specifically for the trial and were qualified SLPs. All UC, UC+ and VERSE treating SLPs underwent training (five hours) and received procedural and training manuals relevant to the arm of therapy they were providing. Clinical support was provided by the trial Treatment Fidelity Coordinator (VERSE) or trial clinical staff as required.
Therapy fidelity dosage sub-study
Video recording and randomization
This study examined therapy videos collected from the VERSE and UC+ arms of the VERSE trial (Godecke et al., Citation2016). Therapists from the two intensive therapy arms VERSE and UC+ were required to record four therapy sessions over the 20 sessions completed. Therapists were encouraged to record one session a week. Of the 246 participants included in the VERSE trial (81 in UC, 82 in UC+ and 83 in the VERSE condition), 434 therapy videos were recorded (5% of the 8915 therapy sessions completed in the trial). To be included in the current study videos had to be at least forty minutes in length and not contain the present author as the therapist, the participants shown in the video had to have completed the full treatment protocol and have the 12 and 26 week dependent outcome measure score, WABR-AQ (Kertesz, Citation2006) available and the video needed to be playable on Windows Media Player. A research assistant not involved with the current project used a computer generated block randomization sample of videos stratified for aphasia severity to select therapy videos for all participants. The sample comprised 53 randomly selected videos representing 12% of the total recorded sample.
Procedure
Transcription
The selected videos were transferred and stored in a secure cloud based service. Each therapy video was then transcribed verbatim using transcription conventions as outlined in the Systematic Analysis of Language Transcripts (SALT) Transcription guidelines and software (Miller, Citation2008) (available at http://saltsoftware.com/resources/tranaids). This included segmenting utterances in Communication Units or C-Units. Each transcription was then coded according to a pre-determined set of measures that were based on the theoretical construct of the intervention and believed to represent key therapeutic ingredients.
Coding
Word and utterance level codes, related to the aims of this research, were developed. Of particular note were the number of error free utterances and utterances containing errors. The investigation of client acts in this study focused on the quantity and accuracy of speech from PWA and was grounded in a neuroscience perspective of experience dependent plasticity, learned non-use and Hebbian theory (Hebb, Citation1949; Pulvermuller & Berthier, Citation2008; Varley, Citation2011). Aphasia treatment approaches are often described as “error full” or “error free” referring to whether the PWA is encouraged to attempt target attainment irrespective of the error quantity or whether errors are minimized to avoid strengthening of associated negative neural networks. For this reason the production and management of errors and participant self-correction of errors was an area of focus within the coding with frequency of errors and self-corrections viewed as potential active ingredients.
An error free response was defined as one which was “appropriate and accurate for the context and not corrected or modified by the therapist”. Frequently, the stimulus materials were visible in the therapy video and the transcriber was able to evaluate the response. In the event that the response could not be assessed as correct by the video reviewer, it was defined as a response that did not receive correction or negative feedback from the therapist. Error free responses were coded at the C-unit/ utterance level. Errors were defined as “inaccurate productions at the word or sentence level that required modification, correction or negative feedback from the therapist”. Error responses were marked at the word level and utterance level and utterances could contain multiple errors. If an error was corrected by the PWA, without intervention from the therapist, it was coded as a self-correction with the initial mistake coded as an error. Boundaries of therapy tasks were not always clear and social conversation was often a target of therapy. Therefore every utterance from the participant within the therapy session, from the beginning to the end of the session, was coded and used as a measure of dosage. outlines the codes used in transcription.
Table 1. Dosage related measures and possible active ingredients.
Transcription analysis
Dose form
The dosage delivered within a session is highly dependent on the type of therapy task, or dose form (Warren et al., Citation2007) being used. A task was judged by the primary author while watching the videos and was defined as the medium through which therapy was taking place and reflective of a specific therapy goal. For example, picture naming at the single word level would reflect a task. The same stimuli used in a sequence to generate sentences would reflect a new task. Tasks usually contained stimuli and task explanations although not always. Most sessions contained multiple tasks and many tasks were seen multiple times in the therapy videos. The total number of different tasks provides a value for the number of times therapists used a task that was unique i.e., had not been used by any other therapists in the videos.
Session duration
Dosage is also dependent on the duration, or length of a session. To calculate the dosage rate of active ingredients (Dose/session duration (mins)) the session duration is needed (Warren et al., Citation2007). Session duration was controlled for in the VERSE study as sessions had to be greater than forty minutes in length and twenty sessions were given in total. The session duration for the specific 53 videos used in this study is reported. Please note that session duration and dosage rate are reported however they are not used in the formula for the CII (dose × dose frequency × total intervention duration).
Dose
Following transcription and coding, calculations were performed by the SALT software for both the participant and therapist utterances. These were total number of verbal utterances, mean length of utterance (MLU) in words and morphemes, total words, words per minute (WPM), utterances per minute (UPM) and mean turn length in words. In addition, calculations based on the codes error codes outlined previously were made manually and these formulas can be seen in . Counts of the codes and the calculations were entered into the statistical software programme SPSS (IBM Corp, Citation2015) together with demographic data and the WABR-AQ scores at 12 and 26 week post stroke scores (dependent measures).
Table 2. Formulas used for calculating measures.
Statistical analysis
Descriptive statistics are presented for participant, session number and duration, recovery and dose form data. A Welch’s t-test for unequal variances with p > 0.001 (as per Bonferroni correction) was performed to establish significant differences in dose. Within VERSE and Usual Care-Plus arms of the VERSE trial sessions were expected to be at least 45 min long. However as session time was not controlled for exactly, session length usually ranged from 45 to 60 min, longer therapy sessions would naturally be higher in many measures. These measures (as per and ) were adjusted by dividing the total by the session time. The resulting standardized data was used in the statistical analyses. Descriptive statistics are presented according to therapeutic group and aphasia severity is in unadjusted raw format to maintain context. An ANOVA was used for the between group analyses, to examine differences between therapy group (UC+ and VERSE) and aphasia severity (mild, moderate, severe). Significance set at p < 0.05 for post hoc analyses.
A linear regression was used to explore the relationship between potential therapy active ingredients, considering and client acts and therapeutic inputs. A linear regression model was used across both therapy groups (VERSE and Usual Care-Plus) with the participant’s primary outcome measure, their WABR-AQ score at 12 and 26 weeks being the dependent measure. The WABR-AQ score at 26 weeks was used as we wanted measures to show longer term association with the dependent variable to be suggestive of maintenance. A Bonferroni correction was used for multiple comparisons according to the number of variables in the analysis and significance was set at p < 0.00277. Baseline aphasia severity as per the WABR-AQ and the overall amount of direct aphasia therapy was included as predictors in the model to account for these factors. To be identified as predictive of WABR-AQ score at 26 weeks, measures had to be significant at 26 weeks post stroke, demonstrating longer term association. The identified ingredients were used to calculate the cumulative intervention intensity [dose (client acts and therapist inputs) × dose frequency × total intervention duration] (Warren et al., Citation2007).
Reliability
Six videos (one from each of the three aphasia severity groupings in UC+ and VERSE) were re-coded for inter and intra-rater reliability by another SLP trained in the coding methods for this study. This comprised 11% of the total sample in this study. Reliability was established using the intra-class correlation coefficient (ICC) in SPSS (IBM Corp, Citation2015) with a consistency 2-way mixed effects model. The ICC was established on the four key coded measures of interest in the study – error free utterances, total errors made, total self-corrections and the total number of cues used with success by the therapist. Koo and Li’s (Citation2016) guidelines for reporting the ICC have been adhered to in the tables below. As per , three of the measures had ICCs in excess of 0.90 and therefore, inter-rater reliability is reported as excellent. The self-corrections measure was lower with ICCs in the range of 0.75–0.90 which remain in the good reliability range (Koo & Li, Citation2016). As the ICCs were all in excess of 0.90 as per , intra-reliability is reported excellent.
Table 3. Inter-rater reliability results using ICC calculation.
Table 4. Intra-rater reliability results using ICC calculation.
Results
Participants
The 53 videos presented therapy sessions of 44 different participants. This comprised 27% of the total number of participants included in the intensive arms of the trial (UC+ and VERSE, 165 participants). Of the 53 videos selected through randomization seven participants had two videos in the sample (total 14 videos), one participant had three videos in the sample (total 3 videos) and the remaining 36 participants had one video each (total 36 videos). This resulted in the inclusion of 44 different participants. presents the demographic details of these participants. Twenty-five different SLPs were included within the analysed videos.
Table 5. Participant demographic and stroke characteristics.
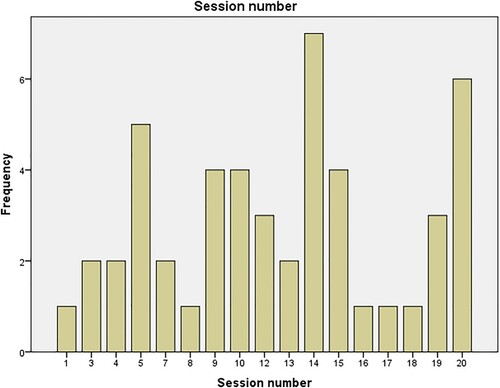
Session number
displays the most frequently analysed session numbers within this sample. Session number fourteen, twenty and five were the most frequently viewed.
Figure 2. Frequency data of session number included in the sample.
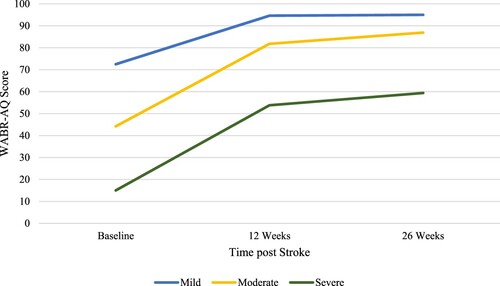
Recovery
provides an overall context to the recovery of the participants included in this study. Based on their severity diagnosis at baseline and reassessment at 12 and 26 weeks on the WABR-AQ, participants at each severity level on average made an improvement in their scores.
Figure 3. Recovery trend on the WABR-AQ based on baseline severity.
Dose form
provides a summary of the number of therapy tasks completed within the sessions shown in the videos according to each therapeutic group within the trial. A list of all tasks completed in each condition is provided in CitationAppendix A (Usual Care-Plus) and (VERSE).
Table 6. Tasks completed in therapy videos.
Session duration
provides a summary of session time to provide a context for the measures reported in the results section.
Table 7. Session duration in minutes.
Dose – all measured ingredients
Session dosage by therapy group
The dose of all client acts is presented in as per the different therapy arms in the trial and the group as a whole. The dose of all therapist inputs is presented in . The groups were not found to be significantly different on any of the measures, using Welch’s t-test for unequal variances with p > 0.001 (as per Bonferroni correction) indicating an equivalent dosage across the different types of intensive treatment.
Table 8. Dosage (Client Acts) Descriptive Statistics.
Table 9. Dosage (Therapist Inputs) Descriptive Statistics.
Session dosage by aphasia severity
Dosage (client acts and therapist inputs) are outlined in and respectively according to aphasia severity at baseline. Significant differences were found between the mild and moderate aphasia severity groups on the measures of percentage of errors self-corrected and mean length of utterance (words and morphemes). Significant differences between the mild and severe severity group were seen in measures of spontaneous verbal utterances, non-verbal responses, self-corrections, percentage of errors self-corrected, mean length of utterance (words and morphemes), total words, percentage of total words with errors, words per minute, mean turn length (words), cues used with success, total number of cues used and total therapist utterances. Significant differences between the moderate and severe severity groups were seen in measures of spontaneous verbal utterances, non-verbal responses, percentage of errors self-corrected, mean length of utterance (words and morphemes), total verbal utterances, total words, percentage of total words with errors, utterances per minute, words per minute, mean turn length (words). The direction of the significance can be seen in the means provided. All other variables did not meet significance in post hoc testing p > 0.05. For full statistical sentences of each of the post hoc analyses please see .
Table 10. Dosage (client acts) descriptive statistics, (mean (SD)) and group comparisons by aphasia severity.
Table 11. Dosage (therapist inputs) descriptive statistics (mean (SD)) comparisons by aphasia severity.
Dose – active ingredients
shows the linear regression of within session dosage measures and the WABR-AQ score at 12 weeks post stroke. A Bonferroni correction was set for multiple comparisons (0.05 / 18 measures) at p < 0.00277 and no measures met these criteria for 12 weeks post stroke. Measures that were significantly predictive with the WABR-AQ score at 26 weeks post stroke, as per were: total verbal utterances, percentage of total words with errors and the number of cues used with success. These were hypothesized as key therapeutic ingredients in the treatment and used in the cumulative intervention intensity calculation.
Table 12. Linear regression of dose (client acts and therapist inputs) with patient outcome at 12 weeks post stroke.
Table 13. Linear regression of dose (client acts and therapist inputs) with patient outcome at 26 weeks post stroke.
Cumulative intervention intensity
The dosage measures that were predictive of WABR-AQ score at 26 weeks post stroke were considered to be key therapeutic ingredients for this treatment and population. Measures that were predictive of patient response at 26 weeks post stroke were total verbal utterances, percentage of total words with errors and cues used with success. Specifically the greater the number of total verbal utterances that were produced per session (irrespective of errors), the better the WABR-AQ score was at 26 weeks. The percentage of total words with errors in the session was negatively associated with WABR-AQ score meaning that the lower the percentage of words with errors in the session, the higher the WABR-AQ score. Cues used with success was positively associated, with WABR-AQ at 26 weeks post stroke. The percentage of total words with errors measure was a percentage calculation [(errors) / (total words) × 100] and so the mean value is not representative of the number of times the ingredient occurred during the session rather a percentage of two other measures. As such it was problematic to use in the intensity calculation and not selected. Therefore, total verbal utterances and cues used with success were selected as the key therapeutic ingredients in these treatments to use in the calculation of cumulative intervention intensity.
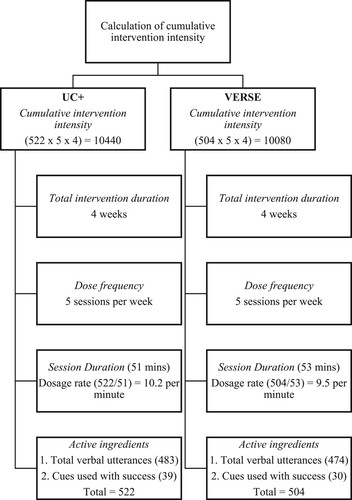
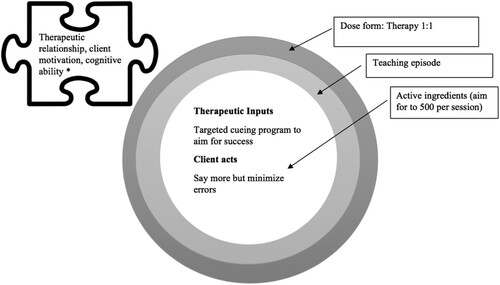
presents the cumulative intervention intensity for both therapy groups as per the sample used in this analysis. This figure is adapted from Baker (Citation2012) which was based on Warren et al. (Citation2007) dosage concepts. When considering the number of verbal utterances produced and the number of cues used with success per session, people in the Usual Care-Plus group averaged 522 active ingredient episodes each session with five sessions/ week taking place over four weeks. This resulted in an average cumulative intervention intensity of 10,400 during the trial. For individuals in the VERSE arm of the trial an average of 504 active ingredient episodes occurred each session over five sessions/ week for four weeks to give a cumulative intervention intensity of 10,080 during the trial.
Figure 4. Calculation of cumulative intervention intensity as per Warren et al. (Citation2007) concepts.
Numbers presented in parentheses are the mean values from the sample.
Discussion
This study aimed to provide insight into the dosage level provided within the intensive intervention arms of the VERSE trial (Godecke et al., Citation2016). Specifically, we have provided (i) normative dosage data across the intervention groups and aphasia severities; (ii) an exploration of potential key therapeutic ingredients to explain recovery in this population; and (iii) a specification of the intervention according to the dosage and intensity theory of Warren et al. (Citation2007). Our goal was not to provide a therapy regimen for therapists to follow. Rather, we aimed to develop an increased understanding of the key ingredients of the therapy provided in the VERSE trial and the dosage with which theorized ingredients were provided. In doing so we have trialled a method of identifying potential active ingredients and measuring dosage for this population. We hope to stimulate further discussion and encourage the research agenda in the area in order to improve the methodology used within intervention studies when considering the way in which therapies are delivered. In the long term this will assist in uncovering the elements of treatment that are most likely to improve functional outcomes and the dosage with which these elements, or ingredients, are delivered.
The therapy black box
On average, the participants within this study, who were from three aphasia severity groups, made a clinically significant improvement in their recovery from aphasia as measured by the WABR-AQ (Kertesz, Citation2006). Turkstra et al. (Citation2016) proposed that any treatment be specified using three elements of treatment theory: (i) targets, (ii) ingredients and (iii) mechanisms of action. These elements of treatment theory are likely to make up the as yet unknown “black box” of aphasia interventions (DeJong et al., Citation2005; Walker et al., Citation2017). The main contribution of these results is to the ingredients element of treatment theory (Turkstra et al., Citation2016). Whilst no single piece of research can establish what, how and how much to do in therapy, we trialled a method of identifying key ingredients for therapy provided within the VERSE trial and measured the dosage with which significant ingredients occurred. Within this study three measures were identified that were associated with language outcome at 26 weeks post stroke. These were increased verbal utterances (client act), reduced percentage of words produced which contained errors (client act) and increased cues used with success (likely represents both a client act and therapeutic input). Interestingly these measures represented both therapeutic inputs and client acts (Kleim & Jones, Citation2008) in Baker’s (Citation2012) model and may be the evidence based kernels or the active ingredients of the treatment within this intervention trial (Embry & Biglan, Citation2008). While the model shown in is focused on the teaching episodes within tasks it is acknowledged that there are many other components of the rehabilitation jigsaw that contribute to therapeutic success, in conjunction with the teaching episode, and a few are listed here.
Figure 5. Adapted from Baker (Citation2012), the relationship between dose form, teaching episodes and active ingredients.
The results presented here support an error minimization (not error-free) approach possible through a targeted cueing programme that aims to create successful verbal production. This is balanced with encouraging the person with aphasia to say as much as possible and to provide clinical support to facilitate production which contains as few errors as possible. It should be highlighted that intervention provided in the VERSE trial was provided during early aphasia recovery and so it is unknown if these findings would be similar for people in the chronic phase of recovery. Within this study a novel approach was used to determine key therapeutic ingredients of the treatment in an attempt to explore how therapeutic ingredients may be identified. A regression model was used with the WABR-AQ as the dependent variable and while this approach found predictions with three dosage measures, caution is needed with interpretation. Measures that were predictive (specifically verbal utterances and reduced percentage of words with errors) may logically be related to the WABR-AQ score. That is, a person with aphasia who produces more utterances and less errors will have a better score on the WABR which is by design a predominantly verbal accuracy test. However, of note, is that the measures were taken within the first month post stroke, and were predictive at six months and baseline aphasia severity and amount of intervention received was included in the model. This has provided an attempt at identifying how the handling of errors, or other potential key ingredients such as cueing, affected target attainment more generally (Turkstra et al., Citation2016). This predictive relationship was observed from a snapshot of therapy sessions that involved sixty nine different therapy tasks in early aphasia recovery.
This figure is adapted from Baker (Citation2012) and explores the relationship between key components of dosage and speech language pathology interventions. The puzzle piece represents other elements of rehabilitation that may contribute to therapeutic success.
Literature outlining complex treatments often lack information regarding specific active ingredients and their corresponding dosage. This is largely due to difficulty investigating these complex behavioural interventions and the impact of a myriad of factors including therapeutic relationship, environment and client motivation (Cherney, Citation2012). We used a formula presented by Warren et al. (Citation2007) to calculate the dosage and cumulative intervention intensity for a sample of therapy delivered in the VERSE trial. Identifying the key therapeutic ingredients was challenging especially as tasks were not controlled and retrospective data were used. Potential ingredients were identified in the design phase that linked to the theory underpinning the interventions. That is, the measurement and handling of errors was thought to be key to neurorehabilitative learning and aphasia therapy and so prioritized. Then in an exploratory manner these key ingredients were counted and coded in the analysis phase however we acknowledge that the active ingredients measured here do not represent all possible key ingredients. The level of analysis undertaken in this study was time consuming however it provides a framework for this line of inquiry to develop further. We suggest focusing on the theory behind the intervention to measure targeted ingredients only in a prospective manner. That is, measure a small number of ingredients thoroughly with the aim to draw conclusions about their role in therapy, whilst embedding a larger rigorous fidelity monitoring process to establish treatment adherence and differentiation. The detailed analysis of active ingredients should be included in all smaller pilot studies with an aim to discover which ingredients are positively associated with outcome. These intervention kernels should then be tested on a larger sample in feasibility and Phase-III studies.
Critical variables for aphasia therapy are thought to include the intensity and dosage, therapeutic relationship, medium of therapy delivery, client motivation to engage, cognitive ability and neurological stability (Whitworth et al., Citation2014) and the active ingredients that promote an individual’s recovery may lie within these variables. There is also the possibility that the active ingredients of therapy are not directly observable or so readily measurable. The concept of activity challenge and the level of task difficulty is a parameter in stroke rehabilitation that is receiving increasing attention and will influence the outcome of future study designs (Akizuki & Ohashi, Citation2015; Woodbury et al., Citation2016). Therefore, not only should the quantity of therapeutic inputs and client acts be addressed but also the quality of these, such as a measure of task difficulty relative to the individual, with an optimal challenge point identified (Guadagnoli & Lee, Citation2004). An alternative but related view of therapy could be gained through qualitative analysis and/or systemic function linguistic analysis (O'Halloran, Citation2004) of therapy videos. This could investigate more thoroughly aspects of the therapeutic relationship such as rapport and patient comfort levels. It is acknowledged that an in-depth analysis was not completed to explore the nature of interactions between the therapists and people with aphasia. This was not the aim of the work, however such an undertaking is likely to capture a richness of therapy not represented in the quantitative data set.
Dosage
The optimal treatment dosage in aphasia rehabilitation is unknown with significantly more research required (Baker, Citation2012; Dignam et al., Citation2015; Off et al., Citation2016). For this study the cumulative intervention intensity is over 10,000 occurrences of the ingredients predictive of recovery within an intervention block of twenty sessions. This means that, on average, approximately 500 of these key ingredients were delivered and received each session. The VERSE trial’s primary hypothesis investigated an intensive therapy schedule which demonstrated equivalent outcomes between intensive therapy and standard care in early stroke recovery (Godecke et al., Citation2018). It should be highlighted that only data from the intensive intervention arms of the trial were included in this study, videos from therapy provided within non intensive usual care were not included and so we don’t know the findings from therapy that may be delivered at a lower dose. It may be that the within session dosage level that was delivered is necessary but not on an intensive schedule. In the overall trial cohort sessions of longer duration were associated with better recovery than a larger number of shorter sessions (Rai et al., Citation2019). Sessions of longer duration may result in an increased dosage of the key client acts and therapist inputs. Based on VERSE efficacy data, positive therapeutic results may be achieved with less frequent sessions but this level of within session dosage. Alternatively, it may be that the dosage level provided in the VERSE trial is not necessary and participants were “overdosed”. A further alternative is that the dosage provided to the participants in the VERSE trial, and in this study, was insufficient to show benefit in communication and language. Harnish et al. (Citation2014) measured the dosage of active ingredients in a cueing treatment for people with chronic aphasia and found positive outcomes with 400 attempts per session for a total of 3200 teaching episodes. Therefore, future studies may aim to determine a threshold at which these potential active ingredients are associated with a positive outcome within a session in order to inform research consumers about what was delivered in the trial and assist research translation.
This study outlines the findings of a detailed analysis of the intervention dosage provided within the VERSE study however, while the length of the sessions was set, a minimum target for repetitions was not set in either the prescribed or Usual Care-Plus conditions. We have provided an analysis of a “typical” 45–60 min aphasia therapy session using usual care data, possibly providing a benchmark to be used as normative data in the future. Usual Care-Plus therapists were not given a prescribed therapy. Therefore, we believe that the results presented here are representative of therapy provision within Australia and the dosage level seen within a sessions of this length. This, combined with the information from the main trial (usual care was two to three times per week for 30–36 min or 9.5 h of direct aphasia therapy within the first 50 days post stroke), provides an unprecedented level of information on usual care aphasia therapy within Australia and New Zealand. It is interesting to note that there was not treatment differentiation for dosage between the prescribed intervention (VERSE) and Usual Care-Plus on the analyses completed as part of the current study. And so, even when a treatment was prescribed to the therapists, the measures examined in this study did not differ significantly. This may be because Usual Care-Plus therapists were using the same principles as the prescribed therapy, or that there is a homogeneity in the way that PWA respond to tasks.
There were statistically significant differences in the measured dosage variables across aphasia severities as expected. This demonstrated that classification of severity at baseline remained relevant to the performance of PWA during therapy sessions within the subsequent month. Of note, people with severe aphasia had significantly less spontaneous verbal utterances, percentage of errors self-corrected and words spoken compared to people with mild and moderate aphasia. They were consistently lower on verbal efficiency measures such as utterances per minute, words per minute and mean length of utterance. As this fits the common picture of aphasia severity it may also be expected that they would make more mistakes in a session. People with moderate aphasia produced the most errors (total errors) but also more utterances without errors and more total verbal utterances than people with severe aphasia. This may reflect a trade-off of attempting to say more but making more errors in the process. As a proportion of the total words produced people with severe aphasia made errors over 50% of the time. This was consistent even in the prescribed VERSE condition that aimed for an error free approach. Even when aiming for an errorless or error minimization learning approach with someone with severe aphasia, therapists may not be able to restrict errors to less than 50% of words produced. It is possible that regardless of the therapists’ attempts to limit errors, there is a predictability and a homogeneity to the way PWA respond in a task. People with mild aphasia produced more self-corrections and were able to produce more words across less utterances reflected in a higher MLU. As expected, many of the participants with mild aphasia at baseline approached ceiling level on the WAB-AQ by 12 and 26 weeks post stroke.
These findings encourage researchers to undertake fine-grained dosage (number of therapeutic inputs and client acts) analyses of their research in both intervention and control groups. The analyses completed here demonstrate that this is feasible within a portion of the RCT cohort. By nature, retrospective analysis of a cohort such as completed here is unable to systematically identify and vary dosage variables. Prospective hypothesis driven studies that manipulate ingredients and dose may facilitate a clearer interpretation. The ingredients identified in this study would benefit from planned experimental investigations to test the robustness of the interpretations. Dose escalation study designs are being adapted for rehabilitation research and present one possible future direction for aphasia (Kramer et al., Citation2018). Additionally, future research would benefit from focusing on conceptualizing dosage in terms of number of key ingredients (therapeutic inputs and client acts), rather than time spent in therapy, to progress the evidence base. Research needs to document dosage in this way for treatments given in trials, however specific research in which dosage is varied within a treatment is also needed (Kramer et al., Citation2018). It would be of value for RCT pilot studies to conceptualize potential active ingredients in the trial design phase, measure these against outcomes, fine tune the procedure and then scale up to the larger trial.
Clinical significance
Investigating dosage in aphasia research is important in the clinical realm. An inaccurate dose may be a waste of precious resources, harmful, ineffective or equivalent to no intervention (Baker, Citation2012). Treatments are implemented in practice that combine several different forms and doses of intervention and typically this combination is untested and the implementation may be in direct contrast to how they were evaluated (O’Hare & Doell, Citation2015; Waller, Citation2009). These are called “third wave therapies” and they may not provide the required dosage of therapy to be effective (Waller, Citation2009). In addition, the dosage level decided on by a therapist may be influenced by all areas of the evidence based practice triad, including patient values and clinical expertise (Sackett et al., Citation1996). If researchers can provide clinicians with the evidence of a threshold dose for a treatment then therapists can more accurately manipulate treatments according to clinical results and patient related factors. If a specific dose can be determined then services can be utilized at their optimum level and resources can be reallocated where necessary.
Limitations
This study aimed to explore dosage, as provided in the VERSE study, and trialled a method for analysing the therapy provided. It was a novel approach and although the findings give an important insight into therapeutic dosage, the method for identifying key ingredients should be interpreted with caution. A reductive interpretation of the methodology used in this study would be that measures that were predictive of outcome may logically be related to the WABR-AQ score. That is, a person with aphasia who produces more utterances and less errors in therapy will have a better score on the WABR-AQ which is by design a predominantly verbal accuracy test. The study was retrospective and therefore dosage variables at the ingredients level were not able to be controlled or manipulated. This study design adds complexity to the relationship interpretation. The values used in the cumulative intervention intensity model are averages attained in the analysis. The drawbacks of using average scores as a measure is acknowledged. The WAB-R is predominantly a verbal accuracy test. Other modalities for the outcome measure such as written expression or receptive language were not considered in the scope of this work. This study analysed 12% of the available videos in the VERSE trial. This represents a small sample and so there is a limit to the extrapolation of these results to represent the dosage within the trial as a whole. Additionally this means the current study may have been underpowered. The primary rater for the videos was not blinded to the treatment condition as unblinding was necessary for monitoring protocol adherence and treatments were also easily distinguishable based on task selection and the potential for bias exists.
Conclusion
This study demonstrated it is feasible to analyse the dosage of therapy in aphasia rehabilitation. Overall, these results suggest that an error minimization but verbal maximization strategy using a targeted cueing programme is beneficial for people with aphasia in the early stroke recovery period. There is, of course, great difficulty in determining what our therapy consists of and the way in which this acts on the brain to facilitate recovery. Regardless of the intensity regimen, we have demonstrated that this cumulative intervention intensity and within session level dosage contributes to positive outcomes for people with aphasia in early stroke recovery.
Acknowledgements
Figure 1 was reproduced with permission from Taylor and Francis and the author with thanks. The authors acknowledge the VERSE Collaboration author group, trial participants and therapists for their contribution and in particular thanks to Tapan Rai for his statistical input.
Disclosure statement
No potential conflict of interest was reported by the author(s).
References
- Akizuki, K. , & Ohashi, Y. (2015). Measurement of functional task difficulty during motor learning: What level of difficulty corresponds to the optimal challenge point? Human Movement Science , 43 , 107–117. https://doi.org/10.1016/j.humov.2015.07.007
- Baker, E. (2012). Optimal intervention intensity. International Journal of Speech-Language Pathology , 14 (5), 401–409. https://doi.org/10.3109/17549507.2012.700323
- Bakheit, M. , Shaw, S. , Barrett, L. , Wood, J. , Carrington, S. , Griffiths, S. , K. Searle , & Koutsi, F. (2007). A prospective, randomized, parallel group, controlled study of the effect of intensity of speech and language therapy on early recovery from poststroke aphasia. Clinical Rehabilitation , 21 (10), 885–894. https://doi.org/10.1177/0269215507078486
- Behn, N. , Marshall, J. , Togher, L. , & Cruice, M. (2019). Reporting on novel complex intervention development for adults with social communication impairments after acquired brain injury. Disability and Rehabilitation , 1–10. https://doi.org/10.1080/09638288.2019.1642964
- Biernaskie, J. , & Corbett, D. (2001). Enriched rehabilitative training promotes improved forelimb motor function and enhanced dendritic growth after focal ischemic injury. The Journal of Neuroscience , 21 (14), 5272–5280. https://doi.org/10.1523/JNEUROSCI.21-14-05272.2001
- Brady, M. C. , Kelly, H. , Godwin, J. , Enderby, P. , & Campbell, P. (2016). Speech and language therapy for aphasia following stroke. Cochrane Database of Systematic Reviews , 6 ), https://doi.org/10.1002/14651858.CD000425.pub4
- Cherney, L. (2012). Aphasia treatment: Intensity, dose parameters, and script training. International Journal of Speech-Language Pathology , 14 (5), 424–431. https://doi.org/10.3109/17549507.2012.686629
- Crosson, B. , Rodriguez, A. D. , Copland, D. , Fridriksson, J. , Krishnamurthy, L. C. , Meinzer, M. , Raymer, A. M. , Krishnamurthy, V. , & Leff, A. P. (2019). Neuroplasticity and aphasia treatments: New approaches for an old problem. Journal of Neurology, Neurosurgery and Psychiatry , 90 , 1147–1155. https://doi.org/10.1136/jnnp-2018-319649
- DeJong, G. , Horn, S. D. , Conroy, B. , Nichols, D. , & Healton, E. B. (2005). Opening the black box of poststroke rehabilitation: Stroke rehabilitation patients, pocesses, and otcomes. Archives of Physical Medicine and Rehabilitation , 86 (12, Supplement), 1–7. https://doi.org/10.1016/j.apmr.2005.09.003
- Dignam, J. , Copland, D. , McKinnon, E. , Burfein, P. , O’Brien, K. , Farrell, A. , & Rodriguez, A. D. (2015). Intensive versus distributed aphasia therapy: A nonrandomized, parallel-group, dosage-controlled study. Stroke , 46 (8), 2206–2211. https://doi.org/10.1161/STROKEAHA.115.009522
- Dijkers, M. P. , Hart, T. , Tsaousides, T. , Whyte, J. , & Zanca, J. M. (2014). Treatment taxonomy for rehabilitation: Past, present, and prospects. Archives of Physical Medicine and Rehabilitation , 95 (1, Supplement), S6–S16. https://doi.org/10.1016/j.apmr.2013.03.032
- Embry, D. D. , & Biglan, A. (2008). Evidence-based kernels: Fundamental units of behavioral influence. Clinical Child and Family Psychology Review , 11 (3), 75–113. https://doi.org/10.1007/s10567-008-0036-x
- Enderby, P. (2012). How much therapy is enough? The impossible question! International Journal of Speech-Language Pathology , 14 (5), 432–437. https://doi.org/10.3109/17549507.2012.686118
- Godecke, E. , Armstrong, E. A. , Rai, T. , Middleton, S. , Ciccone, N. , Whitworth, A. , Rose, M. , Holland, A. , Ellery, F. , Hankey, G. J , Cadilhac, D. A , & Bernhardt, J. (2016). A randomized controlled trial of very early rehabilitation in speech after stroke. International Journal of Stroke , 11 (5), 586–592. https://doi.org/10.1177/1747493016641116
- Godecke, E. , Armstrong, E. , Bernhardt, J. , Middleton, S. , Rai, T. , Holland, A. , Cadhilac, D.A. , Whitworth, A. , Rose, M. , Ciccone, N. , and Hankey, G.J. (2013). Very early rehabilitation in SpEech (VERSE): The development of an Australian randomised controlled trial of aphasia therapy after stroke. International Journal of Stroke , 8 (Suppl 1), 44–45. https://doi.org/10.1111/ijs.12143
- Godecke, E. , Armstrong, E. , Rai, T. , Middleton, S. , Ciccone, N. , Rose, M. , Holland, A. , Whitworth, A. , Ellery, F. , Hankey, G.J. , Cadhilac, D.A. and Bernhardt, J. (2018). World stroke Congress Abstracts, 2018. International Journal of Stroke , 13 (2_suppl), 3–217. https://doi.org/10.1177/1747493018789543
- Gottesman, I. (1963). Genetic aspects of intelligent behavior. In N. R. Ellis (Ed.), Handbook of mental deficiency (pp. 253–296). McGraw-Hill.
- Guadagnoli, M. A. , & Lee, T. D. (2004). Challenge point: A framework for conceptualizing the effects of various practice conditions in motor learning. Journal of Motor Behaviour , 36 (2), 212–224. https://doi.org/10.3200/JMBR.36.2.212-224
- Harnish, S. M. , Morgan, J. , Lundine, J. P. , Bauer, A. , Singletary, F. , Benjamin, M. L. , & Gonzalez Rothi, L. J. , & Crosson, B. (2014). Dosing of a cued picture-naming treatment for anomia. American Journal of Speech-Language Pathology , 23 (2), S285–S299. https://doi.org/10.1044/2014_AJSLP-13-0081
- Harris, P. A. , Taylor, R. , Thielke, R. , Payne, J. , Gonzalez, N. , & Conde, J. G. (2009). Research electronic data capture (REDCap)—A metadata-driven methodology and workflow process for providing translational research informatics support. Journal of Biomedical Informatics , 42 (2), 377–381. https://doi.org/10.1016/j.jbi.2008.08.010
- Hebb, D. O. (1949). The organisation of behaviour. A neuropsychological theory . Wiley.
- Hoffman, L. (2009). Narrative language intervention intensity and dosage: Telling the whole story. Topics in Language Disorders , 29 (4), 329–343. https://doi.org/10.1097/TLD.0b013e3181c29d5f
- IBM Corp . (2015). IBM SPSS statistics for Windows (Version 23.0) .
- Kamhi, A. G. (2012). Pharmacological dosage concepts: How useful are they for educators and speech-language pathologists? International Journal of Speech-Language Pathology , 14 (5), 414–418. https://doi.org/10.3109/17549507.2012.685889
- Kertesz, A. (2006). Western aphasia Battery – Revised . Pro-Ed.
- Kleim, J. A. , & Jones, T. A. (2008). Principles of experience-dependent neural plasticity: Implications for rehabilitation after brain damage. Journal of Speech, Language & Hearing Research , 51 (1), S225–S239. https://doi.org/10.1044/1092-4388(2008/018)
- Koo, T. K. , & Li, M. Y. (2016). A Guideline of selecting and reporting intraclass correlation coefficients for reliability research. Journal of Chiropractic Medicine , 15 (2), 155–163. https://doi.org/10.1016/j.jcm.2016.02.012
- Kramer, S. , Kaffenberger, T. , Cumming, T. , Bernhardt, J. , & Johnson, L. (2018). Development and dose parameters of exercise intervention in early stroke: A systematic review [Paper presentation]. The combined Stroke Society of Australiasia (SSA) 28th Annual Scientific Meeting and the 14th Smart Strokes Australasian Nursing and Allied Health Stroke Conference, Sydney, Australia.
- Lang, C. E. , Lohse, K. R. , & Birkenmeier, R. L. (2015). Dose and timing in neurorehabilitation: Prescribing motor therapy after stroke. Current Opinion in Neurology , 28 (6), 549–555. https://doi.org/10.1097/WCO.0000000000000256
- Lohse, K. R. , Lang, C. E. , & Boyd, L. A. (2014). Is more better? Using metadata to explore dose-response relationships in stroke rehabilitation. Stroke , 45 (7), 2053–2058. https://doi.org/10.1161/STROKEAHA.114.004695
- Ludemann, A. , Power, E. , & Hoffmann, T. C. (2017). Investigating the adequacy of intervention descriptions in recent speech-language pathology literature: Is evidence from randomized trials useable? American Journal of Speech-Language Pathology , 26 (2), 443–455. https://doi.org/10.1044/2016_AJSLP-16-0035
- Miller, J. (2008). Systematic analysis of language transcripts (SALT), English Demo Version 2008 [Computer Software]. In. LLC: SALT Software.
- Murphy, T. H. , & Corbett, D. (2009). Plasticity during stroke recovery: From synapse to behavior. Nature Reviews Neuroscience , 10 (12), 861–872. https://doi.org/10.1038/nrn2735
- Nudo, R. J. (2013). Recovery after brain injury: Mechanisms and principles. Frontiers in Human Neuroscience , 7 , 887–887. https://doi.org/10.3389/fnhum.2013.00887
- O’Halloran, K. (2004). Multimodal discourse analysis: Systemic functional perspectives . A&C Black.
- O’Hare, M. , & Doell, E. (2015). What supports speech-language pathologists to implement treatments with fidelity? Journal of Clinical Practice in Speech-Language Pathology , 17 (3), 140–143. https://cld.bz/bookdata/z08NlTu/basic-html/page-33.html
- Off, C. A. , Griffin, J. R. , Spencer, K. A. , & Rogers, M. (2016). The impact of dose on naming accuracy with persons with aphasia. Aphasiology , 30 (9), 983–1011. https://doi.org/10.1080/02687038.2015.1100705
- Pulvermuller, F. , & Berthier, M. L. (2008). Aphasia therapy on a neuroscience basis. Aphasiology , 22 (6), 563–599. https://doi.org/10.1080/02687030701612213
- Pulvermuller, F. , Neininger, B. , Elbert, T. , Mohr, B. , Rockstroh, B. , Koebbel, P. , & Taub, E. (2001). Constraint-induced therapy of chronic aphasia after stroke. Stroke , 32 (7), 1621–1626. https://doi.org/10.1161/01.STR.32.7.1621
- Rai, T. , Godecke, E. , Armstrong, E. , Cadhilac, D.A. , Ciccone, N. , Rose, M. , Holland, A. , Whitworth, A. , Ellery, F. , Hankey, G.J. , Middleton, S. , Bernhardt, J. , and VERSE Collaborators. (2019). General interest sessions. European Stroke Journal , 4 (1_suppl), 3–95. https://doi.org/10.1177/2396987319845560
- Raymer, A. M. , Beeson, P. , Holland, A. , Kendall, D. , Maher, L. M. , Martin, N. , Murray, L. , Rose, M. , Thompson, C. K. , Turkstra, L. , Altmann, L. , Boyle, M. , Conway, T. , Hula, W. , Kearns, K. , Rapp, B. , Simmons-Mackie, N. , & Gonzalez Rothi, L. J. (2008). Translational research in aphasia: From neuroscience to neurorehabilitation. Journal of Speech, Language, and Hearing Research , 51 (1), S259–S275. https://doi.org/10.1044/1092-4388(2008/020)
- Robbins, J. , Butler, S. G. , Daniels, S. K. , Gross, R. D. , Langmore, S. , Lazarus, C. L. , Martin-Harris, B. , McCabe, D. , Musson, N. , & Rosenbeck, J. (2008). Swallowing and dysphagia rehabilitation: Translating principles of neural plasticity into clinically Oriented evidence. Journal of Speech Language Hearing Research , 51 (1), S276–S300. https://doi.org/10.1044/1092-4388(2008/021)
- Robey, R. (1998). A meta-analysis of clinical outcomes in the treatment of aphasia. Journal of Speech, Language & Hearing Research , 41 (1), 172–187. https://doi.org/10.1044/jslhr.4101.172
- Rodriguez, A. D. , Worrall, L. , Brown, K. , Grohn, B. , McKinnon, E. , Pearson, C. , Van Hees, S. , Roxbury, T. , Cornwell, P. , MacDonald, A. , Angwin, A. , Cardell, E. , Davidson, B. , & Copland, D. A. (2013). Aphasia LIFT: Exploratory investigation of an intensive comprehensive aphasia programme. Aphasiology , 27 (11), 1339–1361. https://doi.org/10.1080/02687038.2013.825759
- Sackett, D. L. , Rosenberg, W. M. C. , Gray, J. A. M. , & Hayens, R. B. (1996). Evidence based medicine: What it is and what it isn’t. British Medical Journal , 312 (7023), 71–72. https://doi.org/10.1136/bmj.312.7023.71
- Sage, K. , Snell, C. , & Lambon Ralph, M. A. (2011). How intensive does anomia therapy for people with aphasia need to be? Neuropsychological Rehabilitation , 21 (1), 26–41. https://doi.org/10.1080/09602011.2010.528966
- Turkstra, L. , Norman, R. , Whyte, J. , Dijkers, M. P. , & Hart, T. (2016). Knowing what we’re doing: Why specification of treatment methods is critical for evidence-based practice in speech-language pathology. American Journal of Speech-Language Pathology , 25 (2), 164–171. https://doi.org/10.1044/2015_AJSLP-15-0060
- van de Sandt-Koenderman, M. E. , van der Meulen, I. , & Ribbers, G. M. (2012). Aphasia rehabilitation: More than treating the language disorder. Archives of Physical Medicine and Rehabilitation , 93 (1, Supplement), S1–S3. https://doi.org/10.1016/j.apmr.2011.08.037
- Varley, R. (2011). Rethinking aphasia therapy: A neuroscience perspective. International Journal of Speech-Language Pathology , 13 (1), 11–20. https://doi.org/10.3109/17549507.2010.497561
- Vratsistas-Curto, A. , Sherrington, C. , & McCluskey, A. (2019). Dosage and predictors of arm practice during inpatient stroke rehabilitation: An inception cohort study. Disability and Rehabilitation , 1–8. https://doi.org/10.1080/09638288.2019.1635215
- Walker, M. F. , Hoffmann, T. C. , Brady, M. C. , Dean, C. M. , Eng, J. J. , Farrin, A. J. , Felix, C. , Forster, A. , Langhorne, P. , Lynch, E. A , Radford, K. A , Sunnerhagen, K. S , & Watkins, C. L. (2017). Improving the development, monitoring and reporting of stroke rehabilitation research: Consensus-based core recommendations from the stroke recovery and rehabilitation Roundtable. International Journal of Stroke , 12 (5), 472–479. https://doi.org/10.1177/1747493017711815
- Waller, G. (2009). Evidence-based treatment and therapist drift. Behaviour Research and Therapy , 47 (2), 119–127. https://doi.org/10.1016/j.brat.2008.10.018
- Warren, S. , Fey, M. , & Yoder, P. (2007). Differential treatment intensity research: A missing link to creating optimally effective communication interventions. Mental Retardation and Developmental Disabilities Research Reviews , 13 (1), 70–77. https://doi.org/10.1002/mrdd.20139
- Whitworth, A. , Webster, J. , & Howard, D. (2014). A cognitive neuropsychological approach to assessment and intervention in aphasia (2nd ed). Psychology Press.
- Woodbury, M. L. , Anderson, K. , Finetto, C. , Fortune, A. , Dellenbach, B. , Grattan, E. , & Hutchison, S. (2016). Matching task difficulty to patient ability during task practice improves upper extremity motor skill after stroke: A proof-of-concept study. Archives of Physical Medicine and Rehabilitation , 97 (11), 1863–1871. https://doi.org/10.1016/j.apmr.2016.03.022
- Yamato, T. , Maher, C. , Saragiotto, B. , Moseley, A. , Hoffmann, T. , Elkins, M. , & Camargo, P. R. (2016). The TIDieR checklist will benefit the physical therapy profession. Brazilian Journal of Physical Therapy , 20 (3), 191–193. https://doi.org/10.1590/bjpt-rbf.2014.0182
- Yoder, P. , Fey, M. , & Warren, S. (2012). Studying the impact of intensity is important but complicated. International Journal of Speech-Language Pathology , 14 (5), 410–413. https://doi.org/10.3109/17549507.2012.685890
Appendices
Appendix A. Tasks completed in usual care-plus condition
Appendix B. Tasks completed in VERSE condition
Appendix C
The effect of severity on spontaneous verbal utterances was significant F (2,50) = 13.87, p = 000. Post hoc analyses indicated that the number of spontaneous verbal utterances was significantly higher in the mild to severe (p = 0.000) and moderate to severe (p = 0.000) groups. The effect of severity on non-verbal utterances was significant F (2,50) = 11.541, p = 000 and significantly higher in the severe compared to mild group (p = 0.001) and the moderate to severe (p = 0.000) group. The number of self-corrections was significantly affected by aphasia severity F (2,50) = 8.762, p = 001. Post hoc analysis indicated that the number of self-corrections was significantly greater in the mild compared to severe group (p = 0.000). Percent of errors self-corrected was significantly affected by aphasia severity F (2,50) = 21.137, p = 000. Post hoc analyses indicated that the mild group had a significantly higher percentage of self-corrections compared to the moderate (p = 0.001) and severe groups (p = 0.000) and the moderate group had a significantly higher percentage of self-corrections compared to the severe group (p = 0.050). The effect of aphasia severity on mean length of utterance (words) was significant F (2,50) = 22.619, p = 000. Post hoc analyses indicated that the mild group had a significantly higher mean length of utterance compared to the moderate (p = 0.034) and severe groups (p = 0.000) and the moderate group had a significantly higher mean length of utterance compared to the severe group (p = 0.001). The effect of aphasia severity on mean length of utterance (morphemes) was significant F (2,50) = 21.649, p = 000. Post hoc analyses after Bonferroni correction indicated that the mild group had a significantly higher mean length of utterances (morphemes) compared to the moderate (p = 0.043) and severe groups (p = 0.000) and the moderate group had a significantly higher mean length of utterance (morphemes) compared to the severe group (p = 0.001). Aphasia severity significantly affected the number of total utterances in a session F (2,50) = 4.051, p = .023. In post hoc analysis the severe group had significantly fewer total utterances than the moderate severity group (p = 0.019). Aphasia severity significantly affected the number of total words in a session F (2,50) = 17.695, p = .000. Post hoc analyses demonstrated that the number of total words in a session was significantly higher in the mild group compared to the severe group (p = 0.000). And the moderate severity group said significantly more words than the severe group (p = 0.000). Aphasia severity significantly affected the percent of total words that had errors F (2,50) = 7.689, p = .001. Post hoc analyses indicated that the number of total words with errors was significantly lower in the mild group compared to the severe group (p = 0.003). And the moderate severity group had significantly less percentage of total words with errors compared to the severe group (p = 0.010). The effect of aphasia severity on utterances per minute was significant F (2,50) = 4.053, p = 023 with the moderate severity group having a significantly higher utterance per minute ratio than the severe group (p = 0.019). The effect of aphasia severity on words per minute was significant F (2,50) = 16.825, p = 000. Post hoc analyses revealed that the mild severity group and the moderate severity group had a significantly higher words per minute ratio compared to the severe group, (p = 0.000) and (p=0.000) respectively. The effect of aphasia severity on mean turn length (words) was significant F (2,50) = 12.063, p = 000. Post hoc analyses indicated that the mild severity group and the moderate severity group had a significantly higher mean turn length compared to the severe group (p = 0.000) and (p=0.008) respectively. Aphasia severity significantly affected the number of cues used successfully in a session F (2,50) = 6.137, p = .004, as significantly less cues were used with success in the mild compared to severe severity groups (p = 0.003). Aphasia severity significantly affected the number of total cues used F (2,50) = 7.660, p = .001. Post hoc analyses indicated that significantly less cues were used in total in the mild compared to severe severity groups (p = 0.001). The effect of aphasia severity on the total utterances used by the therapist was significant F (2,50) = 11.086, p = 000. In a post hoc analysis there were significantly less utterances by the therapist in the mild compared to severe group (p = 0.000).
All other variables did not meet significance in post hoc testing p > 0.05.