
Abstract
In-vitro evidence suggests that the lipid component of foods alters vitamin D absorption. This single-blinded, cross-over postprandial study examined the effect of changing the lipid component of a 20 µg vitamin D3 fortified dairy drink on postprandial 25(OH)D concentrations. Participants consumed one dairy drink per visit: a non-lipid, a pre-formed oleic acid micelle, an olive oil and a fish oil dairy drink. There was a significant time*drink*baseline status effect on 25(OH)D concentrations (p = 0.039). There were no time*drink, time or drink effects on 25(OH)D in vitamin D sufficient participants (>50nmol/L). However, there was an effect of time on changes in 25(OH)D concentrations after the olive oil dairy drink (p = 0.034) in vitamin D insufficient participants (<50nmol/L). There were no effects after the other diary drinks. Olive oil may improve vitamin D absorption from fortified foods. Further research is needed to examine the practical implications of changing the lipid component of fortified foods.
Introduction
Vitamin D status is measured by circulating 25-hydroxyvitamin D (25(OH)D) concentrations. The Institute of Medicine (IOM) defines sufficiency, insufficiency and deficiency as 25(OH)D > 50nmol/L, <50nmol/L and <30nmol/L, respectively (Ross et al. Citation2011). Dietary vitamin D is essential to counteract seasonal variation in status and maintain vitamin D sufficiency year-round. However, few foods are naturally high in vitamin D and food fortification is not mandatory in all countries, thus intakes are often below recommendations (Cashman et al. Citation2013; Public Health England Citation2018). Data modelling studies show that fortifying foods with vitamin D improves vitamin D intakes (Ejtahed et al. Citation2016; Jaaskelainen et al. Citation2017; Moyersoen et al. Citation2019; Weir et al. Citation2021). In Finland, a data modelling exercise led to mandatory fortification of fluid milk products and fat spreads resulting in an 18 nmol/L increase in 25(OH)D concentrations in the 8 years after implementing the policy change (Jaaskelainen et al. Citation2017). Another more recent study in Northern Ireland showed similar results, with a ∼12% increase in the proportion meeting recommendations when cow’s milk was fortified with 2 µg of vitamin D/100g (Weir et al. Citation2021).
Ensuring adequate vitamin D intake is the first step, but food digestion and vitamin D absorption is necessary to improve vitamin D status. Very few human studies examine vitamin D absorption and the majority, published 30–40 years ago, focus on diseases of the digestive tract (Barragry et al. Citation1978; Sitrin and Bengoa Citation1987; Leichtmann et al. Citation1991). Early studies described vitamin D absorption as a non-saturable diffusion process taking place in the jejenum and ileum; however, more recent in-vitro research suggests that vitamin D absorption is partially mediated by cholesterol transport proteins (Hollander et al. Citation1978; Hollander Citation1981; Reboul et al. Citation2011). Other in-vitro research shows potential to improve absorption by incorporating fat soluble vitamins within a micelle before consumption (Goncalves et al. Citation2013). Building on this in-vitro work, Marwaha and colleagues report greater increases in 25(OH)D with a water micellised vitamin D supplement compared to a conventional vitamin D supplement in children and adults (Marwaha et al. Citation2016, Citation2019). Similarly. another postprandial study reported no significant difference in 25(OH)D concentrations when vitamin D was encapsulated in a casein-micelle in a non-lipid yogurt compared to the conventional enriched 3% lipid yogurt (Cohen et al. Citation2017).
Other in-vitro research suggests the type of lipid used as a vitamin D carrier impacts vitamin D absorption (Goncalves et al. Citation2013; Ozturk et al. Citation2015). Fatty acids longer than 20 carbons and polyunsaturated fatty acids (PUFA) reduce vitamin D absorption (Goncalves et al. Citation2013), whereas fatty acids with a chain length of 16–18 carbons and mono-unsaturated fatty acids (MUFA), particularly oleic acid, increase absorption (Qian et al. Citation2012; Ozturk et al. Citation2015). The effect of fatty acids with a chain length of 16–18 carbons and few unsaturated bonds is most likely due to increased solubility and ability to accommodate large molecules (Qian et al. Citation2012; Ozturk et al. Citation2015). Thus, incorporating vitamin D into pre-formed oleic acid micelles or when olive oil is present could improve vitamin D absorption (Goncalves et al. Citation2013); however these results are not confirmed in-vivo. While these studies show the potential for modifying the lipid component of vitamin D fortified foods to improve vitamin D absorption and therefore status compared to standard fortified products that are currently on the market, there is limited evidence describing the impact of different lipid types on immediate postprandial changes in 25(OH)D concentrations in-vivo. This cross-over postprandial study examined changes in 25(OH)D following consumption of 4 vitamin D fortified dairy drinks each with a different lipid component.
Materials and methods
Participants
Ethical approval was granted from the University College Dublin (UCD) Human Research Ethics Committee (LS-18-59-O’Sullivan-McCourt) and all procedures were conducted according to the principles expressed in the Declaration of Helsinki. This trial was registered at clinicaltrials.gov (NCT04935034). Healthy adults aged >18years were recruited between October 2018 and February 2019 in Dublin, Ireland. Exclusion criteria included: <18years old; pregnant or lactating women; smokers; an inability to read, write or understand English; institutionalised individuals; any prescribed diet, any disease or condition that required chronic therapeutic medical or nutritional treatment; consuming supplemental vitamin D; sun holiday in the last 2 months or over the course of the study; milk protein or soy allergy and lactose intolerance. Those who expressed interest were asked to complete a screening questionnaire and to provide written, informed consent.
Study design
This was a single-blinded, 4 way cross-over postprandial study. Participants (n = 12) completed a minimum of 3 visits with at least 1 week between visits (). Participants consumed one of the following drinks on each visit: a vitamin D fortified non-lipid dairy drink, a vitamin D fortified pre-formed oleic acid micelle dairy drink, a vitamin D fortified diary drink with olive oil as the lipid component or a vitamin D fortified dairy drink with a fish oil as the lipid component. Participants were asked to consume a low-fat dinner from a list of low fat dinner options (e.g. tomato based pasta dish, lean meat, potato and vegetables) on the night before their study visit and to repeat the same meal on the night before all other visits. Participants were also asked not to consume vitamin D, caffeine, alcohol, or do strenuous exercise 24 hours before study visits. Compliance with pre-visit instructions was checked on the morning of each visit before proceeding. Participants arrived to the intervention suite in the UCD Institute of Food and Health between 08.00 and 10.00am after a 12 hour fast. Anthropometric measurements were recorded upon arrival using standardised protocols (Tanita scale, Model BC-420MA; freestanding SECA stadiometer, Leicester MkII). Participants were cannulated by a trained phlebotomist and a baseline serum sample was collected. Participants consumed the study drink, followed by non-fortified corn flakes, non-fortified skimmed milk and a banana (). Postprandial serum samples were collected at 2, 4, 6 and 8 hours. A low-fat study lunch was provided after the 4 hour blood sample was collected. The lunch included a low-fat soup, 2 small bread rolls and a banana (). The study breakfast and lunch contained no vitamin D. Subjects remained in the intervention suite for the duration of the study. Participants could consume water (recorded), but no other food or drinks were consumed.
Figure 1. Flowchart of study progression.
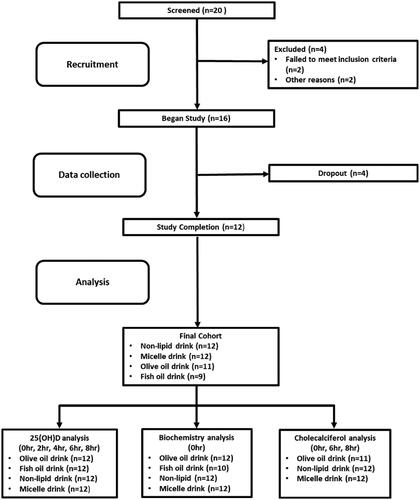
Table 1. Nutritional composition of the dairy drinks and study meals.
Study drinks
Due to the nature of drink production it was not possible to blind researchers to the study drinks. All 4 drinks contained 20 µg of vitamin D3 in fractionated coconut oil, 85.5 mL water, 6.8 g lactose (Kerry Group, Ireland), 5.5 g milk protein isolate (Kerry Group, Ireland) and were sweetened with 5.0 g granulated sugar (Tesco, Ireland) and salted caramel artificial flavouring (Tesco, Ireland) (). The lipid component was different between dairy drinks: 1) no lipid content (non-lipid), 2) pre-formed oleic acid micelles, 3) olive oil and 4) fish oil. A detailed methodology describing the formation of the pre-formed oleic acid micelles was published recently (Mulrooney et al. Citation2021).
Dietary assessment
Food and drink intake was assessed by 24 hour dietary recall on each study visit using the US Department of Agriculture Automated Multiple Pass Method (USDA AMPM) to standardise assessments (Raper et al. Citation2004). In brief, the participants were asked to recall all foods and drinks consumed, uninterrupted. The interviewer asked specific questions to probe forgotten foods, followed by times and places of eating occasions, brand names and cooking methods. The interviewer recalled the items consumed in chronological order, as a final probe for any forgotten details. All 24 hour dietary recalls were entered into Nutritics dietary analysis software (Nutritics Research Edition, v5.095, Dublin, Ireland). Data was quality controlled for accuracy by rechecking the foods and weights entered in all dietary recalls. Data was exported to SPSS version 24 (IBM Corp., Armonk, NY, USA) and mean daily energy and nutrient intakes were calculated.
Serum collection and analysis
Bloods samples were collected into 10 mL clot activator serum tubes (BD, Ireland). Samples were inverted 5 times and allowed to clot for 30 minutes at room temperature. Samples were centrifuged at 1500RCF for 15 minutes at 20 °C (Rotina 38 R, Hettich, France). After centrifugation, serum was aliquoted and stored at −80 °C until analysis. Standard commercial kits were used to measure clinical biochemistry markers according to manufacturer’s instructions. Serum glucose, total cholesterol (TC), high-density lipoprotein cholesterol (HDL-C), and triglycerides (TG) were measured using the Randox Daytona (Randox Laboratories, Antrim, U.K). Low-density-lipoprotein cholesterol (LDL-C) was calculated using the Friedewald formula (Friedewald et al. Citation1972): LDL-C = (TC – HDL-C) – (TG/2.17) mmol/L.
Serum vitamin D measurements
Vitamin D concentration was assessed by quantification of total 25(OH)D (D2 and D3) by a validated method (Chromsystems Instruments and Chemicals GmbH) using liquid chromatography-tandem mass spectrometry (LC-MS-MS) (API 4000; AB SCIEX, UK) in the Biochemistry Department of St James’s Hospital, Dublin, Ireland (accredited to ISO 15189). The quality and accuracy of the method was monitored by the use of internal quality controls, participation in the Vitamin D External Quality Assessment Scheme (DEQAS) and the use of the National Institute of Standards and Technology (NIST) 972 vitamin D standard reference material. The respective inter- and intra-assay coefficients of variation were 5.7% and 4.5% (Laird et al. Citation2018). The change from baseline to peak 25(OH)D concentration (0 h-peak), the percentage change in 25(OH)D concentration from baseline to peak 25(OH)D (%change), the area under curve (AUC), and the incremental area under curve (iAUC) were calculated. Vitamin D sufficiency and insufficiency were defined as ≥50nmol/L and <50nmol/L, respectively (Ross et al. Citation2011). We use the term “response” when referring to postprandial changes in 25(OH)D concentrations throughout the paper.
Serum cholecalciferol concentration was measured at baseline, 6 and 8 hours postprandial as cholecalciferol concentration was expected to peak between 6 and 8 hours. Serum cholecalciferol was analysed for the non-lipid, pre-formed micelle and olive dairy drink visits only by Vitas Analytical Services, Oslo, Norway. Human serum (50 µL) was diluted with 150 µL isopropanol with deuterium labelled cholecalciferol internal standard. After mixing (10 min) and centrifugation (10 min, 4000 g at 10 °C), 30 µL of the supernatant was injected into the High Performance LC (HPLC) system. HPLC was performed with an Agilent 1260/1290 liquid chromatograph (Agilent Technologies, USA) interfaced by atmospheric pressure chemical ionisation (APCI) to an Agilent Technologies mass spectrometric detector. Cholecalciferol was eluated on a 4.6 mm x 50 mm reversed phase column with 1.8 µM particles. The column temperature was 20 °C. A seven-point chemical calibration curve was made ranging from 4–260 nmol/L. The lowest limit of detection was 5 nmol/L.
Statistical analysis
Statistical analysis was performed in SPSS version 24 (IBM Corp., Armonk, NY, USA). The distribution of data was checked using the explore function in SPSS and boxplots were created to examine outliers. All variables were normally distributed, based on histograms and a Shapiro-Wilks test p-value >0.05. Anthropometric and clinical biochemistry data are presented as mean ± standard error of the mean (SE). Three participants did not complete the fish oil drink visit and one participant did not complete the olive oil drink visit. Missing values were imputed for intention to treat analysis by calculating the mean 25(OH)D concentration at each time point for the 3 other drinks that the participant consumed. General linear model analysis of covariance (GLM ANCOVA) was used to compare differences in anthropometric, clinical biochemistry and dietary data between males and females at baseline including percentage body fat (%BF) and dietary energy intake (MJ) as covariates where necessary. General linear model analysis of variance (GLM ANOVA) was used to compare differences in baseline 25(OH)D concentrations between those who started the study in autumn and in winter. A three-way GLM repeated measures analysis of covariance (ANCOVA) controlling for sex assessed the interaction effect of time, drink, and baseline status (at visit 1) on 25(OH)D concentrations. When there was a significant three-way interaction, a two-way GLM repeated measures ANOVA split for baseline vitamin D status was used to assess the effect of time and drink on 25(OH)D concentration in vitamin D sufficient and insufficient participants (vitamin D status). When there was a significant two-way interaction, a one-way GLM repeated measures ANOVA split for baseline vitamin D status was used to assess the simple main effects of time and drink on 25(OH)D concentrations in sufficient and insufficient participants. A two-way GLM repeated measures ANCOVA was used to assess the interaction effect of drink and baseline status on AUC. A univariate GLM ANOVA and a one-way GLM repeated measures ANOVA split for baseline status was used to assess the simple main effects of drink and baseline status on AUC. This was repeated to assess the interaction and simple main effects of drink and baseline status on iAUC and %change in 25(OH)D.
Results
Subject characteristics
In total, 7 males and 5 females aged 27.0 ± 3.0 years completed the study. Biochemistry measurements for all participants were within the normal range (). Fasting glucose (5.2 ± 0.1 vs 4.7 ± 0.2 mmol/L, p = 0.025) and TC (5.1 ± 0.3 vs 4.7 ± 0.4 mmol/L, p = 0.045) concentrations of males were higher than females. The mean BMI of males (25.4 ± 1.9 kg/m2) was higher than females (22.5 ± 1.2 kg/m2) (p < 0.001). Based on a 24 hour dietary recall, participants had a mean daily vitamin D intake of 2.0 ± 0.8 µg (). Females consumed a higher carbohydrate contribution to total energy intake (54.3 ± 4.6%) than males (42.1 ± 3.3%) (p = 0.048). Repeated measures analysis showed no significant differences in fasting biochemistry (p = 0.393) or anthropometric measures across study visits (p = 0.870).
Table 2. Baseline subject characteristics, including anthropometric measurements, serum profile and dietary intake.
Baseline vitamin D status
Mean 25(OH)D concentration at baseline visit 1 was 51.6 ± 5.0 nmol/L. Eight participants were vitamin D sufficient (>50nmol/L) and 4 were vitamin D insufficient (<50nmol/L). Seven participants began the study between October and December (autumn) and 5 began between January and March (winter). One participant who started in autumn was vitamin D insufficient at baseline visit 1. Three participants who started in winter were vitamin D insufficient at baseline visit 1. There was a significant difference in the mean 25(OH)D concentration at baseline visit 1 for those who started in autumn (66.7 ± 11.1 nmol/L) compared to winter (41.6 ± 17.0 nmol/L, p = 0.011). There was a significant decrease in baseline 25(OH)D concentrations as participants progressed through the study (p = 0.003). Six participants were vitamin D insufficient on study completion.
Postprandial serum 25(OH)D response
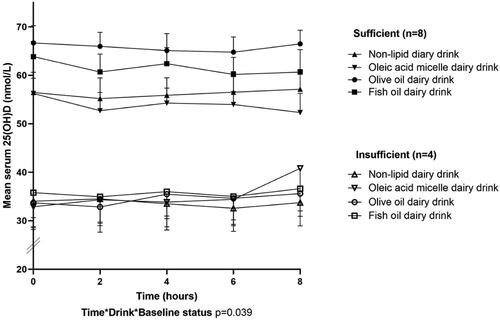
The mean 25(OH)D concentration of sufficient participants was 59.4 ± 3.2 nmol/L compared to 34.8 ± 5.0 nmol/L in insufficient participants. The mean 25(OH)D concentration after the non-lipid dairy drink was 44.8 ± 3.5 nmol/L, compared to 44.5 ± 3.0 nmol/L after the micelle dairy drink, 50.0 ± 2.9 nmol/L after the olive oil dairy drink and 48.6 ± 3.2 nmol/L after the fish oil drink. There was a time*drink*baseline status interaction effect on 25(OH)D concentrations (p = 0.039) (). Post-hoc analysis separating sufficient and insufficient participants showed no time*drink, time or drink effects for the sufficient participants. However, there was a significant time*drink (p = 0.002) and time (p = 0.015) effect on 25(OH)D concentrations for the insufficient group. In the insufficient participants, there was a significant increase of 1.9 ± 0.7 nmol/L after consuming the olive oil dairy drink (p = 0.034) (). However, there was no change in 25(OH)D over time after any other dairy drinks.
Figure 2. Postprandial 25(OH)D response to the study drinks in vitamin D sufficient participants and insufficient participants. Values are mean ± SE.
presents the two-way GLM repeated measures ANCOVA for the change from baseline to peak 25(OH)D concentration (0 h-peak), %change, AUC and iAUC for each drink, according to vitamin D status. There was a significant effect of drink*baseline status on 0 h-peak 25(OH)D concentration (p = 0.027) and a significant main effect of baseline status (p = 0.043); but no effect of drink (p = 0.302). The 0 hr-peak in the sufficient participants was 1.5 ± 0.5 nmol/L compared to 3.6 ± 0.7 nmol/L in the insufficient participants. There were no difference in 0 h-peak between drinks when split by vitamin D status. There was a significant effect of drink*baseline status effect on %change in 25OHD concentrations (p < 0.001) and a significant main effect of baseline status (p = 0.005); but no effect of drink (p = 0.379). The %change in the sufficient participants was 2.5 ± 1.5% compared to 11.1 ± 1.9% in the insufficient participants. There were no difference in %change between drinks when split by vitamin D status. There was no effects of drink*baseline status (p = 0.194) or drink (p = 0.191) on AUC, but there was a main effect of baseline status (p = 0.004). The AUC of sufficient participants was 231.0 ± 14.3nmolxh/L compared to 141.3 ± 20.5nmolxh/L for insufficient participants. In the sufficient participants, the AUC of the olive oil drink was greater than the non-lipid and micelle drinks, however there were no difference in AUC between drinks in the insufficient participants. There was an effect of drink*baseline status on iAUC (p = 0.002), but no main effect of drink (p = 0.638) or baseline status (p = 0.071). The iAUC of sufficient participants was 1.3 ± 0.4nmolxh/L compared to 2.7 ± 0.56nmolxh/L for insufficient participants. The iAUC of the fish oil drink was higher than the non-lipid drink in the insufficient participants, however there were no difference in iAUC between drinks in the sufficient participants.
Table 3. Postprandial change in 25(OH)D concentrations in response to study drinks in vitamin D sufficient and insufficient participants.
Postprandial serum cholecalciferol response
Four participants were vitamin D insufficient starting the study and cholecalciferol concentrations were below the limit of detection (<5nmol/L) in all samples from these participant. Five of the vitamin D sufficient participants had cholecalciferol concentrations above the limit of detection in at least 1 sample (). On the non-lipid dairy drink visit, cholecalciferol was above the limit of detection at any time point for 3 participants. Of these, 2 had cholecalciferol concentrations above the limit of detection at 6 or 8 hours, while 1 participant had cholecalciferol >5nmol/L at baseline (). The mean peak cholecalciferol concentration for the non-lipid dairy drink was 9.1 ± 3.0 nmol/L. In the micelle dairy drink visit samples, cholecalciferol was above the limit of detection at any time point for 2 participants. One participant had a concentration peak at 8 hours and the other had cholecalciferol above the limit of detection at 6 hours only (). The mean peak cholecalciferol concentration for the micelle dairy drink was 7.7 ± 2.8 nmol/L. Four participants had cholecalciferol above the limit of detection for the olive oil drink visits. Cholecalciferol concentrations peaked at 8 hours for 3 participants and 1 had cholecalciferol concentrations above the limit of detection at baseline only (). The mean peak cholecalciferol concentration for the olive oil dairy drink was 8.8 ± 2.9 nmol/L. No participant had cholecalciferol concentrations above the limit of detection for all of the study visits.
Table 4. Baseline and postprandial serum cholecalciferol concentrations.
Discussion
Serum 25(OH)D concentrations increased after the vitamin D fortified olive oil dairy drink in the insufficient participants, but not after the non-lipid, pre-formed oleic acid micelle and fish oil dairy drinks. Serum 25(OH)D concentrations did not change in the vitamin D sufficient group after any vitamin D fortified diary drinks. Baseline vitamin D status at visit 1 influenced 25(OH)D response, therefore baseline vitamin D status at visit 1 was included as a between subject factor in the analysis. The effect of baseline status on vitamin D response was also observed when comparing iAUC and %change between drinks for insufficient participants. Also, baseline 25(OH)D concentrations decreased as participants moved through the study due to the expected seasonal drop in sun exposure and hence vitamin D synthesis and circulating 25(OH)D concentrations.
To the best of our knowledge, this is the first postprandial study demonstrating that a vitamin D fortified olive oil based diary drink improves postprandial 25(OH)D response in insufficient participants. Older postprandial studies demonstrate that lipids are required for vitamin D absorption and that cow’s milk is an effective vitamin D delivery vehicle (Barragry et al. Citation1978; Davies et al. Citation1980; Compston et al. Citation1981). However, since the 1980s very little research describes vitamin D absorption except for a few recent studies that present postprandial 25(OH)D concentrations after a supplement and a fortified dairy drink (Dawson-Hughes et al. Citation2015; Guo et al. Citation2017). Dawson-Hughes et al. showed that consuming a vitamin D supplement with a fat containing meal increases absorption by ∼32%; however the MUFA:PUFA ratio of the meal did not impact vitamin D absorption (Dawson-Hughes et al. Citation2015). We report that olive oil with a high MUFA content increased postprandial concentrations of 25(OH)D, in comparison to the other dairy drinks; therefore the lipid composition of a meal may interact differently with vitamin D absorption compared to a single fortified food. Another recent study compared the effects of a 25(OH)D or a vitamin D3 fortified high-fat dairy drink on 25(OH)D concentrations (Guo et al. Citation2017). The mean increase in 25(OH)D after the vitamin D3 drink was very similar to that after the olive oil dairy drink in this study (∼3.6 nmol/L versus ∼3.4 nmol/L) (Guo et al. Citation2017). Although vitamin D postprandial studies are limited, they support our finding that an olive oil dairy drink is an effective vitamin D delivery system compared to a non-lipid control.
As previously mentioned, in-vitro studies suggest the effect of different lipids on vitamin D absorption is driven by fatty acid chain length and degree of saturation (Goncalves et al. Citation2013; Ozturk et al. Citation2015). In one in-vitro study, fish oil decreased absorption by 42% when compared to olive oil (Goncalves et al. Citation2013), and we report no 25(OH)D increase after the fish oil dairy drink. We also report no difference between the iAUC of the fish oil and micelle dairy drinks, however the iAUC of the fish oil dairy drink was higher than that of the non-lipid dairy drink (data not shown). Hence our findings on the effect of olive oil and fish oil on vitamin D absorption support previous in-vitro results. In contrast, we report no significant change in 25(OH)D after the pre-formed oleic acid micelle dairy drink which conflicts with in-vitro research (Goncalves et al. Citation2013). It is not clear why the pre-formed oleic acid micelle dairy drink did not increase 25(OH)D; however, it is possible that the large variation in response masked any potential effect of this novel emulsion.
Baseline vitamin D status predicted vitamin D response, therefore baseline vitamin D status was a between subject factor in the analysis. Supplementation trials repeatedly report an effect of baseline vitamin D status on 25(OH)D response (Blum et al. Citation2008; Waterhouse et al. Citation2014; Reyes-Garcia et al. Citation2019). However, recent postprandial studies target only one vitamin D status group and thus cannot compare response between vitamin D sufficient and insufficient participants (Dawson-Hughes et al. Citation2015; Guo et al. Citation2017). In the current postprandial study there was a larger 25(OH)D response to the vitamin D fortified dairy drinks in the insufficient participants compared to sufficient. The mechanism underlying the exaggerated 25(OH)D response in vitamin D insufficient is unclear. Some authors suggest that hepatic 25-hydroxylation increases when 25(OH)D concentrations are low and decreases when 25(OH)D concentrations are higher; but they do not provide supportive evidence (Barragry et al. Citation1978; Heaney et al. Citation2008). It is also possible that there is an adaptive response in the gastrointestinal tract that means more vitamin D is absorbed when a person is vitamin D insufficient, but as yet there is no evidence of this effect from human studies.
To the best of our knowledge, this is the first study reporting postprandial cholecalciferol concentrations. Despite its potential as a biomarker of vitamin D intake and absorption, cholecalciferol concentrations are not typically reported in studies due to inherent analytical challenges (Barger-Lux et al. Citation1998; Best et al. Citation2021). In the current study we only see cholecalciferol concentrations >5nmol/L for vitamin D sufficient participants. In line with this, a very recent study reporting LC-MS/MS cholecalciferol quantification showed that serum concentrations did not exceed 2.5 nmol/L when participants baseline 25(OH)D was <40nmol/L (Best et al. Citation2021). Best and colleagues suggest that this is due to rapid vitamin D hydroxylation when baseline concentrations are low (<50nmol/L) (Best et al. Citation2021). No participants in this study had the same cholecalciferol response to any dairy drink, except that the olive oil diary drink increased cholecalciferol above 5 nmol/L for 4 participants with peak concentrations at 8 hours. These findings, while limited, contribute to the small evidence base and confirm the need for further research assessing cholecalciferol response to supplementation and its potential use as a vitamin D intake and absorption biomarker.
The results presented here show high inter and intra individual variation in response to vitamin D fortified diary drinks; likely driven by a combination of genes and environment. There are some known genetic variants in vitamin D transport and hydroxylation; however, very little is known about vitamin D absorption genetic variations (Wang et al. Citation2010). Several environmental factors also impact vitamin D status and therefore 25(OH)D response (Spiro and Buttriss Citation2014; Mazahery and von Hurst Citation2015). For example, low sun exposure and low vitamin D or calcium intakes result in low circulating 25(OH)D and therefore a greater response to vitamin D intake (Bell et al. Citation1987; Goussous et al. Citation2005; Thomas et al. Citation2010; Spiro and Buttriss Citation2014; Mazahery and von Hurst Citation2015). One inter-individual variation noted in this study was a drop in 25(OH)D between baseline and 2 hours followed by an increase from 4 to 8 hours postprandial. Another postprandial study reports a similar trend, suggesting that the delayed response in some individuals is due to hepatic vitamin D uptake and hydroxylation (Krawitt et al. Citation1977). This delayed response suggests that individual metabolic phenotypes impact postprandial 25(OH)D changes, which could override any potential effect of lipids on response when using 25(OH)D as a biomarker. In summary, one of the most striking features of this study was variation in 25(OH)D response. More research is needed on vitamin D absorption and metabolism so foods can be designed to target improved vitamin D status.
A strength of this study is that 25(OH)D concentrations were quantified by LC-MS/MS which is the gold standard for measuring vitamin D status. In addition, the study was carried out between October and April and participants were excluded if they were travelling abroad during the study period; thus reducing cutaneous vitamin D synthesis effects. However, there are a number of limitations which should be considered when interpreting these results. Firstly, it was not possible to randomise the order that participants received the drinks. However, due to the timing of drinks production participants received drinks in different order; nonetheless this could potentially bias results towards a particular drink. In addition, most participants completed the olive and fish oil dairy drink visits in autumn resulting in higher baseline 25(OH)D concentrations for these visits. Considering the known effect of baseline vitamin D status on 25(OH)D response we expected a smaller increase in 25(OH)D concentrations with a higher baseline concentration; however, the olive oil dairy drink resulted in a significant 25(OH)D increase compared to other drinks. It was also not possible to produce the non-lipid and pre-formed oleic acid micelle dairy drinks in advance of the study visits and therefore it was not possible to blind the researcher. Also, while the drinks were matched on appearance, it was not possible to match the taste of the drinks due to the strong taste of the fish oil and the oleic acid micelle. This study did not include a non-fortified control drink for comparison against the vitamin D fortified dairy drinks. Instead the non-lipid vitamin D fortified dairy drink acted as a positive control for comparison against the other diary drinks. Therefore, we could not compare postprandial 25(OH)D concentrations from the different lipid dairy drinks to a non-fortified placebo. Lastly although we measured serum cholecalciferol, the majority of cholecalciferol concentrations were below the limit of detection, rendering it impossible to determine cholecalciferol response to the dairy drinks.
Vitamin D is essential for human health. While vitamin D insufficiency rates are high, food fortification can significantly improve population vitamin D intakes (Cashman et al. Citation2013; Ejtahed et al. Citation2016; Moyersoen et al. Citation2019; Weir et al. Citation2021). The current study demonstrates that a vitamin D fortified olive oil dairy drink can increase 25(OH)D in vitamin D insufficient participants, supporting previous research showing that lipids impact vitamin D absorption (Barragry et al. Citation1978). However in contrast to in-vitro results, pre-formed oleic acid micelles did not improve vitamin D absorption (Goncalves et al. Citation2013). One striking feature of this study is the large degree of variation in response to vitamin D intake. Using olive oil as the lipid component of vitamin D fortified foods may improve vitamin D absorption and thus vitamin D status. However, before this can be implemented at a food manufacturing level, practical implications need to be assessed. In addition, more postprandial studies reporting both cholecalciferol and 25(OH)D concentrations will increase our understanding of vitamin D response and absorption kinetics. To conclude, this research supports the use of olive oil as the lipid component of vitamin D fortified dairy drinks to improve 25(OH)D in insufficient participants.
Disclosure statement
The authors report no conflict of interest.
Additional information
Funding
References
- Barger-Lux MJ, Heaney RP, Dowell S, Chen TC, Holick MF. 1998. Vitamin D and its major metabolites: serum levels after graded oral dosing in healthy men. Osteoporos Int. 8(3):222–230.
- Barragry JM, France MW, Corless D, Gupta SP, Switala S, Boucher BJ, Cohen RD. 1978. Intestinal cholecalciferol absorption in the elderly and in younger adults. Clin Sci Mol Med. 55(2):213–220.
- Bell NH, Shaw S, Turner RT. 1987. Evidence that calcium modulates circulating 25-hydroxyvitamin D in man. J Bone Miner Res. 2(3):211–214.
- Best CM, Riley DV, Laha TJ, Pflaum H, Zelnick LR, Hsu S, Thummel KE, Foster-Schubert KE, Kuzma JN, Cromer G, et al. 2021. Vitamin D in human serum and adipose tissue after supplementation. Am J Clin Nutr. 113(1):83–91.
- Blum M, Dallal GE, Dawson-Hughes B. 2008. Body size and serum 25 hydroxy vitamin D response to oral supplements in healthy older adults. J Am Coll Nutr. 27(2):274–279.
- Cashman KD, Muldowney S, McNulty B, Nugent A, FitzGerald AP, Kiely M, Walton J, Gibney MJ, Flynn A. 2013. Vitamin D status of Irish adults: findings from the National Adult Nutrition Survey. Br J Nutr. 109(7):1248–1256.
- Cohen Y, Ish-Shalom S, Segal E, Nudelman O, Shpigelman A, Livney YD. 2017. The bioavailability of vitamin D3, a model hydrophobic nutraceutical, in casein micelles, as model protein nanoparticles: Human clinical trial results. J Funct Foods. 30:321–325.
- Compston JE, Merrett AL, Hammett FG, Magill P. 1981. Comparison of the appearance of radiolabelled Vitamin D3 and 25-Hydroxy-Vitamin D3 in the chylomicron fraction of plasma after oral administration in man. Clin Sci (Lond). 60(2):241–243.
- Davies M, Mawer EB, Krawitt EL. 1980. Comparative absorption of vitamin D3 and 25-hydroxyvitamin D3 in intestinal disease. Gut. 21(4):287–292.
- Dawson-Hughes B, Harris SS, Lichtenstein AH, Dolnikowski G, Palermo NJ, Rasmussen H. 2015. Dietary fat increases vitamin D-3 absorption. J Acad Nutr Diet. 115(2):225–230.
- Ejtahed H-S, Shab-Bidar S, Hosseinpanah F, Mirmiran P, Azizi F. 2016. Estimation of Vitamin D Intake Based on a Scenario for Fortification of Dairy Products with Vitamin D in a Tehranian Population, Iran. J Am Coll Nutr. 35(5):383–391.
- Friedewald WT, Levy RI, Fredrickson DS. 1972. Estimation of the concentration of low-density lipoprotein cholesterol in plasma, without use of the preparative ultracentrifuge. Clin Chem. 18(6):499–502.
- Goncalves A, Gleize B, Roi S, Nowicki M, Dhaussy A, Huertas A, Amiot M-J, Reboul E. 2013. Fatty acids affect micellar properties and modulate vitamin D uptake and basolateral efflux in Caco-2 cells. J Nutr Biochem. 24(10):1751–1757.
- Goussous R, Song L, Dallal GE, Dawson-Hughes B. 2005. Lack of effect of calcium intake on the 25-hydroxyvitamin D response to oral vitamin D3. J Clin Endocrinol Metab. 90(2):707–711.
- Guo J, Jackson KG, Che Taha CSB, Li Y, Givens DI, Lovegrove JA. 2017. A 25-Hydroxycholecalciferol-fortified dairy drink is more effective at raising a marker of postprandial Vitamin D Status than cholecalciferol in men with suboptimal Vitamin D status. J Nutr. 147(11):2076–2082.
- Heaney RP, Armas LA, Shary JR, Bell NH, Binkley N, Hollis BW. 2008. 25-Hydroxylation of vitamin D3: relation to circulating vitamin D3 under various input conditions. Am J Clin Nutr. 87(6):1738–1742.
- Hollander D. 1981. Intestinal absorption of vitamins A, E, D, and K. J Lab Clin Med. 97(4):449–462.
- Hollander D, Muralidhara KS, Zimmerman A. 1978. Vitamin D-3 intestinal absorption in vivo: influence of fatty acids, bile salts, and perfusate pH on absorption. Gut. 19(4):267–272.
- Jaaskelainen T, Itkonen ST, Lundqvist A, Erkkola M, Koskela T, Lakkala K, Dowling KG, Hull GL, Kroger H, Karppinen J, et al. 2017. The positive impact of general vitamin D food fortification policy on vitamin D status in a representative adult Finnish population: evidence from an 11-y follow-up based on standardized 25-hydroxyvitamin D data. Am J Clin Nutr. 105(6):ajcn151415–1520.
- Krawitt EL, Grundman MJ, Mawer EB. 1977. Absorption, hydroxylation, and excretion of vitamin D3 in primary biliary cirrhosis. Lancet. 2(8051):1246–1249.
- Laird E, O’Halloran AM, Carey D, Healy M, O’Connor D, Moore P, Shannon T, Molloy AM, Kenny RA. 2018. The prevalence of Vitamin D deficiency and the determinants of 25(OH)D concentration in older Irish adults: data from The Irish Longitudinal Study on Ageing (TILDA). J Gerontol A Biol Sci Med Sci. 73(4):519–525.
- Leichtmann GA, Bengoa JM, Bolt MJ, Sitrin MD. 1991. Intestinal absorption of cholecalciferol and 25-hydroxycholecalciferol in patients with both Crohn's disease and intestinal resection. Am J Clin Nutr. 54(3):548–552.
- Marwaha RK, Dev T, Mittal A, Mani K, Narang A, Arora P, Singh A, Chadha A, Dang N, Goel M. 2019. A randomised controlled trial comparing the efficacy of micellised and fat-soluble vitamin D3 supplementation in healthy adults. B J Nutr. 121(8):859–865.
- Marwaha RK, Yenamandra VK, Ganie MA, Sethuraman G, Sreenivas V, Ramakrishnan L, Mathur SK, Sharma VK, Mithal A. 2016. Efficacy of micellized vs. fat-soluble vitamin D3 supplementation in healthy school children from Northern India. J Pediatr Endocrinol Metab. 29(12):1373–1377.
- Mazahery H, von Hurst PR. 2015. Factors affecting 25-Hydroxyvitamin D concentration in response to Vitamin D supplementation. Nutrients. 7(7):5111–5142.
- Moyersoen I, Devleesschauwer B, Dekkers A, Verkaik-Kloosterman J, De Ridder K, Vandevijvere S, Tafforeau J, Van Oyen H, Lachat C, Van Camp J. 2019. A novel approach to optimize Vitamin D intake in Belgium through fortification based on representative food consumption data. J Nutr. 149(10):1852–1862.
- Mulrooney SL, O'Neill GJ, Brougham DF, O'Riordan D. 2021. Vitamin D3 bioaccessibility: Influence of fatty acid chain length, salt concentration and l-α-phosphatidylcholine concentration on mixed micelle formation and delivery of vitamin D3. Food Chem. 344:128722.
- Ozturk B, Argin S, Ozilgen M, McClements DJ. 2015. Nanoemulsion delivery systems for oil-soluble vitamins: Influence of carrier oil type on lipid digestion and vitamin D3 bioaccessibility. Food Chem. 187:499–506.
- Public Health England 2018. NDNS results from years 7 and 8(combined): data tables. England: Public Health England.
- Qian C, Decker EA, Xiao H, McClements DJ. 2012. Nanoemulsion delivery systems: influence of carrier oil on beta-carotene bioaccessibility. Food Chem. 135(3):1440–1447.
- Raper N, Perloff B, Ingwersen L, Steinfeldt L, Anand J. 2004. An overview of USDA's Dietary Intake Data System. J Food Compost Anal. 17(3-4):545–555.
- Reboul E, Goncalves A, Comera C, Bott R, Nowicki M, Landrier JF, Jourdheuil-Rahmani D, Dufour C, Collet X, Borel P. 2011. Vitamin D intestinal absorption is not a simple passive diffusion: evidences for involvement of cholesterol transporters. Mol. Nutr. Food Res. 55(5):691–702.
- Reyes-Garcia R, Garcia-Martin A, Palacios S, Salas N, Mendoza N, Quesada-Charneco M, Fonolla J, Lara-Villoslada F, Muñoz-Torres M. 2019. Factors predicting the response to a Vitamin D-fortified milk in healthy postmenopausal women. Nutrients. 11(11):2641.
- Ross AC, Taylor CL, Yaktine AL, DelValle HB. 2011. Dietary reference intakes for calcium and vitamin D. Washington (DC): Institute of Medicine Food and Nutrition Board.
- Sitrin MD, Bengoa JM. 1987. Intestinal absorption of cholecalciferol and 25-hydroxycholecalciferol in chronic cholestatic liver disease. Am J Clin Nutr. 46(6):1011–1015.
- Spiro A, Buttriss JL. 2014. Vitamin D: An overview of vitamin D status and intake in Europe. Nutr Bull. 39(4):322–350.
- Thomas SD, Need AG, Nordin BE. 2010. Suppression of C-terminal telopeptide in hypovitaminosis D requires calcium as well as vitamin D. Calcif Tissue Int. 86(5):367–374.
- Wang TJ, Zhang F, Richards JB, Kestenbaum B, van Meurs JB, Berry D, Kiel DP, Streeten EA, Ohlsson C, Koller DL, et al. 2010. Common genetic determinants of vitamin D insufficiency: a genome-wide association study. Lancet. 376(9736):180–188.
- Waterhouse Tran B, Armstrong BK, Baxter C, Ebeling PR, English DR, Gebski V, Hill C, Kimlin MG, Lucas RM, et al. 2014. Environmental, personal, and genetic determinants of response to Vitamin D supplementation in older adults. J Clin Endocrinol Metab. 99(7):E1332–1340.
- Weir RR, Johnston M, Lowis C, Fearon AM, Stewart S, Strain JJ, Pourshahidi LK. 2021. Vitamin D3 content of cows’ milk produced in Northern Ireland and its efficacy as a vehicle for vitamin D fortification: a UK model. Int J Food Sci Nutr. 72(4):447–455.