
Abstract
We investigated the gastrointestinal (GI) tolerance of soluble corn fibre (SCF) compared with inulin in children 3–9 years old. SCF (3–8 g/d for 10d) was tolerated as well as inulin: no differences were identified in stool frequency and consistency, proportion of subjects with at least one loose stool or reporting symptoms during bowel movement. Compared to inulin, 6 g/d of SCF lowered gas severity in children aged 3–5 years old. No differences were noted for alpha and beta diversity, relative abundance of Bacteroidota, Firmicutes, Ruminococcaceae, or the Firmicutes to Bacteroidota ratio. Relative abundance of some specific strains (i.e. Anaerostipes, Bifidobacterium, Fusicatenibacter, Parabacteroides) varied depending on the fibre type and dose level. Fortification at a level of 6–8 g/d of SCF and/or inulin could help addressing the fibre gap without any GI discomfort.
Introduction
Dietary fibre is an important macronutrient that has been shown to provide a series of health benefits including supporting gastrointestinal (GI) function and motility, increasing the viability and diversity of the gut microbiota, improving colonic, cardiovascular, and metabolic health, and promoting immune health, among others (Reynold et al. 2019; Barber et al. Citation2020; Venter et al. Citation2022). In both children and adults, dietary fibre can support normal GI function and maintenance of blood glucose levels, reducing future risk of cardiovascular disease and type II diabetes (Anderson et al. Citation2009). Increasing fibre intake in children has also been associated with an overall healthier diet quality, including higher intakes of certain vitamins and minerals and lower intake of saturated fats and energy (Hampl et al. Citation1998; Finn et al. Citation2019). In the light of these health benefits, the National Academy of Medicine established an adequate intake for fibre as 19 g/d for children between 1 and 3 years old and 25 g/d for children between 4 and 8 years old (Trumbo et al. Citation2002). Similarly, most countries in Europe recommend a daily intake of dietary fibre of 10–21 g/d for children, depending on the age group considered (EFSA Citation2017). Currently, however, a fibre gap exists with average intakes across the globe, and in particular among children, being well-below the recommended amounts (Stephen et al. Citation2017). For instance, the mean fibre intake of U.S. children is 12.4 g/d and 11.8 g/d for boys and girls aged 2–5 years old and 14.9 g/d and 14.6 g/d for boys and girls aged 6–11 years old, respectively (U.S. Department of Agriculture, Agricultural Research Service Citation2020). In addition to fibre-rich foods such as whole grains, fruits, and vegetables, foods enriched with added fibres are also important contributors to dietary fibre intakes and positive health outcomes. A recent modelling study in the United Kingdom showed, in fact, how fibre fortification would enable 50% more adults and more than double the number of children to reach the daily recommended fibre recommendations, as well as have a significant reduction in the risk of developing type II diabetes and cardiovascular disease in the next 10 years (Canene-Adams et al. Citation2022). The market is indeed responding to this, with global launches of children food products with added fibre showing how these ingredients are rising, often accompanied by functional claims.
Fibre is indeed beneficial to health, but some individuals could be potentially affected by GI side effects such as bloating, borborygmi (intestinal noises), cramping, flatulence, and diarrhoea, particularly if the fibre is consumed at high doses (Eswaran et al. Citation2013). These effects vary greatly depending on the type of fibre and are primarily due to the production of gases by microbial fermentation, as well as the water-binding effects in the large intestine. More specifically, smaller chain fibres are more rapidly fermented, and are thus more likely to cause flatulence, bloating and laxative effects or diarrhoea. Longer chain fibres, on the other hand, ferment more slowly and are usually better tolerated (Housez et al. Citation2012).
Soluble corn fibre (SCF) is one example of a long-chain fibre that is not digested in the stomach or small intestine, passing intact to the colon where it stimulates the growth or activity of specific beneficial bacteria, which then produce short-chain fatty acids by fermenting it (Kendall et al. Citation2008; Vester Boler et al. Citation2011; Konings et al. Citation2014; Whisner et al. Citation2014; Van Hul et al. Citation2020). In addition, SCF also increases faecal wet weight which can contribute to laxation (Timm et al. Citation2013). Based on both in vitro data of the Simulator of the Human Intestinal Microbial Ecosystem (SHIME®) (Molly et al. Citation1994) and human clinical studies, SCF is well tolerated in adults. In particular, there are no clinically relevant symptoms when SCF is consumed up to 65 g/d throughout the day or up to a 40 g bolus (Stewart et al. Citation2010; Vester Boler et al. Citation2011; Housez et al. Citation2012; Karalus et al. Citation2012; Klosterbuer et al. Citation2013). Unfortunately, no tolerance studies of SCF have been conducted in children <12 years old so far, even though this fibre is commonly added to several food products, including ones targeted at children.
On the other side, several tolerance studies of shorter-chain fibres, such as inulin and fructooligosaccharides (FOS), demonstrate mild GI side effects already at intakes of 10–15 g/day with most adult individuals experiencing some side effects (Carabin and Flamm Citation1999; Coussement Citation1999; Roberfroid Citation2005). If intakes are then increased to ≥20 g/day, most adult individuals experienced moderate to severe GI side effects, although such symptoms are usually transient (Housez et al. Citation2012). Thus, increasing fibre intake to meet the fibre gap using only inulin or FOS might prove difficult considering their impact on GI tolerance. Studies in children supplemented with a specific FOS enriched inulin show how the product is tolerated at doses of 6 g/day in 3–6-year-olds (Lohner et al. Citation2018) and 8 g/day in 7–12-year-olds (Hume et al. Citation2017). Besides the above-mentioned studies; however, trials in children remain limited for this ingredient as well.
Given the shortfall in fibre intakes in children, an increase in newly-launched food products with added fibres targeted to children, and the overall lack of tolerance studies of fibres in children, the primary objective of this study was to compare the effects of consuming SCF with that of inulin, a fibre commonly used for fibre fortification, on GI tolerance in healthy children aged 3–9 years old using the composite GI symptom score as the primary outcome variable. The secondary objectives were to compare the effects of high versus low doses of SCF on GI composite score, effects on stool frequency, stool consistency, straining, discomfort and sensation of incomplete evacuation and faecal microbiome compared to inulin.
Materials and methods
Ethical approval
This study was registered as a clinical trial (http://clinicaltrials.gov; ID: NCT05213494) and was conducted according to the Good Clinical Practice (GCP) Guidelines, the Declaration of Helsinki, and the US Code of Federal Regulations (CFR) 21. The initial study protocol was approved by the Institutional Review Board (IRB) at Advarra, Inc. (Columbia, MD) on 13 May 2021, prior to study commencement and subject recruitment. Advarra, Inc. is fully accredited by the Association for the Accreditation of Human Research Participation Protection Programs (AAHRPP). Signed written informed consent for participation in the study was obtained from all subjects or guardians before protocol-specific procedures were carried out. Subjects were informed of their right to withdraw from the study at any time.
Participants
Forty-four healthy children between 3 and 9 years old were recruited from the Chicagoland area through advertisements in the community. Inclusion criteria were as follows: potty trained (to avoid diaper use), bowel movement at least every other day, a regular consumer of breakfast, willing to maintain physical activity level and habitual diet, and willing to refrain from certain medications and supplements. Exclusion criteria were as follows: regular (>2/week) moderate to severe GI symptoms, any GI conditions that would interfere with the evaluation of the study product, any allergies to food or ingredients, recent history of acute GI illness such as nausea/vomiting or diarrhoea, history of constipation or diarrhoea, uncontrolled hypertension, extreme dietary habits or inclination to GI intolerance based on regularly having moderate to severe GI reactions to common foods (determined using an in-house diet screening questionnaire), history of cancer, recent major trauma or surgery, signs of active infection, weight loss or gain >4.5 kg in the 3 months prior to baseline, antibiotic, steroid, or anti-inflammatory use, use of medications or dietary supplements known to influence GI function, and use of allergy medication. Habitual diet and lifestyle were maintained while limiting consumption of new foods and abstaining from foods that were known to result in moderate to severe GI symptoms in the individual subjects during the 2 days prior to the start of study product consumption and during the 10 days of study product consumption. Subjects avoided pre- and probiotic supplements and beverages or food products with added pre- or probiotics (including fibre) throughout the study.
Study design
The study was a randomised, controlled, crossover, single-centre trial, consisting of 4 test periods whereby each test period included one test visit and 10 days of study product consumption (). Participants consumed a low and high dose of SCF (LSCF and HSCF, respectively) or inulin (LI and HI, respectively), based on age (). These doses were chosen based on the differences in requirements and intakes for younger and older children in the age range of 3–9 years old. Specifically, a high-dose of 6 g/d was chosen for children aged 3–5 years based on a study by Lohner et al. (Citation2018) demonstrating that a FOS-enriched inulin provided at this dose to children aged 3–6 years was well tolerated. Half of this dose (i.e. 3 g/d) was selected as the low-dose for this age group. The high dose of 6 g/d is also in the low range of the fibre gap in this age group in the U.S. (NHANES 2017–2018). A study in older children suggests that a FOS-enriched inulin provided at 8 g/d was well tolerated in 7–12-year-olds (Hume et al. Citation2017). Taking this into consideration, in addition to estimations that children aged 6–11 years are on average 10 g/d short of the recommended daily fibre intakes (U.S. Department of Agriculture, Agricultural Research Service Citation2020), a high-dose of 8 g/d was chosen for children aged 6–9 years and 5 g/d was assigned as the low-dose amount. Such values are also representative of food product fortification practices, as 2.8 g and 5.6 g fibre presence in foods represent FDA claims for “good source” and “excellent source” of fibre, respectively (FDA Citation2022).
Figure 1. Study design.
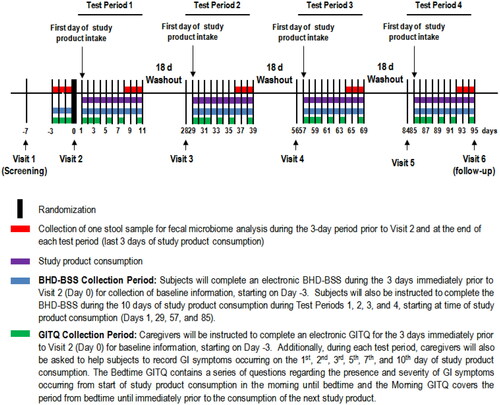
Table 1. Test products.
During the 10 days of the study product consumption, GI symptoms were collected for 7 days, bowel habits data were collected for 10 days, and one faecal sample was collected for microbiome analysis. According to current best practices for studies on the intestinal microbiome, a minimum washout of 14 days is suggested to allow the gut microbiota to return to its initial composition (Klurfeld et al. Citation2018). Thus, each test period was separated by at least 18 days. A statistician generated a randomisation sequence stratified by age group (3–5 years, 6–9 years) using a balanced uniform crossover design, following the Williams’ Design. The sequence was uploaded onto the electronic case report form (eCRF) platform. When a subject was determined to be eligible for the study, a randomisation number and associated test period sequence were assigned to the subject through the randomisation module of the eCRF platform.
Study products
Study products were SCF (PROMITOR® Soluble Corn Fibre 85 A, Tate & Lyle ingredients, Decatur, IL) and inulin (Frutafit® HD, Sensus). The fibre was provided as a white, unflavoured, soluble powder. Caregivers were instructed to thoroughly mix the study products into a beverage (e.g. juice, milk, or water) prior to providing it to their child with their usual breakfast. In the event the study product was not consumed with breakfast, the study product was consumed no later than 4:30 pm with a snack or meal (e.g. lunch). Subjects were encouraged to consume the entire beverage containing the study product to ensure that the full serving amount was consumed. Caregivers recorded the time of study product consumption in an electronic study product diary during each test period. Compliance was assessed at the end of each 10 day test period by the counting of returned unused products, calculated as ((number of study product dispensed – number of unused study products returned)/10)×100%. Caregivers recorded the time of study product consumption in an electronic Study Product Diary during each test period to encourage compliance. Satisfactory compliance was defined as product intake between 80% and 120%.
Gastrointestinal tolerance questionnaire (GITQ)
Participants and caregivers completed a GI symptom questionnaire in the morning (Morning GITQ) and at bedtime (Bedtime GITQ) to capture GI symptoms during the 3–24-hour periods prior to the Baseline Visit and on Days 1,2,3,5,7, and 10 of study product consumption. The electronic Morning GITQ contained a series of questions regarding the presence and severity of GI symptoms occurring from bedtime until immediately prior to the consumption of the study product the next morning. The electronic Bedtime GITQ contained a series of questions regarding the presence and severity of GI symptoms occurring from the start of study product consumption in the morning until bedtime. Individual GI symptoms included: flatulence, abdominal cramping, bloating, stomach rumbling, burping, and nausea and their severity were ranked on a 4-point scale ranging from 0 (no symptoms) to 3 (severe). The Bedtime and Morning GITQ were adapted from Vester Boler et al. (Citation2011) and modified based on tolerance studies in generally healthy children (Jacqz-Aigrain et al. Citation2015; Closa-Monasterolo et al. Citation2017; Lohner et al. Citation2018; Paruzynski et al. Citation2020). To the best of our knowledge, there is no standard questionnaire for the subjective assessment of GI symptoms in relation to fibre consumption in generally healthy adults or children (Grabitske and Slavin Citation2009). Validated paediatric GI symptom questionnaires, such as the PedsQL™ Gastrointestinal Symptom Scale (Varni et al. Citation2014) and the Questionnaire on Paediatric Gastrointestinal Symptoms (Caplan et al. Citation2005) are available. However, these questionnaires are lengthy (74 and 83 questions, respectively) and have mostly been used to identify GI diseases/disorders and not to assess the effects of dietary intervention on GI tolerance. Tolerance research studies in healthy children (Jacqz-Aigrain et al. Citation2015; Paruzynski et al. Citation2020) do not generally use any specialised paediatric questionnaires, but instead have parents fill in questionnaires that were used for adults. The composite score of GI tolerance was determined as the sum of the 6 individual GI symptoms scores and had a range from 0 (no issue on any symptom) to 18 (severe issues on all measured symptoms) (based on the Wong-Baker FACES® Pain Rating Scale, available at www.wongbkerfaces.org). Parents were provided “child-friendly” language to use when querying their children about potential GI symptoms.
Bowel habits diary with Bristol stool scale (BHD-BSS)
Caregivers helped subjects to complete an electronic BHD-BSS during the 3 days immediately prior to Baseline Visit for collection of baseline information and every day during the 10 days of study product consumption during each test period. Straining, discomfort during bowel movement, and any sensation of incomplete evacuation were rated on a scale of 0 (none) to 3 (severe) by showing children a series of 3 corresponding faces depicting the presence or absence of discomfort or pain (also based on the Wong-Baker FACES® Pain Rating Scale, available at www.wongbkerfaces.org). Stool frequency was noted, and consistency was rated (1–7) over 3 days by caregivers using a provided Bristol Stool Chart (Lewis and Heaton Citation1997). If bowel movement occurred while the subject was not near the caregiver (e.g. when subject was at school), the caregivers recorded the time of the bowel movement as best as possible, but did not complete any other details (e.g. straining, consistency, etc.) about that bowel movement.
Faecal sample collection
Faecal samples were collected using Omnigene®-GUT DNA Genotek per manufacturer’s instructions for gut microbiome analyses (accessible at https://www.dnagenotek.com/us/products/collection-microbiome/omnigene-gut/OMR-200.html). Caregivers collected one faecal sample from one bowel movement per subject, using Omnigene®-GUT DNA Genotek during the 3-day periods immediately prior to Baseline Visit and during the final 3 days of each 10-d study product consumption period. If the subject was unable to provide a faecal sample during these collection periods, caregivers were instructed to contact the clinic for further instructions. Faecal samples were collected using the provided stool collection kit as instructed by study staff. The time and date when the faecal sample we collected were recorded. The collected stool samples were analysed for microbiome composition and diversity using 16S rRNA sequencing at the University of Wisconsin Biotechnology Centre.
Bioinformatics analysis
Microbiome analysis was performed using Quantitative Insights into Microbial Ecology (QIIME2) version 2 (Bolyen et al. Citation2019). Illumina sequencing reads were denoised and quality filtered using the denoising program DADA2 (Callahan et al. Citation2016). Sequence variants were aligned and masked using Mafft (Katoh et al. Citation2002) and the phylogenetic tree of the Amplican sequence variant (ASV’s) was created using FastTree (Price et al. Citation2009). Taxonomy was assigned using Bayesian classifier based on a pretrained silva database curated to the 16 s rRNA amplicon region. Alpha rarefaction curves using Shannon, Simpson and observed were calculated for all samples with a rarefaction upper limit of median depth/sample count and the alpha diversity between different treatments were compared using the Wilcoxon rank sum test. Samples were removed from further characterisation if they did not contain sufficient reads. Beta diversity was calculated, and ordination plots were generated using Bray-Curtis and Jaccard (Non-Phylogenetic), weighted and unweighted Unifrac (Phylogenetic) on ASV data levelled according to the lowest sample depth.
All possible pairwise comparisons were made between groups for the most abundant genus as well as a pre-specified list of bacteria genus and family selected based on previous studies on soluble corn fibre (Maathuis et al. Citation2009; Vester Boler et al. Citation2011; Whisner et al. Citation2014; Costabile et al. Citation2016; Whisner et al. Citation2016; Costabile et al. Citation2017). Additionally, a linear mixed model was used to evaluate the phylum level Operational Taxonomic Unit’s (OTU) for Bacteroidata, Firmicutes, and Firmicutes/Bacteroidata ratio (ratio of relative abundance of Firmicutes divided by the relative abundance of Bacteroides), as well as the alpha diversity measures. The model contained fixed effect terms for product, age stratification, and baseline/pre-intervention values. A random intercept for the subject nested within sequence was also included. The within subject difference was calculated and the Wilcoxon signed rank test (non-parametric version of the t-test) was used. False discovery rate adjustment (q-value) was used to adjust for multiple testing. A heatmap of the q-values was created and if significant (q < 0.05) for at least one comparison the phylotype was analysed with a linear mixed model.
Statistical analysis
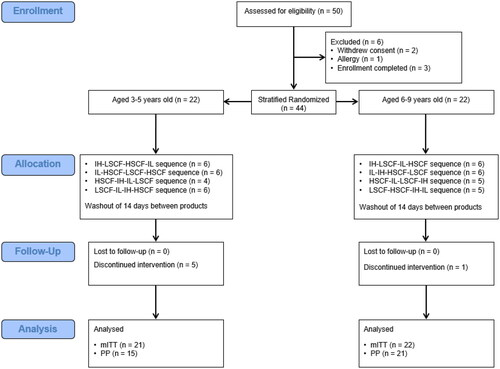
All statistical analyses were conducted according to the statistical analysis plan (SAP) using SAS for Windows (version 9.4, Cary, NC) and/or R 3.3.1 (R Core Team Citation2013). All tests of significance are two-sided and considered significant at the 0.05 level unless otherwise stated. Rank-based and log transformations were used if assumptions were violated for any continuous outcome model. A sample of 36 participants was expected to provide 80% power at a two-sided 0.05 significance level to detect a moderate effect size of 0.05 between paired groups. A sample of 44 subjects, 22 in each age group, was randomised to allow for attrition and non-compliance (). The primary analysis was based on the modified intent-to-treat (mITT) population, which included all subjects randomised in the study who provided at least one outcome data point. Since very few differences were identified between mITT and per protocol (PP) population results, only the mITT findings are provided.
Figure 2. Disposition of study participants.
Gastrointestinal tolerance and bowel habits
A linear mixed model was used to assess differences among test products for the continuous GI tolerance outcome variables, i.e. composite area under the curve (AUC), burping AUC, and gas AUC and stool consistency (BSS). A generalised linear mixed model was used to assess the difference in the proportion of subjects with the presence of GI symptoms following a binomial distribution with a logit link. Stool frequency (number of bowel movements over 10-day intervention) was analysed with a generalised linear mixed model (GLMM) following a Poisson distribution and with a log link. For all models, the initial model contained terms for test product, test period, and age stratification where the subject nested within the test sequence was included as the random effect. If the fixed effect for the period was not significant, it was removed from the model. The pre-specified pairwise comparisons (i.e. SCF vs. inulin within each dose and each dose within SCF) were estimated along with the corresponding 95% confidence. A post hoc analysis was conducted to explore the within product change from pre-intervention (i.e. baseline) to on-intervention for the bowel habits diary outcomes as well as GITQ outcomes. Within group changes were tested with the Wilcoxon signed rank test.
Results
Subject characteristics
Of the 50 who were assessed for eligibility, 44 were stratified and randomised. The PP consisted of 36 subjects which excluded those who early terminated due to reasons unrelated to the intervention (n = 6) and due to unrelated adverse events, that could interfere with GI symptom interpretation (i.e. antibiotics) (n = 2). The mITT consisted of 43 of the 44 randomised subject whereby one subject was excluded due to not providing at least one outcome data point. Selected subject demographic and anthropometric measures at screening for the mITT population are shown in .
Table 2. Selected subject demographic and anthropometric measures at screening for the mITT population.
Gastrointestinal tolerance
Overall, the AUC for the composite GI symptom score ranged from 0 to 62.5 across products. There were no statistically significant differences in the AUC for the composite GI symptom score comparing LI vs. LSCF, HI vs. HSCF, or LSCF vs. HSCF, when analysed either as a whole (p = 0.23, 0.37, and 0.47, respectively) or by age group (p = 0.57. 0.11, and 0.25 for 3–5 years and p = 0.26, 0.79, and 0.93 for 6–9 years, respectively) (). Post hoc analysis for within group change from baseline indicate that the maximum composite GI symptom score was significantly different from baseline for both dose levels for both SCF and inulin. However, the median change is 0 for all groups, suggesting that the change from baseline is likely not meaningful.
Table 3. Area under the curve (AUC) for the composite GI symptom score for the mITT populationa.
Table 4. Area under the curve (AUC) for the composite GI symptom score for the mITT population by age groupa.
Individual GI symptoms
A difference was identified in the flatulence AUC between HSCF and HI, with HSCF exhibiting lower symptom severity (p = 0.01; Supplementary Material, Table S1). Nausea was not analysed due to the low occurrence of the symptom and no other differences were identified. Analysis of each of the age groups also revealed lower flatulence symptom severity for HSCF, compared to HI, in the 3–5-year-olds (p < 0.01; Supplementary Material, Table S2). No significant differences were detected for other symptoms or in the 6–9-year-olds. Post-hoc analysis for within-group change from baseline indicate that the maximum cramping severity score was significantly different from baseline for the HSCF and HI groups. Additionally, flatulence severity was significantly different from baseline for the HSCF and LSCF as well as the HI groups. However, for these symptoms, the median change is 0, suggesting that the difference from baseline is likely not meaningful.
There were no significant differences in stool frequency comparing LI vs. LSCF, HI vs. HSCF, or LSCF vs. HSCF, when analysed either as a whole (p = 0.96, 0.48, and 0.89, respectively; Supplementary Material, Table S3) or by age group (p = 0.61, 0.16, and 0.49 for 3–5 years and 0.79, 0.69, and 0.29 for 6–9 years, respectively; Supplementary Material, Table S4). Similarly, stool consistency did not differ when comparing LI vs. LSCF, HI vs. HSCF, or LSCF vs. HSCF, when analysed either as a whole (p = 0.59, 0.71, and 0.41, respectively; Supplementary Material, Table S5) or by age group (p = 0.26, 0.29, and 0.43 for 3–5 years and p = 0.08, p = 0.13, and 0.06 for 6–9 years, respectively; Supplementary Material, Table S6). Post-hoc analysis for within group change from baseline indicate that stool consistency is significantly different from baseline for both dose levels for both the SCF and inulin groups. However, on average, the change in consistency score is <1, suggesting that this change is likely not meaningful.
There were no significant differences between the proportion of subjects reporting symptoms during bowel movement (i.e. discomfort, incomplete evacuation, and straining). Post-hoc analysis for within group change from baseline indicate that straining is significantly different from baseline at both dose levels for both the SCF and inulin groups. However, the median change is 0 for all groups, suggesting that this change is likely not meaningful.
Gut microbiome
Overall, no significant differences were detected between groups (Supplementary Material, Table S7) or within age groups (Supplementary Material, Figure S8) in the alpha diversity indices (all P-values > 0.05). Additionally, there was no significant separation by study product or age group in beta diversity (Supplementary Material, Figure S9). Similarly, no significant differences were detected between study groups in Bacteroidota, Firmicutes, or the Firmicutes to Bacteroidota ratio (all P-values > 0.05; Supplementary Material, Table S10).
Specific bacterial phylotypes
The false-discovery rate-adjusted Wilcoxon signed rank test for paired differences between groups for the genus or family of pre-specified list of bacteria based on previous publications on soluble corn fibre, as well as genus for the most abundant bacteria with at least one significant within- or between-group differences for the mITT population, is shown in the Supplementary Material (Figure S11). Those with at least one significant (q < 0.05) comparison were further analysed with linear mixed models. The corresponding model estimates and pairwise comparisons of five selected bacterial phylotypes for the mITT population for all subjects are shown in ). For Anaerostipes, a significant difference was detected between HSCF and HI groups and between the LSCF and LI groups, whereby the abundance was estimated to be lower for both low- and high-dose SCF groups, compared to the inulin groups. For Bifidobacterium, a significant difference between products was detected for the high dose, whereby relative abundance was lower in the SCF group compared to the inulin group. For Fusicatenibacter, a significant difference was detected for the HSCF group compared to the HI group, whereby the relative abundance was higher for the SCF group. Additionally, the relative abundance was higher for the HSCF group compared to the LSCF group. For Parabacteroides, a significant difference was detected between the LSCF and the LI groups and between the HSCF and the HDI groups, whereby the relative abundance was higher for both the LSCF and HSCF groups. No significant difference between products for Ruminococcaceae was indicated (p > 0.05). The same effect appeared to be consistent in each age group.
Table 5. Model derived estimates of selected bacterial phylotypes for the mITT population.
Discussion
The average dietary fibre intake for children aged 2–11 years old in the U.S. of 12–15 g/d falls well below the recommended range of 19–25 g/d (Trumbo et al. Citation2002; U.S. Department of Agriculture, Agricultural Research Service Citation2020). It is therefore paramount that measures are taken to increase dietary fibre consumption in children to ensure proper growth, development, and nutritional adequacy. While it is recommended that dietary fibre is increased through consumption of whole foods such as fruits, vegetables, whole grains, and legumes, this is not always possible due to children’s eating patterns and the amount of food required to be consumed to meet the recommendations. Fortifying commonly consumed foods with fibre is a viable option to increase dietary fibre intake (Canene-Adams et al. Citation2022).
However, increasing fibre intake too quickly can result in GI distress. Fibre tolerance also differs with the type of fibre, mostly because of the speed and location of the fermentation that happens in the intestine. It is therefore important to understand the tolerance levels of individual fibres when considering fortification. We found that consumption of SCF providing 3 to 8 g fibre once per day was as well tolerated as inulin. For the most part, children reported no GI symptoms and, if any were present, these symptoms were mostly mild. There were also no differences in the AUC for individual GI symptoms (except for gas), stool frequency during the 10-day intervention periods, stool consistency, the proportion of subjects with at least one loose stool (BSS score of 6 or 7) or the proportion of subjects reporting symptoms during a bowel movement (i.e. discomfort, incomplete evacuation, and straining) during the 10-day intervention periods. Additionally, compared to consumption of 6 g/day of fibre from inulin, consumption of SCF providing the same amount of fibre resulted in lower gas severity in children aged 3 to 5 years. These results are consistent with previous studies on inulin and children (Lohner Citation2018), demonstrating that a FOS-enriched inulin provided at 6 g/d to children aged 3–6 years was well tolerated. A study in older children suggested that FOS-enriched inulin provided at 8 g/d was also well-tolerated in 7–12-year-olds (Hume Citation2017). Previous studies on SCF consumption in adolescents have shown that a daily intake of up to 12 g is well tolerated. A dose-response study in females aged 12–14 years old found that all GI symptoms were minimal after 4 weeks of either 10 g or 20 g of soluble corn fibre given in 2 doses per day for 4 weeks (Whisner Citation2016). A second study in adolescents found no significant differences in symptom severity between the control (0 g of fibre) and 12 g of soluble corn fibre over an 18-day treatment period. Previous studies in adults have found SCF tolerable at acute doses of up to 40 g or doses up to 65 g spread throughout the day (Housez et al. Citation2012). Inulin, on the other hand, is tolerable up to acute doses of 20 g per day (Carabin and Flamm Citation1999). This can be due to the difference in fermentation location and speed, as SCF is fermented slowly throughout the length of the large intestine, while inulin is fermented more quickly and primarily in the ascending colon (Wallace et al. Citation2017). Therefore, depending on the target food/beverage product and on the inclusion levels, fortification of SCF could be preferred to inulin, especially at higher amounts. In other cases, a combination of the two fibres, could prove more of an efficient strategy to address the fibre gap in children, resulting in beneficial effects while avoiding any potential GI discomfort, depending also on the functional aspects that the different fibres can offer, such as viscosity and mouthfeel.
A secondary outcome of this study was to evaluate the effects of SCF at two doses, and compare it to inulin, on faecal microbiota. Our analysis revealed no differences between dose levels, fibre type or by age groups for alpha diversity, beta diversity, relative abundance of Bacteroidota, Firmicutes, or the Firmicutes to Bacteroidota ratio. Some specific bacterial phylotypes that are dominant in the paediatric gut microbiome (Deering et al. Citation2019), however, changed their relative abundance, depending on fibre dose/type. In particular, the relative abundance of Anaerostipes and Bifidobacterium were lower following the high-dose SCF compared to high-dose inulin, while those for Fusicatenibacter and Parabacteroides were higher for the high-dose SCF group, compared to the high-dose inulin group. Relative abundance for Anaerostipes was also lower for the low-dose SCF group compared to the low-dose inulin, and that of Parabacteroides was higher for the low-dose SCF group compared to the low-dose inulin group. Only Fusicatenibacter was affected by the dose level of SCF, whereby the relative abundance was higher for the high-dose SCF group compared to the low-dose SCF group. These results are in line with previous studies examining the effect of SCF on faecal bacterial changes, which found that the relative abundance of Parabacteroides differed before and after consumption of 10 g and 20 g of soluble corn fibre for 4 weeks, together with increases in the abundance of Ruminococcus at 10 g of SCF verse 0 g of fibre, in the amount of Bacteroides over time at the 20 g dose of SCF and in the amounts of Parabacteroides and Ruminococcaceae in adolescents after 18 days of consumption of 12 g of SCF (Whisner et al. Citation2014). Although an increase in specific bacterial phylotypes cannot in itself be regarded as a health benefit, we note that increases in some of the above-mentioned bacteria (e.g. Bifidobacterium, Firmicutes, and Ruminococcaceae) have been associated with health benefits including promoting physiological health, facilitating nutrient absorption, and lowering the risk of weight gain (Menni et al. Citation2017). Indeed, healthy eating, fibre in particular, has been tightly linked to the presence or absence of disease, in strong connection and interaction with the gut microbiome (Armet et al. Citation2022).
Conclusion
Both national and international authorities have been long calling to increase fibre intake, especially in children, in light of the numerous health benefits of this macronutrient. Despite this, dietary survey data show how fibre intakes fall well-below the recommendations. In addition, very few countries provide guidance on the types of fibre that are preferable to achieve such recommended intakes. Such information is however very important to communicate, as a sudden increase in fibre intake, especially of the kind that is not that well-tolerated, could lead to GI distress. Indeed, food manufacturers are responding to this call by reformulating and bringing new products fortified with different kinds of fibres, in particular the ones tailored for children. This new research shows that fibre fortification at a level of 6–8 g/d of SCF and/or inulin (with SCF lowering gas severity in children aged 3–5 years old compared to inulin), could help close the fibre gap in children without any GI concerns. Future studies should further investigate the effects of SCF and inulin on GI tolerance and gut microbiome of children at different dosages, while examining their acute and chronic impact on overall host health, as our fibre supplementations were only provided for 10 days.
Author contribution
Conceptualisation, MK, KK, EM, TMB, LD; methodology, MK, KK, EM, TMB, LD; formal analysis, EM, TMB, LD; investigation, EM, TMB, LD; resources, KK; data curation, EM, TMB, LD, DR, MK, IL; writing—original draft preparation, MK; writing—review and editing, DR, IL, KK; visualisation, EM, DR; supervision, KK; project administration, MK, DR; funding acquisition, KK. All authors have read and agreed to the published version of the manuscript.
Supplemental Material
Download PDF (1.5 MB)Disclosure statement
DR, MK, IL, and KK are Tate & Lyle employees and contributed to the study design, data interpretation, to write the manuscript and in the decision to publish the results.
Data availability statement
The data presented in this study are available in the article or in the supplementary material.
Additional information
Funding
References
- Anderson JW, Baird P, Davis RH, Jr, Ferreri S, Knudtson M, Koraym A, Waters V, Williams CL. 2009. Health benefits of dietary fibre. Nutr Rev. 67(4):188–205.
- Arboleya S, Watkins C, Stanton C, Ross RP. 2016. Gut Bifidobacteria populations in human health and aging. Front Microbiol. 7:1204.
- Armet AM, Deehan EC, O’Sullivan AF, Mota JF, Field CJ, Prado CM, Lucey AJ, Walter J. 2022. Rethinking healthy eating in light of the gut microbiome. Cell Host Microbe. 30(6):764–785.
- Barber TM, Kabisch S, Pfeiffer AFH, Weickert MO. 2020. The health benefits of dietary fibre. Nutrients. 12(10):3209.
- Bolyen E, Rideout JR, Dillon MR, Bokulich NA, Abnet CC, Al-Ghalith GA, Alexander H, Alm EJ, Arumugam M, Asnicar F, et al. 2019. Reproducible, interactive, scalable and extensible microbiome data science using QIIME 2. Nat Biotechnol. 37(8):852–857.
- Callahan BJ, McMurdie PJ, Rosen MJ, Han AW, Johnson AJ, Holmes SP. 2016. DADA2: High-resolution sample inference from Illumina amplicon data. Nat Methods. 13(7):581–583.
- Canene-Adams K, Laurie I, Karnik K, Flynn B, Goodwin W, Pigat S. 2022. Estimating the potential public health impact of fibre enrichment: a UK modelling study. Br J Nutr. 7:1–7.
- Caplan A, Walker L, Rasquin A. 2005. Development and preliminary validation of the questionnaire on pediatric gastrointestinal symptoms to assess functional gastrointestinal disorders in children and adolescents. J Pediatr Gastroenterol Nutr. 41(3):296–304.
- Carabin IG, Flamm WG. 1999. Evaluation of safety of inulin and oligofructose as dietary fibre. Regul Toxicol Pharmacol. 30(3):268–282.
- Closa-Monasterolo R, Ferré N, Castillejo-DeVillasante G, Luque V, Gispert-Llaurado M, Zaragoza-Jordana M, Theis S, Escribano J. 2017. The use of inulin-type fructans improves stool consistency in constipated children. A randomised clinical trial: pilot study. Int J Food Sci Nutr. 68(5):587–594.
- Costabile A, Bergillos-Meca T, Rasinkangas P, Korpela K, de Vos WM, Gibson GR. 2017. Effects of soluble Corn Fiber alone or in synbiotic combination with Lactobacillus rhamnosus GG and the pilus-deficient derivative GG-PB12 on Fecal Microbiota, metabolism, and markers of immune function: a randomized, double-blind, placebo-controlled, crossover study in healthy elderly (Saimes Study). Front Immunol. 8:1443.
- Coussement PA. 1999. Inulin and oligofructose: safe intakes and legal status. J Nutr. 129(7 Suppl):1412S-7S.
- Costabile A, Deaville ER, Morales AM, Gibson GR. 2016. Prebiotic potential of a maize-based soluble fibre and impact of dose on the human gut microbiota. PLoS One. 11(1):e0144457.
- Deering KE, Devine A, O’Sullivan TA, Lo J, Boyce MC, Christophersen CT. 2019. Characterizing the Composition of the Pediatric Gut Microbiome: a systematic review. Nutrients. 12(1):16.
- Eswaran S, Muir J, Chey WD. 2013. Fibre and functional gastrointestinal disorders. Am J Gastroenterol. 108(5):718–727.
- European Food Safety Authority (EFSA). 2017. Dietary reference values for nutrients Summary report. EFSA Supporting Publications, 14(12).
- Finn K, Jacquier E, Kineman B, Storm H, Carvalho R. 2019. Nutrient intakes and sources of fibre among children with low and high dietary fibre intake: the 2016 feeding infants and toddlers study (FITS), a cross-sectional survey. BMC Pediatr. 19(1):446.
- Food and Drug Administration (FDA). 2022. Code of Federal Regulations Title 21.101.54. Available from: CFR – Code of Federal Regulations Title 21 (fda.gov). Accessed August 8th 2022.
- Grabitske HA, Slavin JL. 2009. Gastrointestinal effects of low-digestible carbohydrates. Crit Rev Food Sci Nutr. 49(4):327–360.
- Hampl JS, Betts NM, Benes BA. 1998. The ‘age + 5’ rule: comparisons of dietary fibre intake among 4- to 10-year-old children. J Am Diet Assoc. 98(12):1418–1423.
- Housez B, Cazaubiel M, Vergara C, Bard JM, Adam A, Einerhand A, Samuel P. 2012. Evaluation of digestive tolerance of a soluble corn fibre. J Hum Nutr Diet. 25(5):488–496.
- Hume MP, Nicolucci AC, Reimer RA. 2017. Prebiotic supplementation improves appetite control in children with overweight and obesity: a randomized controlled trial. Am J Clin Nutr. 105(4):790–799.
- Jacqz-Aigrain E, Kassai B, Cornu C, Cazaubiel JM, Housez B, Cazaubiel M, Prével JM, Bell M, Boileau A, de Cock P. 2015. Gastrointestinal tolerance of erythritol-containing beverage in young children: a double-blind, randomised controlled trial. Eur J Clin Nutr. 69(6):746–751.
- Karalus M, Clark M, Greaves KA, Thomas W, Vickers Z, Kuyama M, Slavin J. 2012. Fermentable fibres do not affect satiety or food intake by women who do not practice restrained eating. J Acad Nutr Diet. 112(9):1356–1362.
- Katoh K, Misawa K, Kuma K, Miyata T. 2002. MAFFT: a novel method for rapid multiple sequence alignment based on fast Fourier transform. Nucleic Acids Res. 30(14):3059–3066.
- Kendall CW, Esfahani A, Hoffman AJ, Evans A, Sanders LM, Josse AR, Vidgen E, Potter SM. 2008. Effect of novel maize-based dietary fibres on postprandial glycemia and insulinemia. J Am Coll Nutr. 27(6):711–718.
- Klosterbuer AS, Hullar MA, Li F, Traylor E, Lampe JW, Thomas W, Slavin JL. 2013. Gastrointestinal effects of resistant starch, soluble maize fibre and pullulan in healthy adults. Br J Nutr. 110(6):1068–1074.
- Klurfeld DM, Davis CD, Karp RW, Allen-Vercoe E, Chang EB, Chassaing B, Fahey GC, Jr, Hamaker BR, Holscher HD, Lampe JW, et al. 2018. Considerations for best practices in studies of fibre or other dietary components and the intestinal microbiome. Am J Physiol Endocrinol Metab. 315(6):E1087–E1097.
- Konings E, Schoffelen PF, Stegen J, Blaak EE. 2014. Effect of polydextrose and soluble maize fibre on energy metabolism, metabolic profile and appetite control in overweight men and women. Br J Nutr. 111(1):111–121.
- Lewis SJ, Heaton KW. 1997. Stool form scale as a useful guide to intestinal transit time. Scand J Gastroenterol. 32(9):920–924.
- Lohner S, Jakobik V, Mihályi K, Soldi S, Vasileiadis S, Theis S, Sailer M, Sieland C, Berényi K, Boehm G, et al. 2018. Inulin-type fructan supplementation of 3- to 6-year-old children is associated with higher faecal bifidobacterium concentrations and fewer febrile episodes requiring medical attention. J Nutr. 148(8):1300–1308.
- Maathuis A, Hoffman A, Evans A, Sanders L, Venema K. 2009. The effect of the undigested fraction of maize products on the activity and composition of the microbiota determined in a dynamic in vitro model of the human proximal large intestine. J Am Coll Nutr. 28(6):657–666.
- Menni C, Jackson MA, Pallister T, Steves CJ, Spector TD, Valdes AM. 2017. Gut microbiome diversity and high-fibre intake are related to lower long-term weight gain. Int J Obes. ). 41(7):1099–1105.
- Molly K, Vande Woestyne M, De Smet I, Verstraete W. 1994. Validation of the Simulator of the Human Intestinal Microbial Ecosystem (SHIME) reactor using microorganism-associated activities. Microb. Ecol. Health Dis. 7(4):191–200.
- Paruzynski H, Korczak R, Wang Q, Slavin J. 2020. A pilot and feasibility study of oatmeal consumption in children to assess markers of bowel function. J Med Food. 23(5):554–559.
- Price MN, Dehal PS, Arkin AP. 2009. FastTree: computing large minimum evolution trees with profiles instead of a distance matrix. Mol Biol Evol. 26(7):1641–1650.
- R Core Team. 2013. R: A language and environment for statistical computing. Vienna, Austria: R Foundation for Statistical Computing; [accessed 2022 July 21]. http://www.R-project.org/.
- Reynolds A, Mann J, Cummings J, Winter N, Mete E, Te Morenga L. 2019. Carbohydrate quality and human health: a series of systematic reviews and meta-analyses. Lancet. 393(10170):434–445.
- Roberfroid M. 2005. Inulin-type fructans as functional food ingredients. Boca Raton, FL: CRC Press.
- Stephen AM, Champ MM, Cloran SJ, Fleith M, van Lieshout L, Mejborn H, Burley VJ. 2017. Dietary fibre in Europe: current state of knowledge on definitions, sources, recommendations, intakes and relationships to health. Nutr Res Rev. 30(2):149–190.
- Stewart ML, Nikhanj SD, Timm DA, Thomas W, Slavin JL. 2010. Evaluation of the effect of four fibres on laxation, gastrointestinal tolerance and serum markers in healthy humans. Ann Nutr Metab. 56(2):91–98.
- Timm DA, Thomas W, Boileau TW, Williamson-Hughes PS, Slavin JL. 2013. Polydextrose and soluble corn fibre increase five-day faecal wet weight in healthy men and women. J Nutr. 143(4):473–478.
- Trumbo P, Schlicker S, Yates AA, Poos M. 2002. Dietary reference intakes for energy, carbohydrate, fibre, fat, fatty acids, cholesterol, protein and amino acids. J Am Diet Assoc. 102(11):1621–1630.
- U.S. Department of Agriculture, Agricultural Research Service. 2020. Nutrient intakes from food and beverages: mean amounts consumed per individual, by gender and age, what we Eat in America, NHANES 2017–2018. [accessed 2022 Jul 19]. https://www.ars.usda.gov/ARSUserFiles/80400530/pdf/1718/Table_1_NIN_GEN_17.pdf.
- Van Hul M, Karnik K, Canene-Adams K, De Souza M, Van den Abbeele P, Marzorati M, Delzenne NM, Everard A, Cani PD. 2020. Comparison of the effects of soluble corn fibre and fructooligosaccharides on metabolism, inflammation, and gut microbiome of high-fat diet-fed mice. Am J Physiol Endocrinol Metab. 319(4):E779–E791.
- Varni JW, Bendo CB, Denham J, Shulman RJ, Self MM, Neigut DA, Nurko S, Patel AS, Franciosi JP, Saps M, et al. 2014. PedsQL gastrointestinal symptoms module: feasibility, reliability, and validity. J Pediatr Gastroenterol Nutr. 59(3):347–355.
- Venter C, Meyer RW, Greenhawt M, Pali-Schöll I, Nwaru B, Roduit C, Untersmayr E, Adel-Patient K, Agache I, Agostoni C, et al. 2022. Role of dietary fibre in promoting immune health-An EAACI position paper. Allergy. Epub ahead of print.
- Vester Boler BM, Serao MC, Bauer LL, Staeger MA, Boileau TW, Swanson KS, Fahey GC. Jr. 2011. Digestive physiological outcomes related to polydextrose and soluble maize fibre consumption by healthy adult men. Br J Nutr. 106(12):1864–1871.
- Wallace TC, Marzorati M, Spence L, Weaver CM, Williamson PS. 2017. New frontiers in fibres: innovative and emerging research on the gut microbiome and bone health. J Am Coll Nutr. 36(3):218–222.
- Whisner CM, Martin BR, Nakatsu CH, McCabe GP, McCabe LD, Peacock M, Weaver CM. 2014. Soluble maize fibre affects short-term calcium absorption in adolescent boys and girls: a randomised controlled trial using dual stable isotopic tracers. Br J Nutr. 112(3):446–456.
- Whisner CM, Martin BR, Nakatsu CH, Story JA, MacDonald-Clarke CJ, McCabe LD, McCabe GP, Weaver CM. 2016. Soluble corn fiber increases calcium absorption associated with shifts in the gut microbiome: a randomized dose-response trial in free-living pubertal females. J Nutr. 146(7):1298–1306.