
Abstract
To identify the potential anabolic properties of a dairy-plant protein blend as compared to single plant-based and single dairy protein, the postprandial amino acid (AA) response of pea protein, milk protein, micellar casein, and a casein–pea protein blend was investigated in healthy older adults (age 72.3 ± 3.4 years, BMI 25.3 ± 2.9 kg/m2). Plasma AA levels were measured, before and up to 5 h after ingestion of each 20 g protein. Blending casein–pea in a 60/40 mixture resulted in improved plasma AA availability, i.e. area under the curve (AUC) and peak height, of total (essential) AA and of key AAs methionine and leucine compared to pea only, while preserving the higher availability of arginine. The casein/pea blend clearly showed an AA response that was in between that of its single constituents, indicating that blending could be a solution to improve a lower quality (plant) protein, which could be of relevance for older adults.
Introduction
Ageing leads to anabolic (i.e. growth) impairments in skeletal muscle, which in turn might lead to reductions in muscle mass and strength, known as sarcopenia. Reductions in muscle mass and function are directly associated with reduced physical function and mortality rates in older adults (Cruz-Jentoft et al. Citation2019). As such, increasing muscle protein synthesis (MPS) via protein-based nutrition, with or without exercise, maintains a strong, healthy muscle mass, which in turn leads to improved health, independence and functionality (McLeod et al. Citation2016). Protein intake has been extensively studied as a means of attenuating age-dependent muscle mass loss and therefore maintaining quality of life. An important aspect of the anabolic property of dietary protein is the resulting postprandial aminoacidemia, which is known in the short term (hours) to stimulate MPS, especially when combined with – resistance-type – exercise (Gwin et al. Citation2020). Consumption of additional protein, in particular post-exercise, is therefore an intelligent strategy to enhance adaptation to exercise, resulting in an improved muscle mass and function, aerobic fitness and metabolic health.
Medical, clinical, infant and consumer nutrition market interest is increasingly directed towards the use of plant-based proteins as dietary components for preserving or increasing skeletal muscle mass. Plant-based proteins have in general a lower anabolic effect than animal proteins due to their lower digestibility, lower essential amino acid (AA) content or even a deficiency in essential AAs, such as the sulphur AAs or lysine (van Vliet et al. Citation2015; Berrazaga et al. Citation2019). In addition, leucine, which plays an important role in the stimulation of skeletal MPS, is in general lower in plant-based proteins compared to animal protein. The resulting lower postprandial aminoacidemia, in particular of essential AAs, underlies the lower anabolic properties of plant-based protein.
Various strategies have been suggested to augment the anabolic properties of plant proteins, like consumption of greater amounts of plant-based protein sources. Increasing plant protein intake has indeed led to a positive acute postprandial MPS response and even positive long-term improvement in lean mass (Berrazaga et al. Citation2019). However, just eating more is not always feasible in elderly, for example, due to chewing problems or mild anorexia. Another strategy involves the ingestion of multiple protein sources to provide a more balanced AA profile, by blending several plant-based protein sources, or – as is the focus of the present study – blending plant with animal-based protein sources. Interestingly, it has been demonstrated that specific mixtures between animal and plant protein sources may exhibit an improved digestibility due to synergistic protein–protein interactions (Joehnke et al. Citation2019, Citation2018). However, only little is known yet about the anabolic properties of such blends.
To demonstrate a beneficial effect of specific protein sources (animal, plant or blends) on muscle mass, muscle function and metabolism, well controlled intervention studies in target populations are essential. The potential of various protein sources and/or blends for impacting muscle health may be screened by quantifying in vivo post-prandial plasma AA availability. As muscle tissue will only be exposed to proteins, after they have been digested and absorbed as AAs and di/tripeptides, the peripheral metabolic availability of proteins is an important aspect that has to be taken into account when screening the anabolic properties of protein sources. The availability of AAs for MPS can be explored by assessing the postprandial AA profile in blood, i.e. peak level of aminoacidemia, area-under-the curve of AAs and time-line of the profile.
To identify the potential anabolic properties of a dairy-plant protein blend as compared to single plant-based and single dairy protein, the objective of the present study was to investigate the postprandial AA response of pea protein, total milk protein, micellar casein and a casein–pea protein blend (obtained by co-drying) in healthy older adults.
Materials and methods
Study design
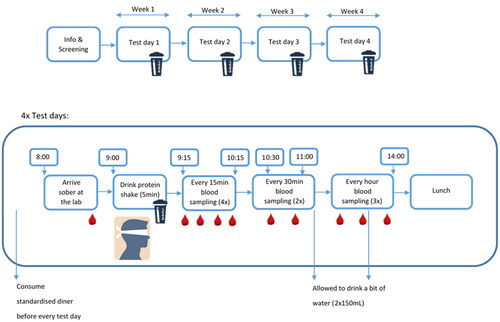
The study was designed as a within-subject (cross-over) trial in which a group of older adults received four different protein drinks, in a random order (see ). Each subject received all treatments on the same day of the week (±1 day) with – at least − 1 week (±1 day) washout period between treatments. Protein drinks were consumed in the morning after a standardised dinner in the evening, followed by an overnight fast, and blood AA and insulin kinetics were measured up to 5 h after intake. Both, participants as well as researchers involved in the execution and sample analysis of the trial were blinded for the protein treatment. The study was conducted according to the principles of the Declaration of Helsinki (64th WMA Assembly, October 2013) and in accordance with the Dutch Medical Research Involving Human Subjects Act (WMO 1998). The study was approved by the Brabant ethical committee (P2129, NL78067.028.21) and registered at ClinicalTrials.gov: NCT04935788.
Figure 1. Study design and protocol.
Subjects
Twelve apparently healthy older adults, six males and six females, participated in this study (see for characteristics), subjects were eligible when aged between 65 and 80 years, having a BMI between 20 and 32 kg/m2, never smoked, or stopped smoking >5 years ago, had regular and normal Dutch eating habits and were healthy as assessed by a short lifestyle and health questionnaire and according to the judgement of the study physician. In addition, potential participants were excluded when (1) having a history of medical or surgical events that might significantly affect the study outcome, including: inflammatory bowel disease, hepatitis, pancreatitis, ulcers, gastrointestinal or rectal bleeding, major gastrointestinal tract surgery, known or suspected gastrointestinal disorders, colon or GI tract cancer; (2) using glucose lowering drugs, insulin; or medication that may impact gastric emptying (e.g. gastric acid inhibitors or laxatives); (3) being diagnosed with diabetes, being treated for high blood glucose, or an increased fasting blood glucose (>6.7 mmol/L in finger prick blood) as assessed during a screening visit. Finally, for men Hb <8.5 mmol/L as assessed during screening visit; for women: Hb <7.5 mmol/L, and no regular use of protein supplements. All participants signed the informed consent before the start of the study and were fully compliant to the study protocol and completed all four conditions, there were no dropouts.
Table 1. Subject characteristics.
Intervention
Four different protein drinks were investigated: total milk protein isolate (30% casein/70% whey protein), micellar casein isolate (90% casein/10% whey protein), pea protein and a 60/40 micellar casein isolate/pea protein blend obtained by co-drying. Milk protein, micellar casein and blend were obtained from Ingredia SA (Arras, France). All drinks contained a 20 g protein load. All protein supplements were mixed with 250 mL water. No flavourings were added to improve palatability or mask the taste, as some pilot sessions revealed that it was hard to do so. In addition, we did not want to add flavourings that could potentially affect protein digestion and absorption, like for example cacao. See and Supplementary Table 1 for AA details. Participants as well as researchers involved in the execution of the study were not aware about the protein source, and drinks were provided in closed cups.
Table 2. Macronutrient composition protein drinks.
Subjects were randomly assigned to a specific order of administration of the four products by a non-blinded person outside the study team. All researchers of the project team involved in execution of the trial and in sample and data analysis were kept blind to assignment of treatment until after data analysis.
Blood sample collection and analysis
Subjects were asked not to do any unusual strenuous physical activity or drink alcohol on the day prior to each test day. In addition, subjects were asked to eat a provided meal the evening before each test day and arrive at the site at 8 a.m. with the same means of transportation as selected by the subject on the first test day, with a minimum of activity and no rush.
First blood samples were collected after an overnight fast (no eating or drinking after 9 p.m.), using an indwelling catheter in the antecubital vein. Thereafter, the protein drink was consumed within a 5 min period (ending at t = 0 min). Subsequent blood samples were taken at 15, 30, 45, 60, 90, 120, 180, 240 and 300 min.
Between all sample collections, subjects spent the entire study duration in the research unit, where they were able to read books, watch television/DVD or relax in comfortable chairs with minimal physical activity and no food consumption, except for a small amount of water (150 mL) after the blood sample at t = 120 min and t = 240 (see ). At the end of each study day, subjects were offered a lunch meal before they went home.
Blood samples were immediately centrifuged at 1300 RCF, for 10 min, at 22 °C; and plasma was stored at –80 °C until sample analysis. Insulin was measured at Hospital Gelderse Vallei using the Immulite 2000 insulin assay according to the instructions of the manufacturer (Siemens, Munich, Germany). Values below the quantifying limit of 2 µIU/mL were imputed by 1 before data analysis.
Blood AA analysis was performed at NIZO (Ede, The Netherlands). For this, blood serum samples were prepared using the Kairos free amino acid kit (Waters, Milford, MA) using AcCQ tag derivatisation of AAs. One hundred microlitres sample was transferred to an amber HPLC vial with insert and used for the analysis. Reversed phase ultra high performance liquid chromatography (RP-UHPLC) with mass spectroscopic (MS) detection was used for quantitative analyses of AAs (20 regular AAs, plus citrulline and ornithine). The limit of quantification (LOQ) varied between AAs, in the range of 0.3–1.1 µmol/L for most AAs. Higher LOQ was determined for histidine (7.4 µmol/L), asparagine (3.2 µmol/L), arginine (3.0 µmol/L) and alanine (2.1 µmol/L). Reproducibility of the analysis, expressed as CV% (relative standard deviation), varied between AAs in the range of 1.5–4.9%, with an average of 3%.
Data analysis
The data analysis consisted of several steps, as described earlier (Mes et al. Citation2022; Wehrens et al. Citation2023). In brief, in the first step, the time profiles for the amino-acid levels in blood were described by parametric curves. Separate curves were fitted to the time profile from each AA and each study participant, as well as to total amino acid (TAA), total essential AA (TEAA) and total branched chain AA (BCAA). Next, variables summarising the time profile, such as area under the curve (AUC), peak height, both corrected for baseline levels, and time to the maximum, were obtained from each fit.
Time curves for AA levels in blood of individual participants were described by the following equation: y(t) = d + atmce–ct: in this equation, y(t) is the AA level at time t, d is the level of the baseline, a is a scaling factor, m describes the time to the maximum of the curve, and c describes the shape of the decreasing part of the curve (WOOD Citation1967) (Engel et al. Citation2003). Unrealistic values, i.e. values outside specific curation ranges, were replaced by NA, resulting in no curve fit in such a case. The parameters of interest (PoIs), AUC, time to maximum and peak height were obtained from the estimates of these parameters (Rook et al. Citation1993). A further curation step again replaced unrealistic values by NA.
A linear mixed model was used to study the PoIs in more detail and, in particular, contrast the four protein sources. The model comprised fixed effects for protein condition and test day and a random effect for participants. In cases where AUC or peak height values were not available due to failure to fit a curve or to curation, data-based imputation was used (Wehrens et al. Citation2023) – in general, missing values correspond to cases where no peak can be seen, corresponding to low values for AUC of peak height. However, it is impossible to estimate the time to the maximum of the peak, since there is no peak. The t-test was used to assess the significance of protein intervention effect, with pea protein as the reference. A p value <.05 was considered significant, where a multiple-testing correction (Dunnett) is applied to account for multiple protein interventions. No correction is applied at this point to account for the fact that multiple AAs and amino-acid totals are compared. Results for the differences between the two protein interventions are presented in the form of 95% confidence intervals (CIs). Note that the analysis of AUC values focused on ratios rather than on differences. All statistical analyses have been implemented in an R package (www.R-project.org), “aaresponse”, which is made available as open-source software from https://github.com/Biometris/aaresponse.
For plasma insulin, a linear mixed-model analysis for repeated measures with time (eight levels) and protein source (four levels) as fixed factors was used to assess main effects of time and protein source, as well as an interaction effect time × protein source.
Results
Only a single blood sample was missing due to technical problems. Postprandial profiles for TAA, TEAA and BCAA are depicted in ; those for leucine, arginine, methionine and lysine in . Values for all (other) individual AAs can be found in Supplementary Table S2. All conditions resulted in a strong increase after consumption, with highest T(E)AA for milk protein, followed by pea or blend, and lowest response for the micellar casein drink. Highest values were seen in the 45–60 min period, with values staying above baseline till the end of the study time (t = 300).
Figure 2. Plasma AA response for all four protein conditions; AA totals (TAA), essential AA (TEAA) and branched-chain AA (BCAA), respectively. Mean ± SD, for clarity only SD for milk protein (positive) and micellar casein (negative SD bar) are given.
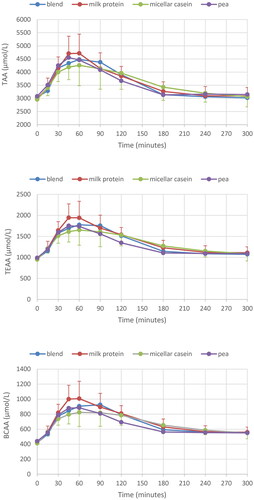
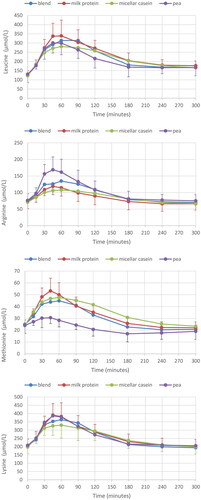
Figure 3. Plasma AA response for all four protein conditions; leucine, arginine, methionine and lysine, respectively. Mean ± SD, for clarity only SD for the highest curve (positive) and lowest curve (negative SD bar) are given.
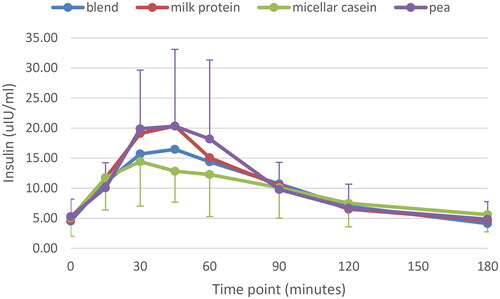
Plasma insulin response is depicted in . There was a significant main effect of time (p < .001): peaks were observed after 30–45 min, with values returning to baseline 180 min after consumption. Highest response was observed for milk protein and pea protein, lowest for micellar casein, with blend in between. However, the model revealed no main effect for protein source (p = .13) and interaction (p = .64).
Figure 4. Plasma insulin response for all four protein conditions. Mean ± SD; for clarity only SD for pea (positive) and casein (negative SD bar) are given.
Subjects’ personal curves for TAA, TEAA and BCAA can be found in Supplementary Figure S1. A remarkable variation in inter-individual response can be seen, with either high or low plasma AA levels (subject 2 vs. subject 1 and 10, figure S1), a clear difference in response between conditions vs. no difference in response (3, 8 vs. 1, 10), as well as difference in order of the protein sources resulting in the highest response (e.g. blend in subject 2, micellar casein in subject 5/9, pea in 3, Figure S1). The within subject coefficient of variation (CV) of the AUC ranged from 20 to 30% for the three AA totals, and did not differ much between protein sources.
Curve fits and PoIs
In the next step, time curves for AA levels in blood were fitted for every subjects. In total, 101 out of 1056 curves could not be fitted, ∼6–9 curves per participant on average; mainly on four specific AAs: Asp, Cys, Glu and Gly. These AAs showed either very low blood levels and/or hardly any change over time, making reliable curve fitting impossible. These AAs were not further considered individually. For TAA, TEAA and BCAA, only one TAA curve could not be fitted due to an outlying value. Next, PoIs (AUC, peak height AA response (Height) and Time2Max) were determined for individual AAs and TAA, TEAA and BCAA. An additional three unrealistic values for three different AAs were observed. Imputation was used when statistically comparing PoIs between protein conditions, with pea protein as the reference; however, imputation is not possible for Time2Max.
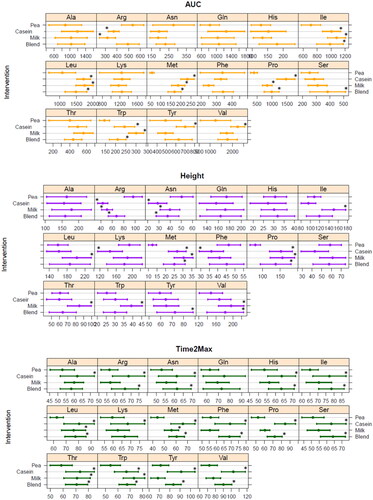
Tryptophan, proline, methionine, leucine and isoleucine AUC were all significantly higher for milk protein, micellar casein and blend compared to pea (, top panel); while valine and tyrosine were only higher after the micellar casein drink compared to pea protein, and serine after the blend compared to pea. Arginine AUC was lower for milk protein and micellar casein compared to pea protein, but not for blend. Peak height showed comparable differences as described for AUC (, middle panel): leucine, isoleucine and valine peak height were higher for milk protein, but not for micellar casein and blend, compared to pea protein. Arginine and asparagine had a greater peak height after pea protein consumption compared to all other conditions, while proline and methionine were lower for pea protein. Finally, time to peak height (Time2Max) was for many AAs much shorter for pea compared to micellar casein and the casein/pea blend; differences with milk protein were less pronounced (, lower panel).
Figure 5. Fitted area under the curve (AUC, µM·min) and peak height (µmol/L), corrected for baseline, and time to max (Time2Max, min) values for each individual amino acid for all four protein conditions (average + CI). Asp, Cys, Glu and Gly were not considered due to too much missing values in curve fitting as blood levels were very low and/or showed no clear response; *significant different from pea (p < .05, with multiple-testing correction (Dunnett)).
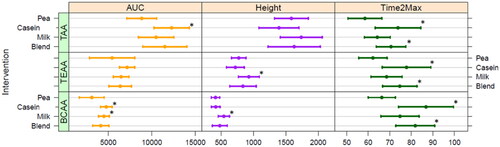
When comparing the different AA totals (), AUC for TAA was significantly higher for micellar casein compared to pea, and tended to be higher for blend; milk protein was not significantly different compared to pea. For BCAA, AUC was higher for micellar casein and milk protein, not for blend, compared to pea protein. TEAA AUC was not statistically significantly different for either milk protein, micellar casein or blend compared to pea protein. Peak height was only different for milk protein compared to pea, both TEAA and BCAA peaked significantly higher after milk protein consumption. Time2Max was shortest for pea protein and significantly longer for micellar casein and blend for all AA totals (), milk protein had a Time2Max that did not differ from pea, for TAA. TEAA as well as BCAA.
Figure 6. Fitted area under the curve (AUC, µM·min) and peak height (µmol/L), corrected for baseline, and time to max height (Time2Max, min) values for amino acid totals for all four protein conditions (average + CI). *Significant different from pea.
Discussion
To evaluate the potential anabolic properties of a dairy-plant protein blend, we measured the postprandial AA kinetics of pea protein, milk protein, micellar casein and a casein–pea protein blend in healthy older adults. The essential AAs tryptophan, methionine, leucine, isoleucine and the non-essential proline all had a low AUC and/or peak height after ingestion of pea protein as compared to both dairy proteins, but also compared to the casein–pea blend indicating a clearly improved response upon blending. On the other hand, the arginine response was highest after pea protein ingestion, which was significantly different compared to both dairy proteins, but not to the blend. Also for the AA totals TAA TEAA and BCAA, blending resulted in a “intermediate” profile in between that of pea and both dairy proteins. Thus, the 60/40 casein–pea blend had a postprandial AA profile reflecting characteristics of both the casein as well as the pea protein.
Although the plasma AA response is a result of many factors, including digestion and absorption kinetics, splanchnic area AA extraction and de- and transamination, hormone secretion and body protein synthesis and breakdown rates (Groen et al. Citation2015), it generally reflects the AA profile of the ingested protein source, in particular, when protein is provided as a supplement, not a food. Indeed, our observations confirm that the post-prandial individual AA response reflected the ingested protein source, as already shown by others (Brennan et al. Citation2019; Liu et al. Citation2019; Zeinstra et al. Citation2019; Mes et al. Citation2022). Thus, milk protein and casein contained more EAA and BCAA per gram of powder than pea protein. This resulted in elevated plasma EAA and a significantly higher BCAA availability after milk protein and micellar casein compared to pea ingestion, as well as a significant greater peak height for milk protein. Micellar casein, due to its coagulation properties, was characterised by more prolonged elevated plasma AA levels, which was reflected in a delayed time to peak for casein for all three AA totals. Also at the level of individual AAs, plasma kinetics reflected AA composition of the protein sources. Leucine, isoleucine, tryptophan and methionine are low in pea protein and showed lower plasma responses. On the other hand, arginine, which is known to be high in pea, was indeed associated with a significantly higher postprandial response, both AUC as well as peak height.
As expected, blending casein and pea in a 60/40 mixture resulted in an “intermediate” profile, showing characteristics of casein as well as pea protein. All three AA totals had a higher AUC for blend compared to pea, although not significant and as high as micellar casein only, while time to peak height was prolonged compared to pea – similar to casein kinetics. At the individual level, tryptophan, methionine, leucine and isoleucine were all significantly higher in milk protein, micellar casein and blend compared to pea only, while arginine was no longer different form pea after blending. Earlier work from Liu et al. (Citation2019) demonstrated a similar effect of blending. Comparing a whey/soy/pea/casein blend (“P4”) to its constituent single protein sources revealed that the P4 protein consistently showed a post-prandial response in the middle of the range of responses seen with the other single protein sources for the key individual AA, leucine, methionine and arginine (Liu et al. Citation2019). The observation of an improved availability of methionine and leucine and the preserved higher response of arginine in that study, as well as ours, are relevant, as methionine (together with cysteine) is the first limiting AA in pea, and the first limiting AA in a protein source determines the overall protein quality score (Food and Agriculture Organization (FAO) Citation2013). So, and improved availability will improve the protein’s quality. Leucine, although not the first limiting AA, is an important AA that directly regulates protein synthesis in skeletal muscle via mTOR activation (Li et al. Citation2011). Finally, arginine, not an essential AA but considered as a conditionally essential AA, has multiple biological effects including activation of the nitric oxide (NO) pathway, which is involved in the regulation of carbohydrate and lipid metabolism with potential beneficial effect for obesity and type 2 diabetes (Szlas et al. Citation2022).
Altogether, the observed postprandial AA kinetics reflect AA composition of the ingested source, with blending resulting in a profile with characteristics in the middle of its single sources with potential desirable effect on muscle metabolism and health.
Although postprandial plasma AA levels are mainly driven by the AA composition of a protein source, other factors do play a role too, most notably protein digestion and absorption. In general, animal-derived proteins are relatively easy to digest, while, in contrast, plant proteins can be harder to digest because of their tertiary structural integrity, modifications like glycosylation and phosphorylation as well as the presence of anti-nutritional factors, like protease inhibitors, tannins, phytic acid and saponins that limit digestion (Sareneva et al. Citation1995; Yu et al. Citation2007; Boutrou et al. Citation2010; Dupont et al. Citation2010). As we provided protein concentrates, with a protein fraction of ∼80%, anti-nutritional factors were likely still present in particular in the pea protein, and could also partly underlie the lower availability of (individual) AAs upon ingestion. Pea protein is classified as a good digestible and high quality protein, which means that it is able to supply all essential AAs at the required levels (i.e. a digestible indispensable amino acid score (DIAAS) close to 1.00). However, compared to micellar casein, real ileal digestibility (RID) of all essential AAs was lower in a purified pea condition in healthy humans (Guillin et al. Citation2022).
Clear differences between individuals in postprandial AA profiles were observed. Some individuals have a high rise in plasma AAs and others have a low rise, but there are also differences in order of the protein sources resulting in the highest plasma AA response. The CV for the AUC of the different AA totals was ∼25% for each of the conditions, with no major differences between the conditions. Mes et al. (Citation2022), however, observed a larger inter-individual variation among subjects receiving lemna protein (duckweed family), with a low postprandial response, compared to an equal amount of highly available whey protein. Variation between individuals can be explained by phenotypic differences, i.e. changes in plasma volume (body weight), but also by personal differences in the ability to digest proteins, which ultimately could give rise to “personalising protein nourishment” (Dallas et al. Citation2017).
The supply of AAs to – skeletal muscle – tissue is crucial for protein synthesis, and the level of (essential) aminoacidemia is an important factor for the protein synthetic rate, especially when combined with – resistance-type – exercise (Gwin et al. Citation2020). Thus one could predict that the higher AUC of milk protein and micellar casein, and the improved AA availability after blending, will result in a stronger stimulation of MPS. However, two recent studies measured postprandial plasma AA availability as well as MPS after ingestion of plant-based proteins vs. animal-based milk protein in young healthy males (Pinckaers PJM et al. Citation2022; Pinckaers PJ et al. Citation2023). It was observed that MPS did not differ after potato protein (Pinckaers PJM et al. Citation2022) or a plant-derived protein blend (i.e. wheat/corn/pea) (Pinckaers PJ et al. Citation2023) compared to milk protein, despite attenuated postprandial rises in circulating plasma EAA and leucine concentrations after either potato protein or the plant derived protein blend. This might suggest that a stronger postprandial plasma response not always translates into stronger stimulation of MPS. In young adults, there are indications that the level of post-prandial increase in blood leucine concentrations is not as crucial for regulating the magnitude of post-prandial MPS response to an ingested protein source as it is for older adults (Zaromskyte et al. Citation2021).
Our observations might have relevance for the clinical condition of sarcopenia, the age-related decline in muscle mass and function. Reductions in muscle mass and function are directly associated with reduced physical function and mortality rates in older adults (Cruz-Jentoft et al. Citation2019), and increasing MPS, via to anabolic properties of protein-based nutrition, maintains a strong, healthy muscle mass (McLeod et al. Citation2016). Various strategies have been suggested to augment the anabolic potential of plant proteins, including consuming greater amounts of plant-based protein sources, or – as we demonstrated here – blending plant and animal based proteins. Thus, to fight sarcopenia in the elderly, where a – further – decline of muscle mass should be prevented, increasing protein intake or preferentially improving protein quality, by for example blending, are relevant nutritional approaches (Berrazaga et al. Citation2019) and should be explored in future studies, which include measurements of muscle mass and function in sarcopenic populations.
Although the level of postprandial AAs is the resultant of many physiological factors and it does not measure body protein anabolism/catabolism, the peripheral metabolic availability of proteins is an important aspect that has to be taken into account when screening the anabolic properties of protein sources. Moreover, it is rather easy to perform and a much more feasible approach to screen novel protein sources or blends, before moving to more-invasive protocols requiring muscle biopsies or to controlled intervention trials to assess the functional impact.
We used the “aaresponse” package for R (Wehrens et al. Citation2023) to analyse postprandial AA responses in crossover studies, which use curve fitting to obtain PoIs summarising the time profile such as AUC, peak height, both corrected for baseline levels, and the time to maximum. This approach reduces the influence of noise in individual observations by enforcing a well-defined response shape. Several curation steps allow the user to remove individual outliers, or to ignore complete time profiles in cases where there are clear deviations from expected behaviour. Obviously, such manipulations should be kept to an absolute minimum and should be documented, as is done here – one important advantage of such an analysis pipeline is that the analysis is completely reproducible. For parameters like peak height and AUC, it is also possible to use imputation for cases where the response is too low to fit a peak, leading to increased statistical power in the comparison of different protein sources.
We showed here that blending with micellar casein resulted in improved postprandial AA availability of in this case pea protein. Blending of protein sources, also in meals, could be a solution to improve a lower quality (plant) protein, and is, in particular for older people, a more feasible approach than just eating more protein to compensate for a lower availability and a reduced anabolic response. We provided protein as concentrates without any additional nutrients that could potentially interfere with the postprandial AA kinetics. Obviously, protein sources will behave differently when being part of a food or meal – which much more resembles normal eating behaviour, and should be investigated in future studies.
In conclusion, blending casein and pea protein in a 60/40 mixture resulted in improved plasma AA availability of key AAs methionine and leucine compared to pea only, while preserving the higher availability of arginine. The casein/pea blend clearly showed an AA profile that was in between that of its single constituents, demonstrating that the postprandial AA profile is a reflection of the AA composition of the ingested protein supplement.
Author contributions
MM, AK, JT, AB and MH developed the study; LvD executed the study; RW performed the protein/AA data analysis; MM, LvD and RW drafted the manuscript; all authors approved the final version of the manuscript.
Supplemental Material
Download PDF (775.7 KB)Acknowledgements
We thank Simon Jacobs (NIZO) for his technical and analytical assistance.
Disclosure statement
LvD, AK, RW and MM have no conflict of interest. JT, AB and MH do work for Ingredia SA, which provided the protein sources and co-funded the project.
Additional information
Funding
References
- Berrazaga I, Micard V, Gueugneau M, Walrand S. 2019. The role of the anabolic properties of plant- versus animal-based protein sources in supporting muscle mass maintenance: a critical review. Nutrients. 11(8):1825. doi: 10.3390/nu11081825.
- Boutrou R, Coirre E, Jardin J, Léonil J. 2010. Phosphorylation and coordination bond of mineral inhibit the hydrolysis of the β-casein (1–25) peptide by intestinal brush-border membrane enzymes. J Agric Food Chem. 58(13):7955–7961. doi: 10.1021/jf100568r.
- Brennan JL, Keerati-U-Rai M, Yin H, Daoust J, Nonnotte E, Quinquis L, St-Denis T, Bolster DR. 2019. Differential responses of blood essential amino acid levels following ingestion of high-quality plant-based protein blends compared to whey protein—a double-blind randomized, cross-over, clinical trial. Nutrients. 11(12):2987. doi: 10.3390/nu11122987.
- Cruz-Jentoft AJ, Bahat G, Bauer J, Boirie Y, Bruyère O, Cederholm T, Cooper C, Landi F, Rolland Y, Sayer AA, et al. 2019. Sarcopenia: revised European consensus on definition and diagnosis. Age Ageing. 48(1):16–31. doi: 10.1093/ageing/afy169.
- Dallas DC, Sanctuary MR, Qu Y, Khajavi SH, van Zandt AE, Dyandra M, Frese SA, Barile D, German JB. 2017. Personalizing protein nourishment. Crit Rev Food Sci Nutr. 57(15):3313–3331. doi: 10.1080/10408398.2015.1117412.
- Dupont D, Mandalari G, Mollé D, Jardin J, Rolet-Répécaud O, Duboz G, Léonil J, Mills CEN, Mackie AR. 2010. Food processing increases casein resistance to simulated infant digestion. Mol Nutr Food Res. 54(11):1677–1689. doi: 10.1002/mnfr.200900582.
- Engel B, van Reenen K, Buist W. 2003. Analysis of correlated series of repeated measurements: application to challenge data. Biometric J. 45(7):866–886. doi: 10.1002/bimj.200390055.
- [FAO] Food and Agriculture Organization. 2013. Dietary protein quality evaluation in human nutrition. Report of an FAO expert consultation. FAO Food Nutr Pap. 62:1–66.
- Groen BBL, Horstman AM, Hamer HM, de Haan M, van Kranenburg J, Bierau J, Poeze M, Wodzig WKWH, Rasmussen BB, van Loon LJC. 2015. Post-prandial protein handling: you are what you just ate. PLOS One. 10(11):e0141582. doi: 10.1371/journal.pone.0141582.
- Guillin FM, Gaudichon C, Guérin-Deremaux L, Lefranc-Millot C, Airinei G, Khodorova N, Benamouzig R, Pomport P-H, Martin J, Calvez J. 2022. Real ileal amino acid digestibility of pea protein compared to casein in healthy humans: a randomized trial. Am J Clin Nutr. 115(2):353–363. doi: 10.1093/ajcn/nqab354.
- Gwin JA, Church DD, Wolfe RR, Ferrando AA, Pasiakos SM. 2020. Muscle protein synthesis and whole-body protein turnover responses to ingesting essential amino acids, intact protein, and protein-containing mixed meals with considerations for energy deficit. Nutrients. 12(8):2457. doi: 10.3390/nu12082457.
- Joehnke MS, Lametsch R, Sørensen JC. 2019. Improved in vitro digestibility of rapeseed napin proteins in mixtures with bovine beta-lactoglobulin. Food Res Int. 123:346–354. doi: 10.1016/j.foodres.2019.05.004.
- Joehnke MS, Rehder A, Sørensen S, Bjergegaard C, Sørensen JC, Markedal KE. 2018. In vitro digestibility of rapeseed and bovine whey protein mixtures. J Agric Food Chem. 66(3):711–719. doi: 10.1021/acs.jafc.7b04681.
- Li F, Yin Y, Tan B, Kong X, Wu G. 2011. Leucine nutrition in animals and humans: mTOR signaling and beyond. Amino Acids. 41(5):1185–1193. doi: 10.1007/s00726-011-0983-2.
- Liu J, Klebach M, Visser M, Hofman Z. 2019. Amino acid availability of a dairy and vegetable protein blend compared to single casein, whey, soy, and pea proteins: a double-blind, cross-over trial. Nutrients. 11(11):2613. doi: 10.3390/nu11112613.
- McLeod M, Breen L, Hamilton DL, Philp A. 2016. Live strong and prosper: the importance of skeletal muscle strength for healthy ageing. Biogerontology. 17(3):497–510. doi: 10.1007/s10522-015-9631-7.
- Mes JJ, Esser D, Oosterink E, van den Dool RTM, Engel J, de Jong GAH, Wehrens R, van der Meer IM. 2022. A controlled human intervention trial to study protein quality by amino acid uptake kinetics with the novel lemna protein concentrate as case study. Int J Food Sci Nutr. 73(2):251–262. doi: 10.1080/09637486.2021.1960958.
- Pinckaers PJ, Kouw IW, Gorissen SH, Houben LH, Senden JM, Wodzig WK, de Groot LC, Verdijk LB, Snijders T, van Loon LJ. 2023. The muscle protein synthetic response to the ingestion of a plant-derived protein blend does not differ from an equivalent amount of milk protein in healthy young males. J Nutr. 152(12):2734–2743. doi: 10.1093/jn/nxac222.
- Pinckaers PJM, Hendriks FK, Hermans WJH, Goessens J, Senden JM, van Kranenburg JMX, Wodzig WKHW, Snijders TIM, van Loon L. 2022. Potato protein ingestion increases muscle protein synthesis rates at rest and during recovery from exercise in humans. Med Sci Sports Exerc. 54(9):1572–1581. doi: 10.1249/MSS.0000000000002937.
- Rook AJ, France J, Dhanoa MS. 1993. On the mathematical description of lactation curves. J Agric Sci. 121(1):97–102. doi: 10.1017/S002185960007684X.
- Sareneva T, Pirhonen J, Cantell K, Julkunen I. 1995. N-glycosylation of human interferon-γ : glycans at Asn-25 are critical for protease resistance. Biochem J. 308(Pt 1):9–14. doi: 10.1042/bj3080009.
- Szlas A, Kurek JM, Krejpcio Z. 2022. The potential of l-arginine in prevention and treatment of disturbed carbohydrate and lipid metabolism—a review. Nutrients. 14(5):961. doi: 10.3390/nu14050961.
- van Vliet S, Burd NA, van Loon LJ. 2015. The skeletal muscle anabolic response to plant- versus animal-based protein consumption. J Nutr. 145(9):1981–1991. doi: 10.3945/jn.114.204305.
- Wehrens R, Engel J, Mes J, de Jong A, Esser D. 2023. Analysing postprandial amino-acid responses in crossover studies with the aaresponse package for R; [unpublished manuscript].
- Wood PDP. 1967. Algebraic model of the lactation curve in cattle. Nature. 216(5111):164–165. doi: 10.1038/216164a0.
- Yu YQ, Fournier J, Gilar M, Gebler JC. 2007. Identification of N-linked glycosylation sites using glycoprotein digestion with pronase prior to MALDI tandem time-of-flight mass spectrometry. Anal Chem. 79(4):1731–1738. doi: 10.1021/ac0616052.
- Zaromskyte G, Prokopidis K, Ioannidis T, Tipton KD, Witard OC. 2021. Evaluating the leucine trigger hypothesis to explain the post-prandial regulation of muscle protein synthesis in young and older adults: a systematic review. Front Nutr. 8:685165. doi: 10.3389/fnut.2021.685165.
- Zeinstra GG, Somhorst D, Oosterink E, Fick H, Klopping-Ketelaars I, van der Meer IM, Mes JJ. 2019. Postprandial amino acid, glucose and insulin responses among healthy adults after a single intake of lemna minor in comparison with green peas: a randomised trial. J Nutr Sci. 8:e28. doi: 10.1017/jns.2019.26.