
 ?Mathematical formulae have been encoded as MathML and are displayed in this HTML version using MathJax in order to improve their display. Uncheck the box to turn MathJax off. This feature requires Javascript. Click on a formula to zoom.
Abstract
The aim of this study was to evaluate the accuracy of nutrient intake assessment with the food group-based algorithm “Calculator of Inadequate Micronutrient Intake” (CIMI) in comparison to the established nutrition software NutriSurvey. Using Food Frequency Questionnaires and 24-h dietary recalls of 1010 women from two rural districts in Tanzania, 23 relevant typical Tanzanian food groups were identified and subsequently the dietary protocols assessed via CIMI algorithm were compared by bivariate correlations and Bland-Altman analysis with the results of the NutriSurvey software (reference) and were set in relation to blood biomarkers of 666 participants. CIMI and NutriSurvey calculations regarding macro- and micronutrient intakes were similar. The Bland-Altman analyses and correlation coefficients of energy (0.931), protein (0.898), iron (0.775) and zinc (0.838) confirm the agreement of both calculations. The food group based CIMI algorithm is a practical tool to identify the inadequacy of macro- and micronutrient intake at population level.
Introduction
Micronutrient malnutrition is common in developing countries, often due to the consumption of monotonous staple-based diets rich in foods such as cereals (maize, millet and rice) and starchy roots (cassava, potatoes and plantains). While these foods provide adequate energy, they do not contain enough bioavailable iron, vitamin A and zinc, and other micronutrients, such as folate and vitamin B1 (thiamine) (Seal et al. Citation2005). Long-term consumption of a diet lacking micronutrient-dense foods results in hidden hunger: a chronic lack of vitamins and minerals, while being macronutrient- and energy-sufficient (Biesalski Citation2014; Gupta et al. Citation2017). Although hidden hunger often goes unidentified, due to lack of clinical symptoms, its consequences can be severe. Hidden hunger can lead to irreversible mental and physical problems, poor health and productivity, and is a leading cause of childhood mortality (Biesalski Citation2014). Early detection of hidden hunger is therefore very important, to successfully combat micronutrient deficiencies. This can be achieved by assessing micronutrient adequacy of diets commonly consumed by at risk populations.
To identify nutrient gaps that can be used to estimate the risk for malnutrition of a certain cohort, rapid nutritional assessment tools are needed. The commonly used tools are Food Frequency Questionnaires (FFQ), Dietary Diversity scores and 24-h-recalls (Kennedy et al. Citation2013). With regard to FFQ and Dietary Diversity scores, the evaluation is relatively fast and uncomplicated, but the results are not suitable to calculate quantitative intakes of individual nutrients. Dietary Diversity score is only a proxy-indicator that can be used in longitudinal studies of one region (Kojima et al. Citation2020). 24-h-recalls, on the other hand, provide detailed information about nutrient intake and dietary patterns of the study group and give an estimate of the actual food intake of an individual as recalled from memory. The collection of the data is however often very complex and time intensive (Yuan et al. Citation2018). Afterwards the data are entered using a nutrition calculation software e.g. NutriSurvey, to calculate the macro- and micronutrient content of the foods. Data input in NutriSurvey requires the entry of each food and the amount consumed in grams, which is a time-consuming process. In addition, results of calculated intake amount of different 24-h-recalls can vary greatly from day to day or seasonally.
This study used a new method, which has been developed to collect and analyse data concerning macro- and micronutrient intake in a faster and easier way. The CIMI methodological approach to estimating inadequate intake of nutrients is based on the input of the cumulative amount of foods in specific food groups rather than individual foods. Data entry in CIMI can be done during the interview, which makes it possible for the interviewer to directly provide feedback to the participant about the individually estimated nutrient intake. This probably increases the motivation for the participant to provide correct and complete data. A study in Ethiopia could show, the CIMI-Ethiopia reduced the data collection time by 25% compared with the conventional 24-h-recalls (Bosha et al. Citation2019a). Furthermore, research projects in Indonesia, Ghana and Ethiopia demonstrated, that the food group-based approach of CIMI produces valid results of macro- and micronutrient intake compared to NutriSurvey (Jati et al. Citation2014; Bosha et al. Citation2019a, Citation2019b; Wald et al. Citation2019).
Therefore, this study aimed to validate the accuracy of the CIMI algorithm in comparison to NutriSurvey using socio-demographic and nutritional consumption data from a Tanzanian population (N = 1010 women). The data were gathered within the two research projects Scale-N and Trans-SEC in two different agro-ecological zones.
Methods
Study design
This study included data from two cross-sectional studies within the projects Trans-SEC (Innovating Strategies to safeguard Food Security using Technology and Knowledge Transfer) and Scale-N (Scaling Up Nutrition: Implementing Potentials of Nutrition-Sensitive and Diversified Agriculture to Increase Food Security). The Trans-SEC study was conducted from January to April 2015 and the Scale-N baseline study from July to August 2016. Data were collected from mothers or caregivers from eight different rural villages, four of them in each of the two districts Chamwino and Kilosa of the Dodoma and Morogoro region, respectively. The study population had a total of 1010 women, 344 from the Trans-SEC and 666 from the Scale-N study.
Socio-demographic, anthropometric and nutritional data were collected from all 1010 women. Body Mass Index (BMI) was calculated and classified according to the WHO categories (WHO Citation1995). The Scale-N study included additional data on serum vitamin A (retinol binding protein), iron status (serum ferritin, soluble transferrin receptor) and serum zinc, measured at the VitMin Lab (Dr. J.G. Erhardt, Willstaett, Germany) using ELISA and photometric methods as previously described (Erhardt et al. Citation2004; Makino et al. Citation1982). Haemoglobin concentrations lower than 120 g/L were set as cut-off values for anaemia (WHO Citation2001). Iron deficiency was defined as ferritin <12 µg/L and/or soluble transferrin receptor (sTfR) >8.5 mg/L (Cook et al. Citation1992), while total body iron stores (IST) were calculated using SF and sTfR in an equation processed by Cook et al.: body iron (mg/kg BW) = - [log10(sTfR x 1000/SF) − 2.8229]/0.1207 (Cook et al. Citation1992, Citation2003). Retinol <1.05 µmol/L was considered indicative of low vitamin A status (WHO Citation2001), while serum zinc <0.66 mg/L was used as cut-off for low/deficient zinc status (Hotz et al. Citation2003).
Dietary assessment
Field surveys with questionnaires on maternal characteristics and dietary intake, including Dietary Diversity scores, FFQ and 24-h-recalls, were conducted. The 24-h-recalls were used for the in-depth evaluation of nutrient intake calculation by the CIMI algorithm, in comparison to NutriSurvey. Each woman was asked to recall all foods she had consumed during the day before the interview. Participants were requested to give quantities and ingredients of all foods consumed, during the whole day (Eleraky et al. Citation2022). Serving sizes were estimated and quantified using standardised plates, spoons and cups.
Nutrient intake calculation with the reference software NutriSurvey
NutriSurvey is a program that analyses the macro- and micronutrient content of individually consumed foods. When NutriSurvey is used, it is necessary to enter each individual food and the exact amount consumed in grams. Nutrient compositions of local foods and dishes were added from the ‘Tanzania Food Composition Table’ (Lukmanji et al. Citation2008). The daily recommended nutrient intake values (RNI) for all micronutrients from the report ‘Human Vitamin and Mineral Requirements’ of a joint FAO/WHO expert consultation in Bangkok, were applied to assess the prevalence of insufficient micronutrient intake (FAO Citation2001; WHO Citation2001). Due to the predominantly plant-based diet in the study area, RNI for low zinc absorption rates and 10% iron bioavailability were applied (De Carli et al. Citation2018; WHO Citation2001).
When foods were added from the ‘Tanzania Food Composition Table’, in which vitamin A contents were provided as retinol activity equivalents, they were converted to retinol equivalents (RE) (Lukmanji et al. Citation2008). In addition, micronutrient contents (RE, Fe, Zn, Ca, Mg) for the local leafy vegetables Mugunda (Corchorus trilocularis) in Kilosa and Ilende (Ceratotheca sesamoides) in Chamwino were analysed by the Scale-N team in the laboratories of the University of Hohenheim (Gowele et al. Citation2017).
Identification of food groups for CIMI
Contrary to NutriSurvey, CIMI evaluates the 24-h-recalls by grouping the individually consumed foods into food groups to reduce data entry. Consumed foods in the two districts were split into 23 different food groups according to the FFQ data of the Trans-SEC sub-sample (FAO Citation2011). Composition of the food groups and contribution of individual foods to the different groups are shown in ().
Table 1. Description of the food groups in CIMI-algorithm.
Food items with high consumption levels, such as the main staple foods, usually form a separate group in contrast to other, less frequently consumed foods. Due to high preference for maize and bulrush millet in the study population, both food items were separated from other foods within the category “other cereals”. Furthermore, food items with high contents of particular nutrients were separated (e.g. vegetables were categorised into provitamin A-rich vegetables and other vegetables). The nutrient profiles of each food group were determined by calculating the average amount of nutrients with regard to the proportionate consumption of the food items in the target region that are aggregated in a specific food group. This was achieved using the following formula,
where Mx is the average content per gram of a nutrient x of a food group; ck is the amount of an individual food item (grams) in the food group consumed, and nxk is the content of nutrient x per gram of the individual food item k.
Statistics
All statistical analyses were conducted with SPSS (Version 27). P values <0.05 were considered as statistically significant. Social demographic data and blood concentrations (haemoglobin, retinol, zinc and iron status) of the Scale-N women were presented by median (interquartile range), range (minimum – maximum), and percentage (number) for categorical and binary data; differences between districts were assessed using Mann-Whitney-U and Chi-Square tests, as appropriate.
The dietary intakes of macro- and micronutrients are given as means, medians and interquartile ranges; the comparisons between CIMI and NutriSurvey were assessed by differences in means, medians, bivariate correlation (Pearson) and Bland-Altman analysis (Bland-Altman plots).
Results
Socio-demographic characteristics for Trans-SEC and Scale-N women
A total of 1010 women of the Trans-SEC (N = 334) and Scale-N (N = 666) surveys, 479 from Chamwino and 531 from Kilosa district, were enrolled for the assessment of their nutritional status. Median age of all participating women was 37 years with a range between 19 and 85 years (). The median weight and BMI were 53.4 kg and 22.3 kg/m2, respectively; both were higher in Kilosa compared to Chamwino. Women in Chamwino were significantly taller, but had a significantly lower BMI than those from Kilosa district. The overall higher proportion of women with overweight compared to underweight (27% vs. 6.8%) was observed, which was in particular evident in Kilosa (32% vs. 5.5%).
Table 2. Socio-demographic characteristics of women who participated in Scale-N and Trans-SEC surveys.
Dietary intake of macro- and micronutrients assessed by CIMI-algorithm vs. NutriSurvey
The differences between the two methods were marginal for most of the nutrients: the difference was <15% of the reference method’s median for energy (1.8%), protein (4.0%), carbohydrates (2.2%), retinol equivalents (1.2%), folic acid (14,4%), vitamin B1 (10.0%), B2 (0.0%), B6 (0.0%), calcium (11.1%), iron (3.6%), and zinc (11.1%). However, calculation of fat and vitamin C by CIMI showed differences in median intake of 24.6% and 70.0%, respectively. Estimation of median nutrient intake was higher in CIMI for energy (26.8 kcal), fat (5.9 g), carbohydrates (5.4 g), retinol equivalents (5.1 µg), vitamin B1 (0.1 mg), vitamin C (13.9 mg) and iron (0.7 mg), whereas the calculated intake of protein (−1.4 g), folic acid (−46.5 µg), calcium (−43.8 mg) and zinc (−0.9 mg) was lower. Regarding vitamin B12, both methods identified a very low average intake (CIMI 0.7 µg, NutriSurvey 1.0 µg), as 70% of all women did not regularly consume animal products ().
Table 3. Comparison of means and medians of energy and nutrient intake calculated by CIMI and NutriSurvey in Chamwino and Kilosa district.
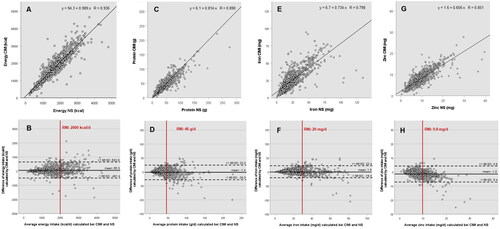
Bland-Altman Plots for energy, protein, iron and zinc were generated according to Giavarina et al. () (Giavarina Citation2015): The CIMI-algorithm and NutriSurvey provided comparable results, particularly at intakes below the recommended amounts. Overall, the calculations showed a negligible dispersion and were mostly within the defined confidence intervals (±1.96 SD), and thus did not contribute to a significantly different micronutrient intake assessment between the two methods.
Figure 1. Scatter plots (upper row) and Bland-Altman plots (lower row) of energy (A,B), protein (C,D), iron (E,F) and zinc (G,H) intake calculated by CIMI and NutriSurvey (NS). Scatter plots include predictive equations, vertical lines in the Bland-Altman plots represent the recommended nutrient intake values (RNI).
Haemoglobin and serum micronutrients of the Scale-N women
Haemoglobin, iron status and serum retinol and zinc concentrations of women who participated in the Scale-N study are summarised in . There was an overall high prevalence of anaemia (28%), iron deficiency (22%) and low serum zinc concentrations (22%) in the study population. In Kilosa, a significantly higher prevalence of anaemia and iron deficiency was measured compared to Chamwino district, but a lower prevalence of low serum zinc.
Table 4. Haemoglobin, iron status (iron stores, serum ferritin and soluble transferrin receptor) and serum retinol and zinc of the women who participated in the Scale-N survey.
Association of micronutrient intake below the RNI with micronutrient deficiencies
The evaluation of CIMI and NutriSurvey with regard to the intake of vitamin A, iron and zinc below the recommended nutrient intake (RNI), and the subsequent diagnosis of anaemia and further biomarkers of micronutrient deficiencies revealed congruent results for both methods. An intake of vitamin A and iron below the RNI was associated with a significantly higher prevalence of anaemia and iron deficiency in both nutrient calculation methods. However, an intake of zinc below RNI was not directly related to lower serum zinc concentrations. The CIMI-algorithm identified slightly more women with a nutrient intake of vitamin A and zinc below the RNI who had anaemia, low serum retinol, or low serum zinc compared to the NutriSurvey software ().
Table 5. Prevalence of anaemia and vitamin A, iron and zinc micronutrient deficiencies in the Scale-N women depending on nutrient intake (vs. < and ≥ RNI) calculated by CIMI-algorithm and NutriSurvey.
Discussion
The overall aim of this study was to evaluate the accuracy of the new food group-based nutrient calculation algorithm CIMI compared to the reference software NutriSurvey with regards to the calculation of macro- and micronutrient intake. Data on dietary intakes (24-h-recalls) of 1010 women from the semi-arid rural Chamwino district and sub-humid rural Kilosa district were assessed, with a special focus on micronutrient intake below the recommended amount (Agency US D I Development E Limited TC Health R Survival C Citation2008).
The accuracy of CIMI was high for energy, protein, carbohydrates and most micronutrients. On the one hand, simplification of nutrient intake assessment by categorising single food items into specific food groups reduces data input, but on the other hand, the risk of deviation in nutrient calculation increases. This was more pronounced for nutrients with a high variation (e.g. vitamin A, vitamin C, folic acid and calcium) in foods belonging to one food group (e.g. ‘green leafy vegetables’, ‘fish’, ‘pulses’ or ‘others fruits’), which showed less accuracy.
This phenomenon was also described by Jati et al. who investigated the food group-based approach in Indonesia (Jati et al. Citation2014) and by Bosha et al. in Ethiopia (Bosha et al. Citation2019b). In the present study, the results of CIMI-algorithm and NutriSurvey for energy, macronutrients and most of the micronutrients, were comparable with regard to the average intake. The lower correlation coefficient of vitamin A (0.512), 0.492 in Chamwino and 0.480 in Kilosa district, was due to the food groups’ concept of CIMI. The food group ‘green leafy vegetables’ in CIMI calculates an average of all green leafy vegetables included in this food group e.g. Mugunda/Ilende (Corchorus trilocularis and Ceratotheca sesamoides), Cowpea leaves and sweet potato leaves. While the leafy vegetables Mugunda/Ilende or cowpea leaves, for instance, are very rich in provitamin A, other green leafy vegetables in the same group, such as cassava leaves or Chinese cabbage, do not contain high amounts of provitamin A. Women from Kilosa reported a high consumption of cowpea leaves, while women from Chamwino had a high intake of Ilende (Ceratotheca sesamoides). The predetermined average of the provitamin A content in the ‘green leafy vegetables’ group leads to an underestimation of vitamin A intake compared to NutriSurvey, which only accounts for the actual consumed leafy vegetables. Similarly, the participants of Kilosa stated consuming ripe bananas and watermelon, but they hardly reported eating oranges. Nevertheless, the group ‘fruits’ in CIMI calculated an average of all fruits included in this food group. Oranges are vitamin C-rich fruits and contribute to 30% of the group’s nutrient composition, which led to an overestimation of vitamin C intake by the CIMI-algorithm in regions where no, or only few oranges were consumed.
Although the CIMI results verged on the calculation of NutriSurvey for most of the micronutrients, some differences in the correlation coefficients occurred between both districts, particularly concerning vitamin C, calcium and iron. With regards to calcium, there was an underestimation of consumption in CIMI results compared to NutriSurvey, especially for the women from Chamwino, who mainly consumed the calcium-rich leafy vegetable Ilende (Ceratotheca sesamoides). This underestimation, similar in the case of vitamin A, is due to the food groups concept of CIMI, which calculates the average of the calcium content of the ‘green leafy vegetables group’, which is clearly lower than the calcium content of Ilende. Ilende was the primarily and almost exclusively consumed green leafy vegetable in Chamwino, but rarely consumed in Kilosa, where multiple other vegetables with varying calcium and iron contents were consumed. The higher correlations in Chamwino with regard to calcium and iron can be explained by the little varied dietary habits of the women from this region, who consumed less food items than the more food diverse women from Kilosa. The low correlation regarding the calcium intake in Kilosa was primarily due to the consumption of sardines (small dried fish with eatable fish bone), which include extremely high amounts of calcium. Consumers of sardines were mainly located in Kilosa district. This led to statistical outliers showing very high calcium intake values in NutriSurvey and lower ones in CIMI, resulting in a weaker correlation for calcium. Nevertheless, the food group-based approach of CIMI is suitable to estimate nutrient intake at the population level.
In order to increase the accuracy on the individual level, further fragmentation of the food groups or optional deselection of not consumed foods within a food group would increase the precision of nutrient calculation. Such a CIMI already exists for Ethiopia, showing high validity, requires less time and is well accepted, by interviewers as well as for interviewed participants (Bosha et al. Citation2019a, Citation2019b).
One of the advantages of CIMI is the fast and simple data input, since only the consumed amounts of the different food groups have to be entered. Results of nutrition analysis are available immediately after the interview, which enables the interviewer to inform participants about possible individual nutrient deficits and available food sources to close the gap (Cook et al. Citation1992). In addition, individual feedback to the participants possibly increases the willingness to participate in such surveys and motivates the participants to provide correct answers.
Our study had some limitations: While the dietary patterns of the Tanzanian population vary greatly, only two agro-ecological zones in Tanzania where included. There are different main staples: maize is preferred in the West and South, millet in the middle and rice in the East. In addition, dietary assessment was only done in rural areas, where the meals are mainly prepared at home. Assessing nutrient intake in urban settings is much more challenging, due to the possibility to buy convenience food or eat out-of-home.
The nutrient intake calculation in our study was based on only one 24-h-recall, which limits the quality of the results. According to Lombard et al. one 24-h-recall analysis is not sufficient to provide valid dietary intake results and more than three 24 h-recalls are required to obtain valid data (Lombard et al. Citation2015). Furthermore, retrospective categorisation of 24-h-recall data into food groups might confound the results. Nevertheless, the CIMI-study in Ethiopia clearly demonstrated that the direct data input in CIMI during the interview, generated comparable results to NutriSurvey and showed a time saving for the interview of 25%, which did not take into account the time needed for classical 24-h-recall data analysis by nutrition software (Bosha et al. Citation2019a).
As our findings have shown, CIMI calculation is prone to over- or underestimation of micronutrient intake due to fixed nutrient profiles for entire food groups. Therefore, identification of individual nutritional gaps by the CIMI-algorithm is less specific. Integration of an option enabling deselection of not-consumed foods in a food group might help to overcome this limitation. However, for rapid population-level assessment of nutrient intakes, the simple food group-based CIMI algorithm is appropriate and a useful tool for generating data needed to plan, implement, and measure the impact of intervention programs.
In conclusion, CIMI is a suitable tool for estimating nutrient intakes in rural Tanzania. Its application provides detailed information on energy, macro- and micronutrient intakes without requiring additional time for data analysis. Therefore, CIMI can be used in place of nutrient diversity assessment, which also does not provide quantitative data on intake of individual nutrients. Additional enhancements to CIMI, such as automatic calculation of percent compliance with nutrient intake recommendations and the ability for respondents to deselect foods within a food group, will further enhance usability.
Authors’ contribution
Conception and design of the study: Wolfgang Stuetz (WS), Constance Rybak (CR), Jan Frank (JF), Hans Konrad Biesalski (HKB), Hadijah Mbwana (HM), Joyce Kinabo (JK), Christine Lambert (CL)
Generation, collection, assembly of data: Laila Eleraky (LE), WS, CR, HM Analysis and/or interpretation of data: LE, WS, CL, JK, HM Drafting/revision of the manuscript: LE, CL, WS, JK, HKB
Approval of the final version of the manuscript: LE, WS, CR, JF, HKB, HM, JK, CL.
Acknowledgements
This manuscript is dedicated to the memory of Dr. Ute Gola (1956–2023), who was an important initiator and supporter of CIMI development. We would like to express our sincere gratitude to all the mothers and caregivers who participated in the study and to the enumerators and field laboratory staff that did a great job during the surveys in the villages. Special thanks go to Dr. J. G. Erhardt, who analysed vitamin A, iron status, and serum zinc, and to Dr. Johanita Kruger for English proofreading and scientific review.
Disclosure statement of interest
No potential conflict of interest was reported by the author(s).
Additional information
Funding
References
- Agency US, D. I., Development E, Limited TC, Health R, Survival C. 2008. Tanzania Marketing and Communication (T-MARC) Project for HIV/AIDS, 410 Reproductive Health and Child Survival Annual Report Project. 1–26.
- Biesalski K. 2014. Hidden Hunger – Consequences for Brain Development. Vatican City: Pontifical Academy of Sciences, Scripta Varia 125. https://www.pas.va/content/dam/casinapioiv/pas/pdf-volumi/scripta-varia/sv125/sv125-biesalski.pdf.
- Bosha T, Desalegn BB, Lambert C, Riedel S, Melesse A, Gola U, Biesalski HK. 2019a. Evaluating nutrient intake of children using an instant digital dietary assessment tool in Sidama, Ethiopia. JNHFSci. 7:1–7.
- Bosha T, Lambert C, Riedel S, Gola U, Melesse A, Biesalski HK. 2019b. Validation of the CIMI-Ethiopia program and seasonal variation in maternal nutrient intake in enset (False Banana) growing areas of Southern Ethiopia. Int J Environ Res Public Health. 16(16):2852. doi: 10.3390/ijerph16162852.
- Cook JD, Baynes RD, Skikne BS. 1992. Iron deficiency and the measurement of iron status. Nutr Res Rev. 5(1):198–202. doi: 10.1079/NRR19920014.
- Cook JD, Flowers CH, Skikne BS. 2003. The quantitative assessment of body iron. Blood, J Am Hematol. 101(9):3359–3364. doi: 10.1182/blood-2002-10-3071.
- De Carli E, Dias GC, Morimoto JM, Marchioni DML, Colli C. 2018. Dietary iron bioavailability: agreement between estimation methods and association with serum ferritin concentrations in women of childbearing age. Nutrients. 10(5):650. doi: 10.3390/nu10050650.
- Erhardt JG, Estes JE, Pfeiffer CM, Biesalski HK, Craft NE. 2004. Combined measurement of ferritin, soluble transferrin receptor, retinol binding protein, and C-reactive protein by an inexpensive, sensitive, and simple sandwich enzyme-linked immunosorbent assay technique. J Nutr. 134(11):3127–3132. doi: 10.1093/jn/134.11.3127.
- Eleraky L, Issa R, Maciel S, Mbwana H, Rybak C, Frank J, Stuetz W. 2022. Anthropometrics, hemoglobin status and dietary micronutrient intake among Tanzanian and Mozambican pigeon pea farmers. Nutrients. 14(14):2914. doi: 10.3390/nu14142914.
- FAO. 2001. Human vitamin and mineral requirements. Report of a joint FAO/WHO expert consultation in Bangkok, Thailand. Food and Nutrition Division. Rome: FAO.
- FAO. 2011. Guidelines for Measuring Household and Individual Dietary Diversity.
- Giavarina D. 2015. Lessons in biostatistics. Biochem Med. 25(2):141–151. doi: 10.11613/BM.2015.015.
- Gowele V, Kirschmann C, Kinabo J, Frank J, Biesalski H, Rybak C, Stuetz W. 2017. Micronutrient profile of indigenous leafy vegetables from rural areas of Morogoro and Dodoma regions in Tanzania. Poster presented at: 3rd International Congress Hidden Hunger; March 20–22; Stuttgart, Germany. doi: 10.13140/RG.2.2.22860.82567/1.
- Gupta SM, Arora S, Mirza N, Pande A, Lata C, Puranik S, Kumar J, Kumar A. 2017. Finger millet: a "Certain" Crop for an “Uncertain” Future and a Solution to Food Insecurity and Hidden Hunger under Stressful Environments. Front Plant Sci. 8:643. doi: 10.3389/fpls.2017.00643.
- Hotz C, Peerson JM, Brown KH. 2003. Suggested lower cutoffs of serum zinc concentrations for assessing zinc status: reanalysis of the second National Health and Nutrition Examination Survey data (1976–1980). Am J Clin Nutr. 78(4):756–764. doi: 10.1093/ajcn/78.4.756.
- Jati IRA, Widmer C, Purwestri RC, Wirawan NN, Gola U, Lambert C, Biesalski HK. 2014. Design and validation of a program to identify inadequate intake of iron, zinc, and vitamin A. Nutrition. 30(11–12):1310–1317. doi: 10.1016/j.nut.2014.03.015.
- Kennedy G, Ballard T, Dop MC. 2013. Guidelines for measuring household and individual dietary diversity. Rome (Italy): Food and Agriculture Organization of the United Nations.
- Kojima Y, Murayama N, Suga H. 2020. Dietary diversity score correlates with nutrient intake and monetary diet cost among Japanese adults. Asia Pac J Clin Nutr. 29(2):382–394. doi: 10.6133/apjcn.202007_29(2).0021.
- Lombard MJ, Steyn NP, Charlton KE, Senekal M. 2015. Application and interpretation of multiple statistical tests to evaluate validity of dietary intake assessment methods. Nutr J. 14(1):40. doi: 10.1186/s12937-015-0027-y.
- Lukmanji Z, Hertzmark E, Mlingi N, Assey V, Ndossi G, Fawzi W. 2008. Tanzania food composition tables. MUHAS-TFNC, HSPH, Dar es Salaam Tanzania.
- Makino T, Saito M, Horiguchi D, Kina K. 1982. A highly sensitive colorimetric determination of serum zinc using water-soluble pyridylazo dye. Clin Chim Acta. 120(1):127–135. doi: 10.1016/0009-8981(82)90083-3.
- Seal AJ, Creeke PI, Mirghani Z, Abdalla F, McBurney RP, Pratt LS, Brookes D, Ruth LJ, Marchand E. 2005. Iron and vitamin A deficiency in long-term African refugees. J Nutr. 135(4):808–813. doi: 10.1093/jn/135.4.808.
- Wald JP, Asare E, Nakua EK, Nohr D, Lambert C, Riedel S, Gola U, Biesalski HK. 2019. Validation of a computer-based analysis tool for real-time dietary assessment within a Ghanaian region. Nfs J. 16:15–25. doi: 10.1016/j.nfs.2019.06.002.
- WHO. 1995. Physical Status: the use and interpretation of Anthropometry. Report of a WHO Expert Committee. Salenstein (Switzerland): Benteli.
- WHO. 2001. Iron deficiency anaemia: assessment, prevention, and control. 35.
- Yuan C, Spiegelman D, Rimm EB, Rosner BA, Stampfer MJ, Barnett JB, Chavarro JE, Rood JC, Harnack LJ, Sampson LK, et al. 2018. Relative validity of nutrient intakes assessed by questionnaire, 24-hour recalls, and diet records as compared with urinary recovery and plasma concentration biomarkers: findings for women. Am J Epidemiol. 187(5):1051–1063. doi: 10.1093/aje/kwx328.