
 ?Mathematical formulae have been encoded as MathML and are displayed in this HTML version using MathJax in order to improve their display. Uncheck the box to turn MathJax off. This feature requires Javascript. Click on a formula to zoom.
ABSTRACT
This study documents the gender salary gap in the auditing profession and explains its development. Using Swedish administrative data from 2007 to 2015 for all Certified Public Accountants (CPAs), I find that the auditing profession’s overall gender salary gap has substantially narrowed during this period, and more female auditors have moved up to the top earnings group, reducing the wide salary gap at the top of the income distribution. Further analysis shows that the increase in female auditors’ client portfolio size accounts for approximately half of the decrease in the total salary gap. I also find evidence that the rise in female leadership in the Big Six firms is positively associated with the increase in female auditors’ client portfolio size. This effect is more pronounced in the middle and bottom half of firms’ hierarchy, suggesting that female representation at the top of a firm’s hierarchy has spillover benefits for lower-ranked female auditors. The implications of this study may help audit firms narrow their gender gaps and cope better with the overall talent challenges of the auditing industry.
1. Introduction
This study examines the development of the salary gap between female and male auditors in recent years and explains what drives the change in the salary gap. Providing evidence on this issue is motivated by the fact that gender inequality has existed for a long time in the auditing profession and remains a serious concern, even though prior literature shows that female auditors deliver higher audit quality and earn an audit fee premium.Footnote1 In recent years, leading audit firms have brought gender equality to the top of their agendas and exerted strong efforts to promote it (Edgley et al., Citation2016; Kornberger et al., Citation2010). However, women continue to be marginalized in audit firms (Almer et al., Citation2021), and such a phenomenon casts doubts on firms’ gender equality initiatives.
The disparity in work pay between men and women is one important way through which gender inequality manifests. For the general population, gender pay gap has narrowed substantially over the past few decades. However, since the 1990s, progress has been noticeably slower in the U.S. and other countries (Blau & Kahn, Citation2017; Darity & Mason, Citation1998; Kleven et al., Citation2019), suggesting that the ‘narrowing of the gender pay gap will not continue into the future’ (Blau & Kahn, Citation2007, p. 8). As gender inequality remains prevalent in the auditing industry, it is important to know the magnitude of the gender pay gap, how the gap has evolved in recent years, and the factors that drive its transformation. To answer these questions, I examine the gap in salaries between male and female CPAs in Sweden from 2007 to 2015 (the terms ‘CPA’ and ‘auditor’ are used interchangeably in the remainder of this paper). I focus on the change in the pay gap over time and its determinants.
The Swedish setting has at least two advantages for this study. First, gender convergence started earlier in Sweden (and other Scandinavian countries) than in the rest of the world. Thus, the Swedish setting may provide evidence on the magnitude of the ‘lower bound’ of the gender salary gap in the auditing profession, and the implications of this study will be of high relevance to the auditing industry in other countries that need to exert more effort to improve female auditors’ position. Second, the observable changes in the gender salary gap in my sample are arguably more specific to the auditing profession per se, rather than due to structural changes in society’s overall gender equality status. This is because major reforms to bring about gender equality in Sweden occurred as early as the 1970s, and gender equality has long been a central norm in the Swedish society (Duvander, Citation2014).
By appealing to administrative data in Sweden from 2007 to 2015, I first document the trend in the profession’s gender salary gap based on a sample of all Swedish CPAs. Overall, I find that the raw gender salary gap narrowed substantially during the sample years: the magnitude of the raw gap in 2015 was less than half of that in 2007. The proportion of female CPAs in the top 1% of the salary distribution also increased significantly from approximately 8% in 2007 to 24% in 2015. To examine the glass ceiling phenomenon, I follow Albrecht et al. (Citation2003) and define the phenomenon as one in which ‘women do quite well in the labor market up to a point after which there is an effective limit on their prospects’ (p. 146). According to Albrecht et al., the existence of a glass ceiling would imply that men and women’s salaries are more equal toward the middle and lower ends of their respective salary distributions but become highly unequal at the top ends of the distributions. My analysis shows that, although the glass ceiling phenomenon in the Swedish auditing profession remained evident in 2007, it had substantially declined by 2015.
Next, to explain the gender salary gap, I use the traditional Oaxaca–Blinder method to decompose, year by year, male-female differences in log salary into the ‘explained’ component and the ‘unexplained’ component; the former is accounted for by differences in individual characteristics, and the latter is often referred to as the discrimination term in the economics literature. I find that, among all the factors that explain the gender salary gap, auditor client portfolio size is the dominant one, explaining 63% and 82% of the total gaps in 2007 and 2015, respectively. Women’s client portfolio sizes increased considerably during this period, which helps explain 48% of the decrease in the total gender salary gap. Additionally, the decrease in the unexplained component also contributes a substantial part of the decrease in the total gap.
The above findings raise the question of what has brought about such a positive development for women in the auditing profession, especially the significant increase in female auditors’ client portfolio size. Both demand- and supply-side factors may drive such a change. Supply-side explanations may stem from improvements in women’s human capital, fewer career interruptions due to childcare, or changes in their productivity and preferences.Footnote2 From the demand side, promoting women to top positions could also play a crucial role. According to the homophily principle, ‘individuals tend to assist and prefer demographically similar individuals, suggesting that female partners will promote gender equality’ (Dalton et al., Citation2014, p. 3). Several studies in economics have shown female leaders’ positive effects on subordinates, firm culture, and the advancement of more female leaders.Footnote3
Regarding female leadership, Matsa and Miller (Citation2011) note that ‘both demand- and supply-related factors are likely operating in concert and may be mutually reinforcing’ (p. 639). In this study, I focus on the demand-side effect for the following two reasons. First, increasing senior female representation is a central theme in large audit firms’ recent communications on gender equality issues (through annual reports and gender gap reports).Footnote4 Second, the overall Swedish society’s gender policy and gender equality status did not significantly change in the sample period. Thus, it is unlikely that there have been substantial changes in women’s risk preferences, psychological factors, or childbirth interruptions that may have caused the decrease in auditors’ gender salary gap.
Given that the increase in female auditors’ client portfolio size explains the majority part of the decrease in the gender salary gap, I examine how the demand-side factors affect female auditors’ client portfolio size. More specifically, I test whether audit firms’ female leadership increases female auditors’ client portfolio size. For this part of the analysis, I use a sample of Big Six auditors from 2000 to 2015.Footnote5 To proxy for female leadership, I use the proportion of women in all the CPAs (in the same firm) who have signed listed company’s audit report(s) in a given year. I find that female leadership significantly increases female auditors’ client portfolio size relative to that of male auditors. Furthermore, using unconditional quantile regressions (Firpo et al., Citation2009), I find that such a positive effect is more pronounced in the middle and bottom of the client portfolio size distribution. This indicates that female leadership has a stronger effect in increasing female auditors’ client portfolio size (relative to male auditors’) at the lower end of a firm’s hierarchy, consistent with the downward flow of the positive gender spillover effect in Kunze and Miller (Citation2017). Overall, my empirical evidence suggests that audit firms’ initiatives to promote women to top positions in recent years may have played an important role in narrowing the disparity between male and female auditors’ client portfolio sizes.
This study contributes to the literature in several ways. First, it provides a broad view of the trajectory of the gender salary gap in the Swedish auditing profession in recent years and offers potential explanations for it. Prior research shows that audit firms’ initiatives to achieve gender equality often do not succeed, despite ‘serious commitment from top-management and the utilization of significant organizational resources’ (Kornberger et al., Citation2010, p. 776). My study suggests that one of the main drivers of the decreasing gender pay gap is the swift increase in female auditors’ client portfolio size, and that such progress is, at least partly, due to the initiatives undertaken by audit firms in promoting more female leaders. The implications of this study should therefore be highly relevant in helping audit firms close the gender pay gap.
Second, the study contributes to the accounting literature by showing that gender bias in auditors’ client portfolio is not only present among audit partners (as shown by Almer et al. (Citation2021) and Hardies et al. (Citation2021)), but also prevalent among lower-ranked CPAs. Future studies on the determinants of female auditors’ career choices and their decision to exit the auditing profession should therefore consider this important factor. In examining the gender salary gap, this study also responds to the call by Lennox and Wu (Citation2018) and Hardies et al. (Citation2021) to conduct more research on gender discrimination in audit firms.
Third, given that there is substantial heterogeneity in the progress of different occupations toward closing the gender pay gap, this study contributes to the labor economics literature. Auditing is a high-skilled, high-income profession in which the decrease in the wage gap is much slower and more difficult than in other occupations; this is, at least partly, due to the high wage penalties for temporal flexibility and the prevalence of overwork (Cha & Weeden, Citation2014; Goldin, Citation2014). By showing the positive gender spillover effect on female auditors’ client portfolio size, this study demonstrates a new perspective on how female leaders affect lower-ranked employees (Flabbi et al., Citation2019; Kunze & Miller, Citation2017; Kurtulus & Tomaskovic-Devey, Citation2011; Tate & Yang, Citation2015).
The remainder of the paper is organized as follows: I review the existing literature in the following section. In the third section, I describe the data sources and present the basic trends in the gender salary gap over the sample period. In the fourth section, I present the research method and descriptive statistics. I present the empirical results in the fifth section. In the final section, I draw the conclusions and discuss the limitations of the study.
2. Literature Review
2.1. Gender Inequality in the Auditing Profession
Both anecdotal and academic evidence suggests that gender inequality in the auditing profession has long existed and is still pervasive.Footnote6 Hardies et al. (Citation2021) and Almer et al. (Citation2021) use archival data to examine gender differences between female and male audit partners’ client compositions in the Belgian and U.S. settings, respectively. They both find that female partners are less likely to be assigned to more prestigious clients. Regarding auditors’ work-related income, empirical studies are scarce (Vandenhaute et al., Citation2020). Only a few studies provide evidence of a gender pay gap among audit partners (Hardies et al., Citation2021; Knechel et al., Citation2013; Vandenhaute et al., Citation2020);Footnote7 however, these studies do not further investigate the determinants of the income disparity between female and male partners and how the gap has evolved over time.
While empirical evidence from prior studies supports the presence of a gender pay gap in the auditing profession, little is known about the size of the gap, how the gap has been developing over time, and why. Moreover, extant studies typically rely on data on a subsample of auditors (such as audit partners), leaving the status for most (especially the lower-ranked) auditors largely unknown. The glass ceiling phenomenon documented by Cohen et al. (Citation2020) suggests that the pay disparity among partners and lower-ranked CPAs are likely to be substantially different. Although prior literature has provided some evidence on gender pay gap at the partner level, understanding the determinants of the pay gap among lower-ranked auditors is at least equally important for audit firms’ talent management. According to the American Institute of Certified Public Accountants’ (AICPA) recent CPA Firm Top Issue Survey, the top challenges for audit firms lie in finding and retaining qualified staff (AICPA, Citation2019b, Citation2021).Footnote8 Gender pay gap may lead to a high turnover rate among female staff (Xu, Citation2008), which is especially severe among lower-ranked staff in the auditing profession (IFAC, Citation2017). The negative effect of high staff turnover on audit quality is demonstrated in Van Linden et al. (Citation2022) and is a concern for regulators (Hanson, Citation2015). Furthermore, gender disparity at the lower levels of a firm’s hierarchy may also deter women from joining the profession (Cohen et al., Citation2020).Footnote9 Thus, understanding the gender equality status of lower-ranked staff in the profession has important implications for addressing key talent management challenges.
2.2. Gender Pay Gap in the General Population
While little is known about the size and development of the gender pay gap in the auditing profession, the labor economics literature may provide some meaningful insights. In this section, I discuss recent findings in labor economics on gender pay gap and their implications for the auditing industry.
2.2.1. A decreasing gender pay gap?
Many economists have demonstrated the converging roles of men and women as well as the narrowing of the pay gap between them (Blau & Kahn, Citation2017; Goldin, Citation2006, Citation2014; Stanley & Jarrell, Citation1998). However, the gap remains large while progress in closing it has slowed down noticeably in recent years (Blau & Kahn, Citation2006; Cha & Weeden, Citation2014). In examining the slowdown in the narrowing of the gender pay gap in recent years, Cha and Weeden (Citation2014) argue that this is mainly due to the increasing prevalence of overwork, especially in professional and managerial occupations.Footnote10 Their study is particularly relevant to the current study because the auditing profession is characterized by long working hours, tight schedules, and numerous deadlines, especially in large firms that serve public companies (Kornberger et al., Citation2010).
Another important reason for the slowdown in the decrease in the gender pay gap is job inflexibility (Goldin, Citation2014).Footnote11 Kornberger et al. (Citation2010) corroborate this view in the auditing setting. Through a field study of one Big Four firm’s flexibility work initiative to enhance the progression and retention of talented women, Kornberger et al. demonstrate that the main reason for the ultimate failure of the initiative is that the organization perceives ‘flexible working’ as committing to ‘part-time’ work and not being ‘serious’ about one’s career.Footnote12
Overall, prior literature in labor economics suggests that, although the overall gender pay gap has decreased in the past decades, the progress has slowed down, and its changes in more recent times are heterogeneous across occupations. In occupations where job flexibility is costly and the workload is high, it is more challenging to reduce the gender pay gap. Such findings cast doubt on whether the auditing profession’s gender pay gap has indeed decreased, and the results of this study shed some light on this issue.
2.2.2. Factors explaining the gender pay gap
To explain the gender pay gap, earlier work in labor economics focused on traditional factors including education, labor force participation and experience, and differences in occupations and industries. However, despite women’s advancements in these aspects over the past decades, there remains a sizable ‘unexplained’ component in the total pay gap. This unexplained part is often interpreted as labor market discrimination; however, it could also be attributable to unobservable differentials between men and women, such as psychological attributes, noncognitive (soft) skills, and preferences for risk and competition (Marianne, Citation2011).
According to Blau and Kahn (Citation2017), occupational segregation and industry differences account for the largest part (approximately one half) of the gender pay gap. However, even within the same occupation or industry, women still fare substantially worse than men.Footnote13 The scarcity of female leadership in the corporate arena has attracted much attention in labor economics research, while ample studies have shown evidence indicating the presence of a ‘glass ceiling’ that blocks women’s progress to the top (Addison et al., Citation2014; Albrecht et al., Citation2003; Matsa & Miller, Citation2011; McCue, Citation1996; Weyer, Citation2007).
Matsa and Miller (Citation2011) argue that demand-side and institutional barriers are important factors contributing to the glass ceiling. This is because corporate leadership has historically been dominated by men, who may ‘tacitly discriminate or stereotype by sex’ (p.635); the absence of women at the top – especially in male-dominated professions – may also lead to hysteresis that prevents women from accessing key networks and same-sex mentors (Athey et al., Citation2000). According to the homophily principle, individuals tend to form same-sex network relationships (Ibarra, Citation1992). Thus, increasing female representation at the top may exert a positive spillover effect on women at lower management levels.Footnote14
Consistent with the labor economics literature, a line of research in auditing – mainly based on qualitative approach – also shows that the existence of the glass ceiling is closely related to audit firm leadership and culture. The traditional culture of audit firms is clearly incompatible with society’s move toward diversity and equality over the past decade.Footnote15 Responding to this trend, audit firms are taking steps to transform their professional identity. However, the consequence of such a transformation has not been studied in-depth in the auditing literature,Footnote16 and there is no large-scale, quantitative examination of the implications of audit firms’ shift toward diversity and equality. Overall, little is known in the auditing literature about the magnitude of auditors’ gender pay gap, its development over time, what factors contribute to the gap, and the outcome of firms’ initiatives in promoting diversity and gender equality in recent years. In this study, I attempt to fill this void in the literature.
3. Data and Basic Trends in the Gender Salary Gap
3.1. The Main Sample
The data used in this study are from several sources: the Swedish Inspectorate of Auditors (SIA; Revisorsinspektionen), the Swedish Tax Agency (STA), and the Serrano database. I obtained the list of Swedish CPAs from 2000 to 2015 from the SIA. On average, there were approximately 4000 registered CPAs working in Sweden each year during the sample period (6877 unique auditors).Footnote17 Approximately 34% of CPAs were women (2349 female CPAs). Figure F-1 in the online appendix shows that the proportion of female auditors in this period steadily increased in the overall profession. Table presents a full view of the sample construction process.
Table 1. Sample construction.
One limitation of these data is that the quality of the source file does not allow me to accurately map all CPAs to their affiliated audit firms’ unique organization registration number. Nevertheless, I perused the entire data file and manually inspected the Big Six firms and their auditors. The Big Six firms include PricewaterhouseCoopers, EY, KPMG, Deloitte, BDO, and Grant Thornton.Footnote18 I obtained the salary data from Checkbiz, a data provider company. The dataset covers auditors’ income data retrieved from the STA for the years 2007Footnote19 to 2015. During this period, the total number of CPAs in Sweden was 5533, of which 1920 were women.Footnote20 After merging the SIA and income data, there are 33,931 auditor-year observations from 2007 to 2015. I hereafter refer to this sample as the main sample.
3.2. Data on Auditors’ Client Information
To explain the gender salary gap as well as its trend, I use the Serrano database to obtain information on individual auditors’ specific career-related characteristics.Footnote21 This dataset allows me to retrieve company-auditor pair matches for all Swedish limited liability companies. For the main sample with 33,931 observations (5044 CPAs), I could identify client-specific information for 31,647 observations (4846 CPAs) from 2007 to 2015. In the last set of my empirical analyses, I also examine the association between female leadership and auditors’ client portfolio size in the Big Six audit firms. For this set of tests, income data are not required; therefore, the sample period is from 2000 to 2015. Merging the data from the SIA and Serrano yields a sample of 30,683 individual-year observations.
3.3. Basic Trends in Gender Salary Gap
Table , Panel A, presents the basic trends in the gender salary gap based on raw income data. A summary of variable definitions is presented in the appendix. The mean value of male CPAs’ salaries (SALARY) is approximately 16.9% higher than that of female CPAs.Footnote22 In Panel B, I present the t-test results between female and male CPAs’ log salaries (LN_SALARY) on a yearly basis. Female CPAs’ salaries are significantly lower than male CPAs’ each year, but the gap decreases over time.Footnote23 In the online appendix, Figure F-2, I present this trend by plotting the mean value of female and male CPAs’ mean salaries by year.
Table 2. Basic trend in female and male auditors’ salaries.
Table , Panel A, also shows that, at the lower end of male and female CPAs’ respective salary distributions, the salary difference is smaller. However, as we move toward the top ends of the salary distributions, the gap becomes much wider.Footnote24 This phenomenon indicates a glass ceiling within the auditing profession: male and female auditors’ salaries are more equal toward the middle and lower ends of their respective salary distributions but highly unequal at the top ends of the distributions. Following Albrecht et al. (Citation2003), I present some basic findings related to the glass ceiling phenomenon in Figure , which plots the log salary difference at each percentile in male and female CPAs’ respective salary distributions for 2007, 2010, and 2015. There are two important features concerning the 2007 plot: (1) the salary difference between female and male CPAs is relatively stable until approximately the 90th percentile, and (2) there is a steep acceleration in the gender salary gap starting from approximately the 90th percentile. This aspect of the gender gap by percentile is interpreted as a glass ceiling in the labor economics literature (Albrecht et al., Citation2003; Blau & Kahn, Citation2017).
Figure 1. Log salary difference, male – female at each percentile.
Notes: Figure presents three graphs showing the log wage difference between male and female CPAs in the auditing industry. The gap is calculated as male CPAs’ log salary (LN_SALARY) at each percentile of the male CPAs’ salary distribution minus female CPAs’ log salary at the corresponding percentile of the female CPAs’ salary distribution. The figure plots the gap for 2007, 2010, and 2015 separately.
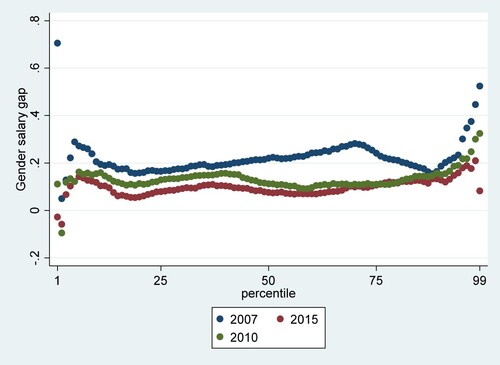
However, the pattern that is characteristic of 2007 is not observed for the 2015 plot. Most importantly, the 2015 plot does not present a peak toward the top end of the salary distribution. Although the gap seems to increase from approximately the 90th percentile, the shift is much milder and even reverses at the very top – the sharp increase observed in the 2007 plot is not present in the 2015 plot – suggesting a diminishing glass ceiling effect. Another notable difference between 2007 and 2015 is that the plotted line for 2015 is well below the 2007 line over the entire salary distribution. The log salary difference in 2007 hovers around 0.2, whereas, in 2015, the difference is around 0.1. This suggests that, overall, the gap between male and female CPAs’ salaries has narrowed substantially over the years. Furthermore, I insert the same plot for the year 2010, which clearly lies between the 2007 and 2015 plots, indicating that the gender salary gap has been gradually decreasing. Another relatively new way to track women’s progress is to compare the evolution of their shares in top-income groups to the overall female share in the labor market. Using an approach similar to Kopczuk et al.’s (Citation2010), I find that the proportion of female auditors in the top 1% income group increased from 8% in 2007 to 24% in 2015. I present this part of the analysis in the online appendix (A2).
Overall, the basic trend presented in this section suggests that (1) the Swedish auditing profession’s overall gender salary gap decreased during the sample period; (2) more women progressed to the top-income group, which substantially reduced the large salary gap toward the top of the salary distribution; and (3) the overall gender salary gap remained evident in 2015.
4. Research Method and Descriptive Statistics
4.1. Research Method
4.1.1. Estimating the gender salary gap
To estimate the magnitude of the gender salary gap, the basic OLS regression model is specified as follows:
(1)
(1)
The main dependent variable is log salary (LN_SALARY) for auditor i in year t. The key research variable, FEMALE, is an indicator variable equal to one if the auditor is a woman, and otherwise zero. The control variables in vector X include auditors’ individual and firm characteristics, described in detail below. For the basic control variables in X, I include factors widely used in log wage regressions from prior labor economics literature. These variables are as follows: auditor age (AUD_AGE), age squared (AUD_AGE2), and the geographical region where the auditor works (REGION).Footnote25 I divide Sweden into nine geographical regions.Footnote26 Education is universally used in log wage regressions but, unfortunately, the related data are not available from my data source. Nevertheless, the variation in auditors’ education level should be minimal in my sample because the requirement to become a qualified CPA in Sweden is very stringent. Until June 2013, Sweden had a two-tier CPA system, which classified a CPA license as either ‘approved auditor’ (godkänd revisor) or ‘authorized auditor’ (auktoriserad revisor).Footnote27 Controlling for the CPA license type for the pre-2013 data will, at least partly, account for the potential effect of education and experience on auditors’ salaries. It is also common in the labor economics literature to control for cognitive ability and work experience. For the period from 2002 to 2013, the SIA provided CPA exam scores of newly qualified CPAs (the lower-tier, approved auditor exam) as well as the year in which they received the CPA license. For one specification, I control for auditors’ CPA exam scores (CPAEXAM_SCORE) and the time since they obtained the license (TENURE) to proxy for their cognitive ability and work experience, respectively.
I further add the following control variables that relate to auditors’ career-wise characteristics: PTF_SIZE, LN_NAUDITS, FOCUSIND, EXPERT, SANC, and LISTED_AUDITOR. LN_NAUDITS and PTF_SIZE are winsorized by year at the 1st and 99th percentiles. I describe these control variables in detail below. To measure auditors’ client portfolio size, I construct a variable, PTF_SIZE, which is the natural logarithm of the total client sales for auditor i in year t. LN_NAUDITS is the natural logarithm of the total number of clients for auditor i in year t. Focused industry (FOCUSIND) is the industry in which auditor i has the largest total client portfolio size (measured by client sales) in year t. I control for this variable because prior literature finds that occupational segregation is an important factor in explaining the gender gap (Bishu & Alkadry, Citation2017; Miller et al., Citation2004). Although occupational segregation may not be a concern for this study (because the sample comprises auditors only), prior literature shows that women do not gain equal access to all areas of practice within accounting firms as their male counterparts (Khalifa, Citation2013).
I follow Chi and Chin (Citation2011) in defining auditor industry expertise (EXPERT).Footnote28 I set the indicator variable, EXPERT, to one if an auditor is identified as an industry expert for at least one industry in a year and zero otherwise. To capture an auditor’s quality of work, I include an indicator variable, SANC, set to the value of one if an auditor received a disciplinary sanction in a given year, and zero otherwise. I also include an indicator variable, LISTED_AUDITOR (set to one if the auditor has signed at least one listed company’s audit report in a year, and zero otherwise), to proxy for partnership positions.
For analyses of Big Six auditors’ gender salary gap, I also include audit firm characteristics in the regression. As described earlier, I could accurately map auditors from the Big Six to their affiliated firms and retrieve firm-level information. Therefore, in the estimation for the main sample, I include a Big Six indicator (BIG6) to control for audit firm type. When I focus on the Big Six firms only, I include in Model (1) the following control variables: the natural logarithm of an audit firm’s total assets in year t (LN_ASSET_AUDFIRM), natural logarithm of an audit firm’s total sales in year t (LN_REV_AUDFIRM), and an audit firm’s return on assets (ROA_AUDFIRM) in year t. To capture audit office characteristics, I calculate the natural logarithm of aggregated client portfolio sizes (LN_OFFICE_PTF) for all auditors in the same office. In some specifications, I also present results with audit firm and audit office fixed effects. A full description of the variable definitions is provided in the appendix.
4.1.2. Effect of female leadership on client portfolio size
To examine the association between female leadership and auditors’ client portfolio size in the Big Six firms, I use OLS estimation based on the following model for the period from 2000 to 2015:
(2)
(2)
In Model (2), the research variables are female leadership (FEM_LEAD) and FEMALE * FEM_LEAD. To proxy for firm level female leadership, I use the proportion of women in all CPAs (at firm j in year t) who have signed at least one listed company’s audit report. The control variables in vector X are similar to those in Model (1); however, I exclude variables that are highly correlated with client portfolio size, such as LN_NAUDITS and EXPERT. To account for the potential effect of any changes in the increase in female auditor supply, I control for the proportion of female CPAs in an audit firm (FIRM_FEM_PCT) or audit office (OFFICE_FEM_PCT) each year. I also control for LN_OFFICE_OTHERPTF – the total client portfolio size for auditor i’s audit office, excluding auditor i’s clients – to account for the effect of audit office size on individual auditors’ client portfolio size. I also include firm fixed effects and indicators for the year, region, and the focused industry in the estimations. Standard errors are clustered at the individual level.
4.2. Descriptive Statistics
In Table , I present detailed descriptive statistics for the main sample, with all the years from 2007 to 2015 pooled together. Client portfolio size (PTF_SIZE), which is the natural log of total client sales, is on average 19.82 in the main sample, but there is a steady and sizable increase over the years (the mean values of key control variables for 2007, 2011, and 2015 as well as other variables used in Model (2) are presented in the online appendix, Table A-1). The descriptive evidence also shows that female CPAs have substantially fewer clients (NAUDITS),Footnote29 and are less likely to be ranked as industry experts (EXPERT) in the sample; however, both variables exhibit a steady increase for women over the sample period. The propensity to receive a disciplinary sanction is lower for women than for men, consistent with female auditors provide higher quality audits (note also that women engage with smaller client portfolios, which may reduce the likelihood of being sanctioned). Tables and and Table A-1 suggest two main points: (1) female CPAs’ salaries remain lower than male CPAs’, although the gap decreases from 2007 to 2015, and (2) female CPAs’ career positions are improving in aspects such as client portfolio size and becoming industry experts.
Table 3. Descriptive statistics.
5. Empirical Results
5.1. Gender Salary Gap: Size and Trend
In this section, I present results from the OLS estimation based on Model (1). In Table , Panel A, I first use the main sample, which includes all auditors with available income data from 2007 to 2015. In Column (1), I only include the basic control variables plus region and year fixed effects to account for general trends in salary increases. The size of the gap is −0.169 log points, or a difference of approximately 16%, on average (female less male). Column (2) further includes audit firm type (BIG6) and an indicator of whether an auditor received sanction in a year (SANC). Although the coefficients on BIG6 and SANC are both significant, including them in the model does not substantially change the estimated coefficient on FEMALE.
Table 4. Gender salary gap: OLS estimation.
In the labor economics literature, two other common variables used to explain the gender pay gap are cognitive ability and work experience. As described earlier, for auditors who passed the CPA exam (lower-tier) from 2002 to 2013, I could identify their CPA exam scores (CPAEXAM_SCORE) and the time since they obtained the CPA license (TENURE). In Column (3) of Table , I present the estimated results for this small sample with 8379 individual-year observations, controlling for CPAEXAM_SCORE and TENURE. Although higher exam scores and longer experience are positively associated with salary, the FEMALE coefficient remains largely the same as in Columns (1) and (2).Footnote30
As described in the first and second sections, prior literature also shows that men dominate the auditing industry, and that women rarely appear at the top of firms’ hierarchies. Auditors’ job ranks and other career-related variables are potentially subject to gender discrimination and are therefore endogenous. Nevertheless, for Columns (4) to (7) in Table , I gradually incorporate auditors’ other career-related variables to examine the adjusted gender salary gap. First, in Column (4), I present the estimated results for auditors whose client information is identifiable, based on the same model specification used in Column (2). The estimated gap in Column (4) is only slightly smaller than in Column (2). Furthermore, in Column (5), I include client portfolio size (PTF_SIZE), number of clients (LN_NAUDITS), and the industry expert indicator (EXPERT). In combination, these variables seem to explain away half of the gap shown in Column (4), and the R-squared increases considerably from 0.145 to 0.212. In Column (6), I use the main sample but limit the period from 2007 to 2013, when the two-tier CPA system was in place. Controlling for the CPA license type, which captures differences in professional experience and education, does not seem to affect the estimated salary gap in Column (5). In Column (7), I use the sample for the whole period from 2007 to 2015 and further include the indicator variable, LISTED_AUDITOR; nonetheless, the estimated coefficient on FEMALE remains largely the same as in Column (5).
In Panel B of Table , I perform the same OLS estimation as in Panel A, Column (7), separately for each year to demonstrate how the salary gap has evolved over the period. For brevity, I present the estimated coefficients only for 2007, 2009, 2011, 2013, and 2015. In line with the development of the raw salary gap as presented in Table , the results in Panel B of Table show a steady decrease in the estimated salary gap.Footnote31
It is also appealing to analyze the gender salary gap in the Big Six firms, because inferences based on these firms are arguably more generalizable to other settings. The results from analyzing Big Six firms show that (1) Big Six firms exhibit a wider gender salary gap than non-Big Six firms, (2) career-related characteristics could also explain a large part of the total salary gap in Big Six firms, and (3) the gender salary gap in these firms decreased significantly over the sample period. For brevity, I present this part of analysis in the online appendix (A3).
In the subsection ‘Basic trends in gender salary gap’ of the third section, I use basic descriptive data to illustrate the glass ceiling effect, especially in the earlier years of the sample. Following Albrecht et al. (Citation2003), I also conduct quantile regressions to analyze the size of the gender salary gap across the salary distribution. In line with Figure , quantile regressions show that in 2007, even after including career-related control variables, the remaining gap is much larger at the top of the salary distribution than in the middle and the lower tail.Footnote32 However, in 2015, the estimated coefficients on FEMALE at the 95th and 90th percentiles are no longer significantly different from zero. The trend is very similar for the Big Six firms, although the magnitude of the gap is larger than for the overall sample across the salary distribution. For brevity, I do not tabulate the quantile regression results. Combined, the empirical evidence in this section suggests the following: (1) the overall gender salary gap in the Swedish auditing profession decreased considerably from 2007 to 2015, (2) Big Six firms exhibit a larger gender salary gap than other firms, consistent with Goldin (Citation2014) who suggests that the wage penalty for women in large, high-powered firms is higher than for men, and (3) there is a substantial decrease in the wide salary gap at the top of the salary distribution, suggesting that the glass ceiling effect is diminishing.
5.2. Potential Limitations in the Estimation and Robustness Check
In labor economics research on gender-related topics, selection bias and endogeneity concerns are two important issues that may bias the estimated gap. The most common definition of wage discrimination in labor economics is the difference in wages for equally productive workers (Becker, Citation2009). Since productivity is difficult to measure, economists typically employ human capital characteristics such as education, experience, and job rank to reflect the potential productivity level (Kunze, Citation2008). However, these variables are potentially endogenous because they may reflect discrimination (Kunze, Citation2008; Weichselbaumer & Winter-Ebmer, Citation2005). In this regard, auditors’ client portfolio size and other career-specific variables are likely to be endogenous. Furthermore, selection issues are also likely to bias women’s salaries than men’s (Blau & Kahn, Citation2017). For a woman, selecting into the auditing profession and finally reaching the top may be more challenging than for a man because the profession is male-dominated. The estimated salary gap in this study, especially when auditors’ career-related characteristics are controlled for, may therefore underestimate the real gap due to these concerns.
To mitigate, at least partly, the potential bias in the estimated gap, I conduct two sets of analyses as robustness checks, using newly qualified auditors and audit partners, respectively. I find that, even within the same rank – where auditors’ professional experience and knowledge should be closer – there remains a sizable salary gap. I present detailed results for robustness check in the online appendix (A4).
5.3. Decomposing the Gender Salary Gap
To further explore factors that could explain the gender salary gap, I use the Oaxaca–Blinder (OB) decomposition method (Blinder, Citation1973; Oaxaca, Citation1973). The OB method separates male/female differences in log salary into the ‘explained component’ (accounted for by differences in observable characteristics) and the ‘unexplained component.’ The unexplained component is often referred to as the discrimination component (equally qualified women receive less pay than men for the same work) in the labor economics literature. However, other unobservable/unmeasurable differences could also drive the gap, such as psychological/personality traits, productivity, and risk preferences (Blau & Kahn, Citation2017).
I present the results of OB decomposition for the years 2007, 2011, and 2015 in Table . I present the aggregated effects for most explanatory variables controlled for in the OLS estimations due to the large number of indicator variables (region and focused industry indicators) and the dominant effect from auditors’ client portfolio size.
Table 5. Blinder-Oaxaca decomposition of the gender salary gap: 2007, 2011, and 2015
For the year 2007, the total salary gap is 0.2159 log points (male less female),Footnote33 of which 63.1% (0.1361 log points) can be explained by auditors’ client portfolio size (PTF_SIZE). The fraction explained by other characteristics (grouped for brevity) is relatively small.Footnote34 In 2011, one can observe that the total gap decreases substantially, and client portfolio size retains a significant role in explaining the total gap (67.3%).Footnote35 The total unexplained gap also significantly decreases, suggesting that the impact of the ‘discrimination’ factor is lessening. Year 2015 further shows a reduction in the total gap (0.0968 log points), while PTF_SIZE now explains 81.7% of the total gap. Overall, this evidence shows that women’s improvements in PTF_SIZE from 2007 to 2015 narrows the gender salary gap by 0.057 (0.1361–0.0791) log points, or 48% of the decrease in the total gender salary gap (calculated as 0.057/(0.2159–0.0968)).Footnote36 For the Big Six firms, I find similar results from decomposing the gender salary gap. For brevity, I present detailed results for the Big Six in the online appendix (A5).
5.4. Effect of Female Leadership on Auditors’ Client Portfolio Size
The decomposition exercise in the previous section shows that auditors’ client portfolio size is a key factor in explaining the female-male salary difference. Over the sample period from 2007 to 2015, the reduction in the gap between female and male auditors’ client portfolio sizes explains approximately half of the total decrease in the salary gap. As discussed in the introduction section, both the demand and supply sides could play a role in such a change, but I focus on examining the demand side forces. In the online appendix (A1), I present a summary of Big Six firms’ disclosures of their gender equality initiatives focusing on promoting female leaders. This anecdotal evidence indicates that audit firms are aware of the unbalanced gender representation at the top of their hierarchies and are trying to promote female employees to senior levels. Indeed, as shown in Figure F-5 in the online appendix, in the early 2000s, approximately 10% of the Big Six board members were female, whereas by 2017, this figure was close to 40%.Footnote37 Likewise, more female CPAs are leading the prestigious task of auditing public listed companies: of all the Big Six CPAs that signed a listed company’s audit report, approximately 7% were female in 2000, and the proportion rose to 18% in 2015.
In this section, I examine whether the rise of female leadership in the Big Six firmsFootnote38 is associated with larger client portfolio size of female auditors. I use the proportion of female CPAs that signed at least one listed company’s audit report in a firm (FEM_LEAD) to proxy for female leadership. The OLS regression is based on Model (2), and the results are reported in Table . Audit firm fixed effects are incorporated in all specifications, and standard errors are clustered at the individual level.
Table 6. Female leadership and auditors’ client portfolio size in the Big Six.
In Column (1) of Table , the estimated coefficient on the interaction term, FEMALE*FEM_LEAD, indicates that the effect of female leadership on auditors’ client portfolio size is significantly higher for female than for male CPAs. For male auditors, the coefficient on FEM_LEAD is −0.007, indicating that one percentage point increase in FEM_LEAD is associated with approximately 0.7% decrease in client portfolio size for male CPAs. However, a one percentage point increase in FEM_LEAD is associated with approximately 2% higher client portfolio size for female auditors.
Next, I split the sample by the median value (33.3%) of the share of females in audit offices of the Big Six firms (OFFICE_FEM_PCT). Estimation in Column (2) is based on auditors who work in the ‘Low’-female share group, whereas Column (3) includes auditors who work in the ‘High’-female share group. The estimated coefficients on the interaction terms in Columns (2) and (3) thus indicate that female leadership at the firm level is more important for female auditors who work in a more male-dominated environment.
One potential concern in this set of analyses is the mechanical relationship between FEM_LEAD and women’s client portfolio size (PTF_SIZE), because as more female CPAs are being promoted to audit listed clients (which are larger than private clients), their client portfolio sizes may naturally grow. To alleviate this concern, I present results from an estimation using a sample of auditors who do not have any listed clients in Column (4). In Column (5), I present the result for auditors who have at least one listed client in a year. The results in Columns (4) and (5) show that the positive effect of female leadership remains strong and positive for lower-ranked auditors – consistent with the gender spillover effect flowing to lower-ranked CPAs.
In Panel B of Table , I further present the female leadership effect across the client portfolio size distribution based on unconditional quantile regression estimations (Firpo et al., Citation2009). For brevity, only the coefficients for the interaction term are tabulated. The results in Panel B suggest that the positive spillover effect of female leadership is strongest in the middle and lower half of the client portfolio size distribution. This result also alleviates the concern that female CPAs’ client portfolio size and the female leadership proxy are mechanically related. In untabulated tests, I use two more measures to proxy for female leadership: (1) the proportion of women in the Big Six board rooms and (2) the proportion of female CPAs in all the CPAs who have signed at least one listed client’s audit report at an audit office. The coefficients of the interaction terms between FEMALE and each of these two proxies are both positive and statistically significant at the 1% level.
In summary, the results in Table suggest that, to reduce the gender salary gap, increasing female representation at the top might be a beneficial approach. Previous studies examining how female corporate leaders affect lower-ranked workers show that female subordinates are more likely to be promoted and earn higher pay when the manager in power is also female (Kunze & Miller, Citation2017; Kurtulus & Tomaskovic-Devey, Citation2011; Matsa & Miller, Citation2011; Tate & Yang, Citation2015). To the extent that such findings are generalizable to the auditing environment, the positive effect of promoting more women to the top of audit firms’ hierarchies is likely to be broader than merely increasing female CPAs’ client portfolio sizes.Footnote39 When there are more female role models in a firm or an office, other women in the firm may become more motivated to stay in the profession, obtain easier access to business networks, and feel more confident. These are all potential and vital changes that have led to the substantial decrease in the gender salary gap, but I leave these intriguing questions to future studies due to the current data limitation.
5.5. Supplementary Tests on the Determinants of Auditors’ Decisions to Exit the Profession
As practitioners and policymakers have expressed concerns about the challenge in retaining/attracting talent for the auditing profession, it is naturally important to examine the determinants of auditors’ decisions to exit the profession. In supplementary analyses, I find that female auditors are less likely to leave the auditing profession conditioned on having the same level of client portfolio size as their male counterparts. Thus, the high departing rate of female CPAs – a phenomenon that has long concerned audit firms and policymakers – is perhaps partly due to the fact that female auditors do not have equal job opportunities (manage the same level of client size) as their male counterparts. For brevity, I present the results of this analysis in the online appendix (A6).
6. Discussion and Conclusion
In this study, I document the development of the gender salary gap in the Swedish auditing profession in recent years. The main finding is that the salary gap between men and women in the auditing profession narrowed substantially over the sample years. From 2007 to 2015, female CPAs’ client portfolio size increased considerably, which explains approximately half of the decrease in the overall salary gap. Regarding the driver of this change, anecdotal evidence suggests that promoting more women to the top of the firm hierarchies has been the focus of the Big Six firms’ gender equality initiatives in recent years. My empirical evidence suggests that female auditors, especially those at the lower end of firms’ hierarchies, may have indeed benefited from increased female leadership. The implications of the study should be important for the auditing profession in further closing the gender pay gap and better coping with the acute talent challenges that most firms presently face.
This study has several limitations. First, as a large part of the gap in my study is ‘unexplained,’ it is difficult to identify the actual driver of the decrease in this part of the gap. More detailed data on individual productivity, psychological attributes, or firm culture will help to further analyze the unexplained gap. Future studies on this topic based on data from other countries – where the gender pay gap is likely to be larger – will provide important insights into this topic. Second, client portfolio size (PTF_SIZE), the variable that explains a large part of the gender salary gap, is susceptible to the ‘discrimination’ factor. Thus, the estimated gap is likely to be downward biased in this respect. Third, an intriguing observation from my study is that the Big Six firms show a larger gender salary gap than other firms. This might be due to Big Six firms’ more complex hierarchies, tighter schedules, higher demand for interaction with clients (who are also likely to be male-dominated public companies), and a more intensive working environment. Future work addressing these issues should be of great importance to the profession.
Supplemental Research Materials
Supplemental data for this article can be accessed online at https://doi.org/10.1080/09638180.2022.2113550.
Online Appendix A1: How Big Six firms communicate their initiatives to promote women.
Online Appendix A2: Female share in top income groups.
Online Appendix A3: Gender salary gap in the Big Six firms.
Online Appendix A4: Robustness tests.
Online Appendix A5: Decomposing the gender salary gap among the Big Six auditors.
Online Appendix A6: Supplementary tests on the determinants of auditors’ decisions to exit the profession.
Online Appendix, Tables, A-1 to A-5.
Online Appendix, Figures, F-1 to F-5.
Online_supplemental_materials.docx
Download MS Word (129.8 KB)Acknowledgements
The author is deeply grateful for the helpful comments and suggestions from Beatriz Garcia Osma (editor) and two anonymous reviewers, as well as the support and advice from her PhD committee members: Henrik Nilsson (chair), Edward Lee, and Ann Vanstraelen. The author also wishes to thank Daniel Aobdia, Juha-Pekka Kallunki, Anna Dreber Almenberg, Florian Eugster, Kenth Skogsvik, Mariya Ivanova, Martin Jacob, Karolis Ramoska, Milda Tylaite, Antonio Vazquez and seminar participants at Maastricht University, the First Labor and Accounting Conference, Stockholm School of Economics, the Swedish Inspectorate of Auditors (Revisorsinspektionen), and the FIRE workshop for their helpful comments. The author wishes to thank the Swedish Inspectorate of Auditors for providing the data and the generous funding from the Torsten Söderberg Foundation, the Iwar Sjögrens Foundation, Mistra Center for Sustainable Markets (Misum), the Swedish Bank Research Fundation (BFI), Handelsbanken, and the Jan Wallanders and Tom Hedelius Foundation (Jan Wallanders och Tom Hedelius stiftelse).
Disclosure statement
No potential conflict of interest was reported by the author(s).
Additional information
Funding
Notes
1 See, for example, Abdelfattah et al. (Citation2021), Almer et al. (Citation2021), Bustos-Contell et al. (Citation2022), and Hardies et al. (Citation2021).
2 See, for example, Albrecht et al. (Citation2015), Keloharju et al. (Citation2022), Miller (Citation2011), Bolotnyy and Emanuel (Citation2022), Matsa and Miller (Citation2011), and Niederle and Vesterlund (Citation2007).
3 For example, Athey et al. (Citation2000) show that female superiors may mentor female subordinates better and serve as role models and advocate for lower-ranked females. Female leaders also cultivate more women-friendly cultures within their firms (Tate & Yang, Citation2015). Furthermore, Matsa and Miller (Citation2011) document that women in corporate leadership roles can help other women to advance to top management positions; Kunze and Miller (Citation2017) also show evidence supporting the notion that female leadership can have positive spillover effects on women in lower ranks of the same firm.
4 I present, in the online appendix (A1), a summary of the Big Six firms’ recent statements regarding their attempts to increase female representation at top levels.
5 Due to data limitation, I can only identify Big Six firms’ CPA job affiliations and their office locations.
6 Leading audit firms in the UK and Australia have recently reported large gender pay gaps (Deloitte, Citation2018; EY, Citation2020; KPMG, Citation2017; PwC, Citation2020). Professional accounting bodies and audit firms have also raised concerns about gender inequality and its detrimental effects on talent management (AICPA, Citation2019a; Deloitte, Citation2011; Echevarria, Citation2012; International Federation of Accountants [IFAC], Citation2021; Franzel, Citation2014). In the accounting literature, many studies have documented the gendered nature of public accounting, including Adapa et al. (Citation2016), Almer and Single (Citation2007), Anderson-Gough et al. (Citation2005), Barker and Monks (Citation1998), Cohen et al. (Citation2020), Dalton et al. (Citation2014), Edgley et al. (Citation2016), Hull and Umansky (Citation1997), Kornberger et al. (Citation2010), and Lupu (Citation2012).
7 For example, Knechel et al. (Citation2013) focus on the determinants of Big Four partners’ compensation. In their regression analyses based on a sample of Big Four audit partners in Sweden, the FEMALE indicator shows a significantly negative sign (Table , p. 371), suggesting that even after controlling for job rank (as well as a battery of other variables), female auditors’ compensation at the top of the Big Four firms’ hierarchies remains discounted. Both Knechel et al. (Citation2013) and Vandenhaute et al. (Citation2020) find that commercial factors, such as audit partners’ client portfolio size, total audit fees collected, and the number of listed clients, are strong predictors of partner compensation.
8 The same concern has been raised elsewhere. For example, Kevin Ellis, UK chair and senior partner at PwC (UK), warned that the audit profession was unattractive to new recruits. PwC also stated that its attrition levels for newly qualified CPAs were 8% higher in 2021 than in 2020 (O’Dwyer, Citation2021).
9 Blau and Kahn (Citation2017) also note that women’s job aspirations may be affected by their anticipated treatment in the labor market.
10 This is because men can work more overtime, while their household partners take care of home obligations. The effect of overwork offsets the improvement in women’s educational attainment and other forms of human capital.
11 Goldin (Citation2014) points out that, for occupations where job flexibility is extremely costly, women are more likely to be burdened by the high penalty for childbirth, shorter working hours, and a flexible schedule. Hence, without fundamental changes in ‘how jobs are structured and remunerated’ (Goldin, Citation2014, p. 1091), the gender pay gap cannot be eliminated.
12 For professionals in other occupations – such as lawyers and managers – where job flexibility is also very costly, prior studies even show a large and widening gender pay gap over time (Bertrand et al., Citation2010; Goldin, Citation2014; Noonan et al., Citation2005; Reuben et al., Citation2015).
13 For example, although women now account for approximately half of the labor force, there are only 8% female CEOs running Fortune 500 firms as of 2021 (Hinchliffe, Citation2021). Female leadership also seems to be rare in the auditing industry. In 2019, the Financial Times reported that, among all the lead audit partners of FTSE 100 companies, only nine were women, and almost all were white (Marriage & Gross, Citation2019). Changes in the situation also seem to be slow: AICPA’s (Citation2017) survey showed that 22% of partners in all public accounting firms were women, whereas the figure for 2011 was 21%. Female representation in the largest audit firms (with more than 100 CPAs) is even lower, with women accounting for 16% of the equity partners and representing merely 14% of the total equity in those firms (AICPA, Citation2011, Citation2017).
14 Several empirical studies have found evidence supporting this ‘women helping women’ effect (Bilimoria, Citation2006; Cook & Glass, Citation2014, Citation2015; Kirsch, Citation2018; Kunze & Miller, Citation2017; Skaggs et al., Citation2012; Stainback et al., Citation2016).
15 Historically, the Big Four culture has been characterized by male and white domination, masculinity, and patriarchy (Edgley et al., Citation2016). In such an environment, ‘homogeneity’ is an important element of the Big Four’s occupational branding and, therefore, the ability to ‘fit in’ is critical for auditors’ career success (Hanlon, Citation2004; Hechter, Citation2008). This results in a ‘closed circle of male homo-sociality’ that precludes the ascension of women in audit firms (Anderson-Gough et al., Citation2005, p. 478). Other studies in this line of research include Adapa et al. (Citation2016), Barker and Monks (Citation1998), Dambrin and Lambert (Citation2012), Hull and Umansky (Citation1997), and Lupu (Citation2012).
16 One exception is Edgley et al. (Citation2016), who employ the institutional logics approach in studying how diversity is perceived and enacted in audit firms. Edgley et al. find that gender imbalance appears to attract most attention on firms’ diversity agenda; however, the shift seems to be symbolic, and there is a clear discrepancy between the Big Four’s discourses and the actual data. The data gathered in their study are in the form of texts, images, photographs, and graphical representations, among others.
17 The total number of Swedish CPAs has been decreasing gradually in recent years, from 4,218 in 2000 and 3999 in 2010, to 3589 in 2015 (see Figure F-1 in the online appendix for the trend). According to SIA’s (Citation2021) annual report, the total number of registered auditors is 3,007.
18 Similar to the Big Four firms, BDO and Grant Thornton operate as global networks of independent firms that follow the same global policies. Thus, I expect that the gender equality status within BDO and Grant Thornton is likely to be closer to that of the Big Four firms than Swedish local firms.
19 2007 is the first year for which the income data are available from the data provider.
20 STA classifies a person’s income into three categories: salary, capital, and business income. Auditors’ work-related compensation may come from both salary and capital income. Equity partners of an audit firm receive dividend payments from the firm, which is classified by STA as capital income. A limitation of this study is that I do not have access to the data required for identifying equity partners in audit firms; neither can I distinguish partnership dividends from other types of capital income, such as capital income from stock trading and real estate transactions. Therefore, the focus of this study is on the gender salary gap. Nevertheless, for robustness check in one specification, I follow Knechel et al. (Citation2013) and identify an audit partner as one who has signed a listed company’s audit report in a certain year. Following Knechel et al. (Citation2013), I use salary plus capital income as a crude measure of a partner’s total job-related compensation.
21 The Serrano database combines the following data sources: financial statement data and bankruptcy information for all Swedish companies from the Swedish Companies Registration Office (SCRO), the general history of company data from Statistics Sweden, and group data from Bisnode’s group register. The SCRO also keeps track of information about each company’s auditors, including their personal identity numbers and auditor tenure with the client companies.
22 Following the labor economics literature (e.g., Blau & Kahn, Citation2006), I do not winsorize the salary data for tests presented in this study. Since the income data source is the STA, the data quality is high. For robustness check, I winsorize the yearly salary data at the 1 and 99 percentiles for regression analyses, and the results remain largely the same for all the tests.
23 For example, the salary difference between men and women in 2007 is approximately 22%. The difference decreases to 14% in 2011, and further decreases to approximately 10% in 2015.
24 The median (25th percentile) male CPA salary is 553,060 (451,803) SEK, and the median (25th percentile) female CPA salary is 485,123 (399,637) SEK. The difference is 67,937 (52,166) SEK or 14% (13%). However, a male CPA at the 90th percentile of the male CPAs’ salary distribution earns 880,000 SEK, whereas a female CPA at the corresponding level earns only 750,605 SEK – the gap widens to approximately 130,000 SEK or 17.2%. The highest male CPA salary in the sample is 8,856,826 SEK, whereas the highest female CPA salary is 6,061,232 SEK; the difference is close to 2.8 million SEK or 46%.
25 I control for REGION because the Swedish economy is not evenly distributed across the country. The population of Sweden is concentrated in the south, while the north is heavily forested. Economic development varies across Sweden’s geographical regions and municipalities, as Edvinsson et al. (Citation2011) show. Citizens of Stockholm (the capital and largest city), Gothenburg, and Malmö have the highest disposable income levels, whereas those living in the north have the lowest.
26 The division follows the classification scheme of the Swedish Post (Posten): 1 = Stockholm, 2 = Skåne, 3 = South East, 4 = South West, 5 = South Central, 6 = East, 7 = North Central, 8 = Southern Norrland, and 9 = Northern Norrland. The city of Gothenburg belongs to the South West region, and Malmö to the Skåne area.
27 The requirement for becoming an approved CPA was to have a bachelor’s degree, pass a professional competency exam, and have at least three years’ practical experience. The higher standards for becoming an authorized CPA included a master’s degree, at least five years’ experience, and passing a more challenging professional competency exam. After June 2013, the two-tier system was removed, and all new CPAs are presently designated as authorized CPA (auktoriserad revisor).
28 More specifically, I first calculate, for each year, individual auditor’s market share in a given industry (classified by the two-digit SNI industry code) as the sum of their clients’ total sales in the industry divided by the total sales of all companies in the industry. Second, I rank auditors in each industry by their market share and then define an auditor as an industry expert if he/she is the top-ranked or second-ranked auditor in the industry.
29 From 2007 to 2011, the average number of clients for female CPAs increased from 38 to 44 but decreased to 40 in 2015. The same pattern emerges for male CPAs: the values of NAUDITS for 2007, 2011, and 2015 are 76, 85, and 72 clients per male CPA, respectively. This pattern is probably due to the change in the Swedish audit regulation in 2010, which removed the mandatory audit requirement for micro-sized companies. After 2010, most small companies under the size threshold gradually opted out of financial statement audits (Dong et al., Citation2022).
30 Another factor that may negatively affect women’s work experience is childbirth interruption. In an untabulated test, I also introduce a crude adjustment to TENURE for female CPAs. More specifically, I start to count women’s tenure from 480 days (1.31 years, the total duration of paid parental leave in Sweden) after they have obtained their CPA license, assuming that all female auditors take the full parental leave period after they obtain the license. Using this crude measure for tenure with motherhood adjustment, the estimated coefficient on FEMALE is -0.142 (p < 0.01). This result shows that the size of the salary gap remains large even after adjusting for the potential impact of parental leave on female auditors’ tenure.
31 To demonstrate the difference between the sizes of the gap in 2007 and 2015, in untabulated tests, I also conduct an estimation similar to that in Panel, A. Column (7), but include only data for 2007 and 2015 and add the interaction term, FEMALE*year2015. The coefficient on FEMALE is -0.130 (p < 0.01), while the coefficient on the interaction term, FEMALE*year2015, is 0.083 (p < 0.01), suggesting that the size of the gap in 2015 is significantly smaller than that in 2007.
32 More specifically, the estimated coefficients on FEMALE are −0.165 at the 95th percentile, −0.117 at the 75th percentile, −0.0985 at the median, and −0.0982 at the 25th percentile, respectively, and all are statistically significant at the 1% level.
33 Please note that, in contrast to the OLS regression which presents a negative sign for the salary gap based on women less men’s log salaries, the Oaxaca-Blinder approach usually presents the male-female log wage difference.
34 The aggregated effect with a negative sign on ‘other career variables’ is mainly driven by the number of audit clients (LN_NAUDITS, with −0.0297 log points). This finding may indicate that it is more difficult for women to obtain large clients, i.e., given the same client portfolio size, women tend to engage with a larger number of smaller clients, which is not as profitable as a small number of large clients.
35 One might argue that if women were more likely to work part-time, they would have smaller client portfolio sizes, which might bias the proportion of the explained gap. While this is likely to be the case, it should not substantially affect my results because part-time work is not prevalent in audit firms. According to PwC’s (Sweden) 2021 annual report, among middle-senior level staff in the entire firm, approximately 5% of females are on part-time, compared to 1% of men (PwC, Citation2021). The proportion of part-time CPAs in my sample should be even smaller because all CPAs in this sample could be identified with at least one audit client. Therefore, I believe that the concern about part-time working should not significantly bias the results presented here.
36 Indeed, the unexplained gap in 2015 remains large. This could be due to discrimination, measurement error of control variables, or unobservable characteristics such as psychological factors and individual preferences for risk or competition. The proportion of the unexplained gap relative to the total gap (45%) as shown in Table is largely consistent with Blau and Kahn (Citation2017), who use detailed U.S. PSID data to examine the trend and explanations for the gender pay gap in the U.S. labor market from 1980 to 2010.
37 Data on firms’ board room compositions were also obtained from the Serrano database. Year 2017 is the last year for which I have access to these data.
38 Due to data unavailability (described in the third section), I could only identify the Big Six firms’ detailed information necessary for conducting the empirical analyses in this section.
39 The considerable decrease in the unexplained component of the total gap (shown in Table ) is also likely to be affected by female leadership. As I have discussed in previous sections, changes in unobservable factors such as women’s preferences, selection into (or exit from) the profession, psychological issues, and risk aversion could all play a part in narrowing the unexplained gap.
References
- Abdelfattah, T., Elmahgoub, M., & Elamer, A. A. (2021). Female audit partners and extended audit reporting: UK evidence. Journal of Business Ethics, 174(1), 177–197. https://doi.org/10.1007/s10551-020-04607-0
- Adapa, S., Rindfleish, J., & Sheridan, A. (2016). ‘‘Doing gender’ in a regional context: Explaining women’s absence from senior roles in regional accounting firms in Australia. Critical Perspectives on Accounting, 35, 100–110. https://doi.org/10.1016/j.cpa.2015.05.004
- Addison, J. T., Ozturk, O. D., & Wang, S. (2014). The role of gender in promotion and pay over a career. Journal of Human Capital, 8(3), 280–317. https://doi.org/10.1086/677942
- Albrecht, J., Björklund, A., & Vroman, S. (2003). Is there a glass ceiling in Sweden? Journal of Labor Economics, 21(1), 145–177. https://doi.org/10.1086/344126
- Albrecht, J., Thoursie, P. S., & Vroman, S. (2015). Parental leave and the glass ceiling in Sweden. Research in Labor Economics, 41, 89–114. https://doi.org/10.1108/S0147-912120140000041010
- Almer, E. D., Harris, M. K., Higgs, J. L., & Rakestraw, J. R. (2021). Partner gender differences in prestige of clients served at the largest U.S. Audit firms. Journal of Business Ethics, 173(2), 401–421. https://doi.org/10.1007/s10551-020-04532-2
- Almer, E. D., & Single, L. E. (2007). Shedding light on the AICPA work/life and women’s initiatives research: What does it mean to educators and students? Issues in Accounting Education, 22(1), 67–77. https://doi.org/10.2308/iace.2007.22.1.67
- American Institute of Certified Public Accountants. (2011). Trends in the supply of accounting graduates and the demand for public accounting recruits. AICPA Annual Reports. https://egrove.olemiss.edu/cgi/viewcontent.cgi?article=1230&context=aicpa_arprts
- American Institute of Certified Public Accountants. (2017). CPA firm gender survey. https://us.aicpa.org/content/dam/aicpa/career/womenintheprofession/downloadabledocuments/wiec-2017-cpa-firm-gender-survey-brochure.pdf
- American Institute of Certified Public Accountants. (2019a). Best practices for preventing gender pay disparity: A guide from the AICPA women’s initiatives executive committee. https://us.aicpa.org/content/dam/aicpa/career/womenintheprofession/downloadabledocuments/gender-pay-disparity-brochure.pdf
- American Institute of Certified Public Accountants. (2019b). PCPS CPA top issues survey (Vol. 2019). https://www.journalofaccountancy.com/info/2019-pcps-cpa-top-issues.html
- American Institute of Certified Public Accountants. (2021). 2021 Top Issues commentary: Familiar challenges in an extraordinary time. AICPA 2021 PCPS CPA firm top issues survey. https://www.aicpa.org/professional-insights/download/2021-top-issues-commentary-familiar-challenges-in-extraordinary-times
- Anderson-Gough, F., Grey, C., & Robson, K. (2005). “‘Helping them to forget..’: the organizational embedding of gender relations in public audit firms. Accounting, Organizations and Society, 30(5), 469–490. https://doi.org/10.1016/j.aos.2004.05.003
- Athey, S., Avery, C., & Zemsky, P. (2000). Mentoring and diversity. American Economic Review, 90(4), 765–786. https://doi.org/10.1257/aer.90.4.765
- Barker, P. C., & Monks, K. (1998). Irish women accountants and career progression: A research note. Accounting, Organizations and Society, 23(8), 813–823. https://doi.org/10.1016/S0361-3682(98)00009-9
- Becker, G. S. (2009). Human capital: A theoretical and empirical analysis, with special reference to education. University of Chicago Press.
- Bertrand, M., Goldin, C., & Katz, L. F. (2010). Dynamics of the gender gap for young professionals in the financial and corporate sectors. American Economic Journal: Applied Economics, 2(3), 228–255. https://doi.org/10.1257/app.2.3.228
- Bilimoria, D. (2006). The relationship between women corporate directors and women corporate officers. Journal of Managerial Issues, 18(1), 47–61. https://www.jstor.org/stable/40604524
- Bishu, S. G., & Alkadry, M. G. (2017). A systematic review of the gender pay gap and factors that predict it. Administration & Society, 49(1), 65–104. https://doi.org/10.1177/0095399716636928
- Blau, F. D., & Kahn, L. M. (2006). The U.S. gender pay gap in the 1990s: Slowing convergence. ILR Review, 60(1), 45–66. https://doi.org/10.1177/001979390606000103
- Blau, F. D., & Kahn, L. M. (2007). The gender pay gap: Have women gone as far as they can? Academy of Management Perspectives, 21(1), 7–23. https://doi.org/10.5465/amp.2007.24286161
- Blau, F. D., & Kahn, L. M. (2017). The gender wage gap: Extent, trends, and explanations. Journal of Economic Literature, 55(3), 789–865. https://doi.org/10.1257/jel.20160995
- Blinder, A. S. (1973). Wage discrimination: Reduced form and structural estimates. Journal of Human Resources, 8(4), 436–455. https://doi.org/10.2307/144855
- Bolotnyy, V., & Emanuel, N. (2022). Why do women earn less than men? Evidence from bus and train operators. Journal of Labor Economics, 40(2), 283–323. https://doi.org/10.1086/715835
- Bustos-Contell, E., Porcuna-Enguix, L., Serrano-Madrid, J., & Labatut-Serer, G. (2022). Female audit team leaders and audit effort. Journal of Business Research, 140, 324–331. https://doi.org/10.1016/j.jbusres.2021.11.003
- Cha, Y., & Weeden, K. A. (2014). Overwork and the slow convergence in the gender gap in wages. American Sociological Review, 79(3), 457–484. https://doi.org/10.1177/0003122414528936
- Chi, H. Y., & Chin, C. L. (2011). Firm versus partner measures of auditor industry expertise and effects on auditor quality. Auditing: A Journal of Practice & Theory, 30(2), 201–229. https://doi.org/10.2308/ajpt-50004
- Cohen, J. R., Dalton, D. W., Holder-Webb, L. L., & McMillan, J. J. (2020). An analysis of glass ceiling perceptions in the accounting profession. Journal of Business Ethics, 164(1), 17–38. https://doi.org/10.1007/s10551-018-4054-4
- Cook, A., & Glass, C. (2014). Women and top leadership positions: Towards an institutional analysis. Gender, Work & Organization, 21(1), 91–103. https://doi.org/10.1111/gwao.12018
- Cook, A., & Glass, C. (2015). Diversity begets diversity? The effects of board composition on the appointment and success of women CEOs. Social Science Research, 53, 137–147. https://doi.org/10.1016/j.ssresearch.2015.05.009
- Dalton, D. W., Cohen, J. R., Harp, N. L., & McMillan, J. J. (2014). Antecedents and consequences of perceived gender discrimination in the audit profession. Auditing: A Journal of Practice & Theory, 33(3), 1–32. https://doi.org/10.2308/ajpt-50737
- Dambrin, C., & Lambert, C. (2012). Who is she and who are we? A reflexive journey in research into the rarity of women in the highest ranks of accountancy. Critical Perspectives on Accounting, 23(1), 1–16. https://doi.org/10.1016/j.cpa.2011.06.006
- Darity, W. A., & Mason, P. L. (1998). Evidence on discrimination in employment: Codes of color, codes of gender. Journal of Economic Perspectives, 12(2), 63–90. https://doi.org/10.1257/jep.12.2.63
- Deloitte. (2011). The gender dividend: Making the business case for investing in women. https://www2.deloitte.com/ru/en/pages/public-sector/articles/the-gender-dividend.html
- Deloitte. (2018). Deloitte publishes equity partner gender earnings gap. https://www2.deloitte.com/uk/en/pages/press-releases/articles/deloitte-publishes-equity-partner-gender-earnings-gap.html
- Dong, T., Tylaite, M., & Wilson, R. (2022). Voluntary vs. mandatory: The role of auditing in constraining corporate tax avoidance in small private firms. Accounting and Business Research, Advance online publication. https://doi.org/10.1080/00014788.2022.2063105
- Duvander, A. (2014). How long should parental leave be? Attitudes to gender equality, family, and work as determinants of women’s and men’s parental leave in Sweden. Journal of Family Issues, 35(7), 909–926. https://doi.org/10.1177/0192513X14522242
- Echevarria, J. (2012). The true economic value of women. https://www.fastcompany.com/1836989/true-economic-value-women
- Edgley, C., Sharma, N., & Anderson-Gough, F. (2016). Diversity and professionalism in the big four firms: Expectation, celebration and weapon in the battle for talent. Critical Perspectives on Accounting, 35, 13–34. https://doi.org/10.1016/j.cpa.2015.05.005
- Edvinsson, S., Malmberg, G., & Häggström Lundevaller, E. (2011, November 17–20). Do unequal societies cause death and disease?: A study of the health effects on elderly of inequality in Swedish municipalities, 2006 [Paper presentation]. The 36th annual meeting of the Social Science History Association, Boston.
- EY. (2020). Pay gap report 2020. https://assets.ey.com/content/dam/ey-sites/ey-com/en_uk/about-us/annual-results/ey-2020-pay-gap-report.pdf
- Firpo, S., Fortin, N. M., & Lemieux, T. (2009). Unconditional quantile regressions. Econometrica, 77(3), 953–973. https://doi.org/10.3982/ECTA6822
- Flabbi, L., Macis, M., Moro, A., & Schivardi, F. (2019). Do female executives make a difference? The impact of female leadership on gender gaps and firm performance. The Economic Journal, 129(622), 2390–2423. https://doi.org/10.1093/ej/uez012
- Franzel, J. M. (2014). Leadership in public accounting firms: Why so few women? [Speech presentation]. The Eighth Annual Washington Women Speak: How women leaders succeed in the Washington. DC Ecosystem. https://pcaobus.org/news-events/speeches/speech-detail/leadership-in-public-accounting-firms-why-so-few-women-_516
- Goldin, C. (2006). The quiet revolution that transformed women’s employment, education, and family. American Economic Review, 96(2), 1–21. https://doi.org/10.1257/000282806777212350
- Goldin, C. (2014). A grand gender convergence: Its last chapter. American Economic Review, 104(4), 1091–1119. https://doi.org/10.1257/aer.104.4.1091
- Hanlon, G. (2004). Institutional forms and organizational structures: Homology, trust and reputational capital in professional service firms. Organization, 11(2), 186–210. https://doi.org/10.1177/1350508404041613
- Hanson, J. D. (2015). PCAOB impact on financial executives: Standards and inspections. https://pcaobus.org/News/Speech/Pages/11172015-Hanson-FEI-speechPCAOB-impact.aspx
- Hardies, K., Lennox, C., & Li, B. (2021). Gender discrimination? Evidence from the Belgian public accounting profession. Contemporary Accounting Research, 38(3), 1509–1541. https://doi.org/10.1111/1911-3846.12667
- Hechter, M. (2008). The rise and fall of normative control. Accounting, Organizations and Society, 33(6), 663–676. https://doi.org/10.1016/j.aos.2008.01.005
- Hinchliffe, E. (2021, June 2). The female CEOs on this year’s Fortune 500 just broke three all-time records. Fortune. https://fortune.com/2021/06/02/female-ceos-fortune-500-2021-women-ceo-list-roz-brewer-walgreens-karen-lynch-cvs-thasunda-brown-duckett-tiaa/
- Hull, R. P., & Umansky, P. H. (1997). An examination of gender stereotyping as an explanation for vertical job segregation in public accounting. Accounting, Organizations and Society, 22(6), 507–528. https://doi.org/10.1016/S0361-3682(96)00028-1
- Ibarra, H. (1992). Homophily and differential returns: Sex differences in network structure and access in an advertising firm. Administrative Science Quarterly, 37(3), 422–447. https://doi.org/10.2307/2393451
- International Federation of Accountants. (2017). Keeping the audit profession attractive. https://www.ifac.org/knowledge-gateway/developing-accountancy-profession/discussion/keeping-audit-profession-attractive
- International Federation of Accountants. (2021). Toward gender equality: Accounting for change. https://www.youtube.com/playlist?list=PLfuuMk7vk2dj55q5ptffHeZpnt1vrm90C
- Keloharju, M., Knüpfer, S., & Tåg, J. (2022). What prevents women from reaching the top? IFN Working Paper No. 1111. Harvard Business School Research Paper Series No. 16-092. https://doi.org/10.2139/ssrn.2730207.
- Khalifa, R. (2013). Intra-professional hierarchies: The gendering of accounting specialisms in UK accountancy. Accounting, Auditing & Accountability Journal, 26(8), 1212–1245. https://doi.org/10.1108/AAAJ-05-2013-1358
- Kirsch, A. (2018). The gender composition of corporate boards: A review and research agenda. The Leadership Quarterly, 29(2), 346–364. https://doi.org/10.1016/j.leaqua.2017.06.001
- Kleven, H., Landais, C., & Søgaard, J. E. (2019). Children and gender inequality: Evidence from Denmark. American Economic Journal: Applied Economics, 11(4), 181–209. https://doi.org/10.1257/app.20180010
- Knechel, W. R., Niemi, L., & Zerni, M. (2013). Empirical evidence on the implicit determinants of compensation in big 4 audit partnerships. Journal of Accounting Research, 51(2), 349–387. https://doi.org/10.1111/1475-679X.12009
- Kopczuk, W., Saez, E., & Song, J. (2010). Earnings inequality and mobility in the United States: Evidence from social security data since 1937. The Quarterly Journal of Economics, 125(1), 91–128. https://doi.org/10.1162/qjec.2010.125.1.91
- Kornberger, M., Carter, C., & Ross-Smith, A. (2010). Changing gender domination in a big four accounting firm: Flexibility, performance and client service in practice. Accounting, Organizations and Society, 35(8), 775–791. https://doi.org/10.1016/j.aos.2010.09.005
- KPMG. (2017). KPMG pay gap report (2017). https://assets.kpmg/content/dam/kpmg/uk/pdf/2017/12/pay-gap-report-2017.pdf
- Kunze, A. (2008). Gender wage gap studies: Consistency and decomposition. Empirical Economics, 35(1), 63–76. https://doi.org/10.1007/s00181-007-0143-4
- Kunze, A., & Miller, A. R. (2017). Women helping women? Evidence from private sector data on workplace hierarchies. Review of Economics and Statistics, 99(5), 769–775. https://doi.org/10.1162/REST_a_00668
- Kurtulus, F. A., & Tomaskovic-Devey, D. (2011). Do female top managers help women to advance? A panel study using EEO-1 records. The Annals of the American Academy of Political and Social Science, 639(1), 173–197. https://doi.org/10.1177/0002716211418445
- Lennox, C. S., & Wu, X. (2018). A review of the archival literature on audit partners. Accounting Horizons, 32(2), 1–35. https://doi.org/10.2308/acch-51942
- Lupu, I. (2012). Approved routes and alternative paths: The construction of women’s careers in large accounting firms. Evidence from the French Big Four. Critical Perspectives on Accounting, 23(4–5), 351–369. https://doi.org/10.1016/j.cpa.2012.01.003
- Marianne, B. (2011). Chapter 17 – new perspectives on gender. In D. Card, & O. Ashenfelter (Eds.), Handbook of labor economics (pp. 1543–1590). Elsevier. https://doi.org/10.1016/S0169-7218(11)02415-4
- Marriage, M., & Gross, A. (2019, May 7). Big Four auditors present male and pale faces to top UK clients. Financial Times. https://www.ft.com/content/7b339d24-6dc3-11e9-a9a5-351eeaef6d84
- Matsa, D. A., & Miller, A. R. (2011). Chipping away at the glass ceiling: Gender spillovers in corporate leadership. American Economic Review, 101(3), 635–639. https://doi.org/10.1257/aer.101.3.635
- McCue, K. (1996). Promotions and wage growth. Journal of Labor Economics, 14(2), 175–209. https://doi.org/10.1086/209808
- Miller, A. R. (2011). The effects of motherhood timing on career path. Journal of Population Economics, 24(3), 1071–1100. https://doi.org/10.1007/s00148-009-0296-x
- Miller, L., Neathey, F., Pollard, E., & Hill, D. (2004). Occupational segregation, gender gaps and skill gaps. Equal Opportunities Commission.
- Niederle, M., & Vesterlund, L. (2007). Do women shy away from competition? Do men compete too much? The Quarterly Journal of Economics, 122(3), 1067–1101. https://doi.org/10.1162/qjec.122.3.1067
- Noonan, M. C., Corcoran, M. E., & Courant, P. N. (2005). Pay differences among the highly trained: Cohort differences in the sex gap in lawyers’ earnings. Social Forces, 84(2), 853–872. https://doi.org/10.1353/sof.2006.0021
- Oaxaca, R. (1973). Male–female wage differentials in urban labor markets. International Economic Review, 14(3), 693–709. https://doi.org/10.2307/2525981
- O’Dwyer, M. (2021). Audit profession unattractive to new recruits, says PwC boss. Financial Times. https://www.ft.com/content/a8c60322-3e56-4889-b346-e34d3c5f1e97
- PricewaterhouseCoopers. (2020). Transparency report (year ended 30 June 2020). https://www.pwc.co.uk/annualreport/assets/2020/uk-transparency-report-2020.pdf
- PricewaterhouseCoopers. (2021). Annual report 2020/2021. https://www.pwc.se/sv/om-oss/arsredovisning-2020-2021.pdf
- Reuben, E., Sapienza, P., & Zingales, L. (2015). Taste for competition and the gender gap among young business professionals. National Bureau of Economic Research Working Paper, w21695. https://ssrn.com/abstract=2687843
- Skaggs, S., Stainback, K., & Duncan, P. (2012). Shaking things up or business as usual? The influence of female corporate executives and board of directors on women’s managerial representation. Social Science Research, 41(4), 936–948. https://doi.org/10.1016/j.ssresearch.2012.01.006
- Stainback, K., Kleiner, S., & Skaggs, S. (2016). Women in power: Undoing or redoing the gendered organization? Gender & Society, 30(1), 109–135. https://doi.org/10.1177/0891243215602906
- Stanley, T. D., & Jarrell, S. B. (1998). Gender wage discrimination bias? A meta-regression analysis. The Journal of Human Resources, 33(4), 947–973. https://doi.org/10.2307/146404
- Swedish Inspectorate of Auditors, Revisorsinspektionen. (2021). Annual report 2021. https://www.revisorsinspektionen.se/globalassets/webbplatsen/om-oss/publicerat/arsredovisningar-budgetunderlag-och-regleringsbrev/arsredovisning-2021_revisorsinspektionen.pdf
- Tate, G., & Yang, L. (2015). Female leadership and gender equity: Evidence from plant closure. Journal of Financial Economics, 117(1), 77–97. https://doi.org/10.1016/j.jfineco.2014.01.004
- Vandenhaute, M., Hardies, K., & Breesch, D. (2020). Professional and commercial incentives in audit firms: Evidence on partner compensation. European Accounting Review, 29(3), 521–554. https://doi.org/10.1080/09638180.2019.1642223
- Van Linden, C., Vandenhaute, M., & Zimmerman, A. (2022). Audit firm employee turnover and audit quality. SSRN Working Paper. https://papers.ssrn.com/sol3/papers.cfm?abstract_id=3775116
- Weichselbaumer, D., & Winter-Ebmer, R. (2005). A meta-analysis of the international gender wage gap. Journal of Economic Surveys, 19(3), 479–511. https://doi.org/10.1111/j.0950-0804.2005.00256.x
- Weyer, B. (2007). Twenty years later: Explaining the persistence of the glass ceiling for women leaders. Women in Management Review, 22(6), 482–496. https://doi.org/10.1108/09649420710778718
- Xu, Y. J. (2008). Gender disparity in STEM disciplines: A study of faculty attrition and turnover intentions. Research in Higher Education, 49(7), 607–624. https://doi.org/10.1007/s11162-008-9097-4