
 ?Mathematical formulae have been encoded as MathML and are displayed in this HTML version using MathJax in order to improve their display. Uncheck the box to turn MathJax off. This feature requires Javascript. Click on a formula to zoom.
Abstract
Purpose
Describe the course of exercise capacity in pediatric burn patients during the initial 6 months after hospital discharge, and examine whether its recovery can be predicted from burn characteristics, sociodemographic characteristics, and/or prior assessment.
Materials and methods
Exercise capacity was assessed at discharge, and 6 weeks, 3 months, and 6 months after discharge using the Steep Ramp Test (SRT).
Results
Twenty-four pediatric patients with burns affecting 0.1–34% of total body surface area were included. At group level, exercise capacity was low at discharge and did not reach healthy reference values within 6 months, despite significant improvement over time. At individual level, the course of exercise capacity varied widely. Six months after discharge, 48% of participants scored more than one standard deviation below healthy age- and sex-specific reference values. SRT outcomes at 6 weeks and 3 months were the best predictors of exercise capacity 6 months after discharge, explaining, respectively, 76% and 93% of variance.
Conclusions
Forty-eight percent of participants did not achieve healthy reference values of exercise capacity and were therefore considered “at risk” for diminished functioning. Our preliminary conclusion that early assessment of exercise capacity with the SRT can timely identify those patients, needs to be strengthened by further research.
Pediatric burns can be considered as a chronic medical condition because of the lifelong consequences.
Exercise capacity is reduced following- even minor -pediatric burns.
Recovery patterns vary widely: some pediatric burn patients achieve healthy levels of exercise capacity without specific intervention, while others do not.
The Steep Ramp Test can be used to assess exercise capacity, identifying those “at risk” for adverse outcomes at an early stage.
Patients “at risk” should be encouraged to play sports and adopt an active lifestyle.
IMPLICATIONS FOR REHABILITATION
Introduction
Burn injuries during childhood can have a tremendous impact. The pathophysiology of burns generally leads to muscle wasting and a decline in exercise capacity, which is exacerbated by the long periods of hospital stay with bed rest and inactivity [Citation1–3]. The primary focus of burn care is helping children to return to the activities they were involved in before the burn injury, with minimal functional limitations, psychological consequences, and cosmetic alterations [Citation4]. Recovery of exercise capacity is an important prerequisite to achieve optimal levels of functioning, participation, and quality of life [Citation5–7]. Moreover, exercise capacity is an important predictor of (long-term) health outcomes [Citation8,Citation9]. As pediatric burn patients, even those with minor burns, already have an increased risk for secondary health conditions in the long term [Citation10–13], it is important to ensure that every one of them achieves and maintains healthy levels of exercise capacity.
The majority of evidence regarding exercise capacity after pediatric burns originates from the Shriners Hospital for Children in Galveston, U.S.A. [Citation6,Citation14–27]. These studies included children and adolescents with extensive burns (>30% or >40% of total body surface area (TBSA)). In this exceptional group of patients, exercise capacity was shown to be affected up to 5 years post-burn, despite significant improvements caused by structured exercise and/or drug interventions [Citation14–16,Citation20,Citation21,Citation24–27]. Fortunately, such extensive pediatric burns are rare in both the Netherlands and the U.S.A. [Citation28], and this will also be the case in other developed countries.
In patients with less extensive burns, the general pediatric burn population admitted to a burn center, a certain decline in exercise capacity is assumed as well. It is often supposed, however, that their exercise capacity will recover to healthy levels without specific intervention. Surprisingly, only two studies actually assessed exercise capacity in the general pediatric burn population. Both studies were cross-sectional and assessed exercise capacity beyond the initial 6 months after hospital discharge. Valenciano et al. [Citation29] showed that pediatric burn patients (4–12.5%TBSA) obtained healthy values of walking distance on the 6-minute walk test, 6–24 months after discharge from the burn center. It is important to note, however, that this test reflects the capacity to perform submaximal exercise. Disseldorp et al. [Citation28] assessed maximal exercise capacity 1–5 years postburn, and showed that pediatric burn patients (10–41% TBSA) did not perform significantly worse compared to healthy peers. Individual assessment showed, however, that one third of the participants scored more than one standard deviation (SD) below age- and sex-specific healthy reference values and was therefore considered “at risk” for diminished functioning, participation, and quality of life. Additional data from these patients showed that the majority of them (65%) did not achieve the physical activity recommendation of the World Health Organization [Citation30]. Inactivity leads to a further decrease in exercise capacity, and this downward spiral of deconditioning can cause significant health problems in the long term [Citation5].
To identify the potential rehabilitation needs of the general pediatric burn population admitted to a burn center, it is essential to determine the course of their exercise capacity after discharge. Examining factors that can predict the recovery of exercise capacity at an early stage, enables early intervention for those who need this. Therefore, this study aimed (1) to describe the course of exercise capacity in children and adolescents with a wide range of burn characteristics during the initial 6 months after hospital discharge, and (2) to examine whether exercise capacity 6 months after discharge can be predicted from burn characteristics, sociodemographic characteristics, and/or prior assessment of exercise capacity.
Materials and methods
The data described in this study were obtained as part of a multi-center prospective cohort study. During the initial 6 months after discharge, exercise capacity was systematically assessed four times: at discharge, and at 6 weeks, 3 months, and 6 months after discharge. The total study comprised also the assessment of body composition, joint range of motion, muscular strength, physical activity and sedentary behavior, perceived fatigue, and health-related quality of life. Results of these additional variables will be presented in future publications. All assessments were conducted as described by Disseldorp et al. [Citation31], with the exception of exercise capacity, for which the procedure is described below. Assessments were performed at the burn center where regular follow-up visits took place, usually also the center of admission. All assessments were performed by trained physical therapists and researchers from the burn centers. The Regional Committee for Patient-Oriented Research Leeuwarden (in Dutch: Regionale Toetsings-commissie Patiëntgebonden Onderzoek - RTPO) approved the study (date November 18, 2013; protocol number NL45917.099.13; chairperson Dr A. Wolthuis). The study has been registered in the National Academic Research and Collaborations Information System (trial registration number: OND1353942).
Study population
Eligible for this prospective cohort study were children and adolescents aged 6–18 years who were hospitalized in one of the three Dutch burn centers in the period from March 2014 till February 2017, with burns affecting 5% TBSA or more, or a length of hospital stay of more than 2 weeks, or both. Extensive (pre-existing) comorbidity, (mental) disabilities, insufficient Dutch language proficiency, and contra-indications for maximal exercise testing, as identified by the Exercise Pre-participation Screening form, were criteria for exclusion. Written informed consent was provided by all parents (or legal representatives) as well as by participants aged ≥12 years before enrollment; for participants aged 18 parental informed consent was not required.
Data collection
Exercise capacity
Exercise capacity was assessed on an electronically braked bicycle ergometer (Lode Corival, Lode, ProCare BV, Groningen) using the Steep Ramp Test (SRT). Seat height was adjusted to a comfortable leg length for each participant. To enable comparison with Dutch age- and sex-matched reference values [Citation32], the SRT protocol as described by Bongers et al. [Citation32] was used (realized using Lode Ergometry Manager software, version 9.4.7). According to this protocol, workload increased every two seconds with 2, 3, or 4 Watts (W), depending on the participant’s body height (<1.20 m, between 1.20 and 1.50 m, and >1.50 m, respectively). The protocol applicable at discharge was used in all subsequent assessments of that child. The children were instructed to maintain a pedaling rate between 60 and 80 revolutions per minute (rpm) until they could no longer maintain a pedaling rate of ≥60 rpm, despite strong verbal encouragement. Peak power output (POpeak), the main outcome parameter of the SRT, was defined as the maximum workload (in W) attained before the pedaling frequency definitely dropped below 60 rpm. POpeak was expressed relative to body weight (POpeak/kg) in order to adjust for body size [Citation32].
The SRT has shown to be feasible, valid, and reliable for evaluating exercise capacity of children and adolescents in daily clinical practice [Citation33–35]. POpeak has been indicated as an appropriate alternative to peak oxygen uptake assessment in pediatric populations [Citation33]. Limits of agreement varied from 9% to −13% (smallest detectable change = 11%) in healthy children and adolescents, which indicates that the SRT can be used to determine meaningful improvements within a single individual [Citation33]. Furthermore, in healthy children and adolescents assessed twice within a period of 2 weeks, there was no evidence of a significant learning effect [Citation33].
The investigator recorded whether subjective signs of intense effort, like unsteady cycling, sweating, facial flushing, and clear inability to continue despite strong verbal encouragement, were present at the end stage of the test. Only assessments in which the participant clearly showed subjective signs of intense effort at the end stage of the test, were included in the analyses.
Burn and sociodemographic characteristics
Data on age, sex, extent of burn, number of surgeries, location of burns, etiology, presence of inhalation injury, and date of injury, admission, and discharge, were obtained from the national Dutch Burn Repository. Data regarding sports participation were obtained from the Standard Questionnaire for Activity [Citation36] and data regarding parental education and behavioral problems were obtained from the Dutch version of the American Burn Association/Shriners Hospitals for Children Burn Outcome Questionnaire [Citation37]. Low parental education was assumed if both parents had finished only elementary school or secondary school, without further education. Socio-economic state (SES) was based on postal code areas, with low SES defined as households within the lowest quintile.
Statistical analyses
Representativeness of participants
To evaluate whether the participants could be considered representative for all eligible pediatric burn patients, participants and non-participants were compared with regard to age, extent of burn, length of hospital stay, and number of surgeries, using independent samples t-tests. Non-participants were those patients who were invited but declined to participate (n = 21) and the patients who were eligible but not invited due to organizational matters (n = 4).
Z-scores for comparison with age- and sex-matched reference values
Absolute scores of POpeak (in W/kg) and body weight were converted to Z-scores. These standardized scores enable the comparison of individual scores to age- and sex-matched healthy reference values obtained from the literature [Citation32]. As such, Z-scores are increasingly adopted in pediatric health care [Citation38]. Individual Z-scores were obtained by calculating how many SDs each individual POpeak/kg score deviated from the age- and sex-specific reference value [Citation32]. Group Z-scores were calculated as the mean of individual Z-scores at each time point. In line with previous studies, participants with a Z-score <−1.0 were considered “at risk” [Citation39,Citation40]. In a typically developing population, assuming normal distribution, approximately 16% of the children will score more than one, and 2.5% will score more than two SDs below the population mean.
Body weight of each participant was compared to the healthy body weight-for-height curve [Citation41] in order to determine which participants were (severely) underweight or (severely) overweight (defined as >1 SD (or >2 SD) below or above the healthy body weight-for-height curve, respectively) [Citation42].
Group level analysis
To gain insight in the group results on exercise capacity over time a multilevel regression model was applied, with burn center, participant, and time point as levels. Only participants with two or more valid SRT assessments were included in the multilevel regression analyses. Time points were defined as dummy variables with T1 (discharge) as reference. Additionally, analyses were performed using T2 (6 weeks after discharge) and T3 (3 months after discharge) as reference. By using multilevel regression models, it was possible to correct for potential differences between burn centers.
To enable comparison with existing literature regarding the course of exercise capacity following pediatric burns [Citation14–16], rate of change (%) in POpeak/kg scores between assessments was calculated. The following formula was used for this purpose:
Individual level analysis
To examine the course of exercise capacity at an individual level, POpeak/kg scores of individual participants over time were plotted against individual age- and sex-matched reference values [Citation32]. Additionally, Z-score scatter plots were used to examine for each time point how many participants scored more than one SD below the age- and sex-specific healthy reference value and were thus considered “at risk”.
Predictability of exercise capacity
To evaluate whether exercise capacity 6 months after discharge could be predicted from burn characteristics, sociodemographic characteristics, and/or prior assessment, univariate multilevel regression analyses were performed. Extent of burn, length of hospital stay, number of surgeries, location of burns (legs involved), etiology, age, sex, weight status, sports participation, behavioral problems, parental education, SES, and the SRT outcome at discharge, 6 weeks, and 3 months were included as independent variables in separate univariate multilevel regression models, in order to assess the individual contribution of each variable to exercise capacity 6 months after discharge.
IBM SPSS Statistics for Windows (Version 23.0. Armonk, NY: IBM Corp.) was used for general statistical analyses, MLwin version 2.02 (Center for Multilevel Modeling, University of Bristol, UK) for multilevel analyses, and Microsoft Excel 2010 for graphing. An alpha-level of 5% was adopted, so p-values below 0.05 were considered statistically significant.
Results
In the period from March 2014 till February 2017, 53 pediatric burn patients were eligible, 24 of them were included (), and 19 completed all four assessments. Comparison of participants and non-participants showed no significant differences with regard to the distribution of sex, mean age at burn injury, extent of burn, length of hospital stay, and number of surgeries ().
Figure 1. Flow chart and number of valid assessments at each time point. FU: follow-up; SRT: Steep Ramp Test. †Malperformance due to limited range of motion of one or both knees. ‡Another protocol than required for that participant, or using a manual instead of software-driven workload increment program.
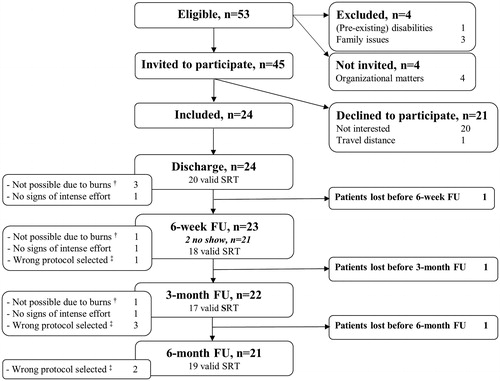
Table 1. Characteristics of participants and non-participants.
Participant characteristics
The participants (n = 24) covered the age range between 6 and 18 years, had burns affecting 0.1–34% of TBSA, and a length of hospital stay varying from 12 to 66 days (). Burns were caused by hot liquid (n = 10) or fire/flames (n = 14), with one patient from the latter group also having sustained an inhalation injury. Two participants were referred for additional physical therapy after discharge because of persisting restrictions in range of motion over one or more joints. All participants were discharged home. Two participants had one reconstructive surgery each during the study period. Most participants had a body weight matching their standing height. One participant was severely underweight, four were overweight, and five were severely overweight, throughout the entire study period.
Assessments
Of the 96 SRT assessments that could have been performed (24 children, four assessments each), eight were not obtained due to no show or loss to follow-up, and 14 were considered invalid ().
The course of exercise capacity over time - group level
At discharge, group level exercise capacity was approximately two SDs below age- and sex-specific healthy reference values (). Exercise capacity improved significantly over time, with the biggest improvements observed during the initial 6 weeks after discharge (). Additional analyses, using T2 (6 weeks after discharge) as reference, showed that the improvement observed in the period from 6 weeks to 6 months after discharge was significant as well. Despite the significant improvement over time, group level exercise capacity remained more than one SD below age- and sex-specific healthy reference values 6 months after discharge ().
Figure 2. The course of exercise capacity in pediatric burn patients after discharge—output from multilevel regression modeling (n = 21). Group Z-scores represent the mean of individual Z-scores (each individual POpeak/kg score compared to an age- and sex-specific reference value). A Z-score of 0 (solid black line) indicates POpeak/kg equal to the mean score of age- and sex-matched healthy controls [Citation32]. A Z-score of −1 (dashed red line) represents POpeak/kg one standard deviation below the age- and sex-specific healthy reference value. POpeak/kg: peak power output (in W) attained during the Steep Ramp Test relative to body weight (in kg); *p < 0.05, **p < 0.01, ***p < 0.001.
![Figure 2. The course of exercise capacity in pediatric burn patients after discharge—output from multilevel regression modeling (n = 21). Group Z-scores represent the mean of individual Z-scores (each individual POpeak/kg score compared to an age- and sex-specific reference value). A Z-score of 0 (solid black line) indicates POpeak/kg equal to the mean score of age- and sex-matched healthy controls [Citation32]. A Z-score of −1 (dashed red line) represents POpeak/kg one standard deviation below the age- and sex-specific healthy reference value. POpeak/kg: peak power output (in W) attained during the Steep Ramp Test relative to body weight (in kg); *p < 0.05, **p < 0.01, ***p < 0.001.](/cms/asset/bcfdb2f9-81b6-4a0a-bc60-c80d48809754/idre_a_1641846_f0002_c.jpg)
Examination of absolute SRT scores showed that POpeak/kg had increased with 5.4 ± 13.6% after 6 weeks. In the period from 6 weeks to 3 months, less improvement was observed, that is 3.7 ± 8.5%. From 3 months to 6 months after discharge, exercise capacity improved with 5.5 ± 6.3%.
The course of exercise capacity over time - individual level
Individual data showed that the course of exercise capacity varied widely among participants. By visual inspection of the graphs in which individual POpeak/kg scores were presented with respect to age- and sex-specific healthy reference values, four patterns could be distinguished, differing from each other with regard to starting point (SRT outcome at discharge), endpoint (SRT outcome 6 months after discharge), and general course of SRT scores over time (). Five participants already had healthy reference values of exercise capacity at discharge (, pattern A) and seven others achieved healthy reference values within 6 months (, pattern B). Eleven participants (48%) did not reach healthy reference values of exercise capacity within 6 months, i.e. SRT score 6 months after discharge more than one SD below the age- and sex-specific healthy reference value (, patterns C + D), five of which showed no improvement over time (, pattern D).
Figure 3. Different patterns in the course of exercise capacity in pediatric burn patients after discharge. The solid black line indicates the mean peak power output (POpeak/kg) of age- and sex-matched healthy individuals (reference value) [Citation32]. The dashed red line represents one standard deviation below the age- and sex-matched reference value. Four different patterns were distinguished in the course of individual exercise capacity following pediatric burns: Pattern A - reference values of exercise capacity at discharge and at all other assessments (n = 5); Pattern B - low exercise capacity at discharge, (consistent) improvement over time, and recovery to reference values within six months (n = 7); Pattern C - low exercise capacity at discharge, (consistent) improvement over time, but not reaching reference values within six months, i.e. “at risk” (n = 6); Pattern D - low exercise capacity at discharge, no (consistent) improvement over time, and not reaching reference values within six months, i.e. “at risk” (n = 5). In case 6-month follow-up scores were not available, it was estimated whether the participant would reach reference values of exercise capacity or not, based on previous scores and the trend observed during follow-up. POpeak/kg = peak power output (in W) attained during the Steep Ramp Test relative to body weight (in kg); dis = discharge; 6w = 6 weeks after discharge; 3m = 3 months after discharge; 6m = 6 months after discharge.
![Figure 3. Different patterns in the course of exercise capacity in pediatric burn patients after discharge. The solid black line indicates the mean peak power output (POpeak/kg) of age- and sex-matched healthy individuals (reference value) [Citation32]. The dashed red line represents one standard deviation below the age- and sex-matched reference value. Four different patterns were distinguished in the course of individual exercise capacity following pediatric burns: Pattern A - reference values of exercise capacity at discharge and at all other assessments (n = 5); Pattern B - low exercise capacity at discharge, (consistent) improvement over time, and recovery to reference values within six months (n = 7); Pattern C - low exercise capacity at discharge, (consistent) improvement over time, but not reaching reference values within six months, i.e. “at risk” (n = 6); Pattern D - low exercise capacity at discharge, no (consistent) improvement over time, and not reaching reference values within six months, i.e. “at risk” (n = 5). In case 6-month follow-up scores were not available, it was estimated whether the participant would reach reference values of exercise capacity or not, based on previous scores and the trend observed during follow-up. POpeak/kg = peak power output (in W) attained during the Steep Ramp Test relative to body weight (in kg); dis = discharge; 6w = 6 weeks after discharge; 3m = 3 months after discharge; 6m = 6 months after discharge.](/cms/asset/bfc724bd-052c-4d20-bbe3-e616e0510f24/idre_a_1641846_f0003_c.jpg)
Individuals “at risk”
Analysis of individual Z-scores at different time points showed that the majority of participants scored below age- and sex-matched healthy reference values on exercise capacity at each time point (). At discharge, 15 of the 20 participants (75%) scored more than one SD below the age- and sex-specific healthy reference value and were thus considered “at risk” for diminished functioning, participation, and quality of life. At 6 weeks, 3 months, and 6 months after discharge, these percentages were 56, 59, and 44%, respectively.
Figure 4. Individual Z-scores of exercise capacity at discharge, and 6 weeks, 3 months, and 6 months after discharge. A Z-score of 0 (solid black line) indicates relative peak power output (POpeak/kg) equal to the mean score of age- and sex-matched healthy controls [Citation32]. A Z-score of −1 (dashed red line) represents relative POpeak/kg one standard deviation below the age- and sex-specific healthy reference value. *19 valid assessments of exercise capacity (POpeak), but body weight (kg) was missing in one of them due to the absence of an electronic scale at the time of assessment. POpeak/kg: peak power output (in W) attained during the Steep Ramp Test relative to body weight (in kg); FU: follow-up.
![Figure 4. Individual Z-scores of exercise capacity at discharge, and 6 weeks, 3 months, and 6 months after discharge. A Z-score of 0 (solid black line) indicates relative peak power output (POpeak/kg) equal to the mean score of age- and sex-matched healthy controls [Citation32]. A Z-score of −1 (dashed red line) represents relative POpeak/kg one standard deviation below the age- and sex-specific healthy reference value. *19 valid assessments of exercise capacity (POpeak), but body weight (kg) was missing in one of them due to the absence of an electronic scale at the time of assessment. POpeak/kg: peak power output (in W) attained during the Steep Ramp Test relative to body weight (in kg); FU: follow-up.](/cms/asset/69f1e374-81d0-4d3b-b800-4713c39e20d6/idre_a_1641846_f0004_c.jpg)
Prediction of exercise capacity from burn characteristics
Univariate multilevel regression analyses showed that etiology and location of burns were both significant predictors of exercise capacity 6 months after discharge, whereas %TBSA affected, length of hospital stay, and number of surgeries were not (). Of the predicting factors, etiology of the burns predicted 17.9% of the variance in exercise capacity 6 months after discharge. Children with burns caused by hot liquids generally had better exercise capacity than those suffering from fire/flame burns. Leg involvement explained 23.4% of the variance and was positively associated with exercise capacity 6 months after discharge.
Table 2. Potential predictors of exercise capacity following pediatric burns, 6 months after discharge—output from univariate multilevel regression modeling.
Prediction of exercise capacity from sociodemographic characteristics
Univariate multilevel regression analyses showed that age, weight status, behavioral problems, and SES were significant predictors of exercise capacity 6 months after discharge, whereas sex, sports participation, and low parental education were not (). Of the predicting factors, younger age, being overweight, being diagnosed with behavioral problems, and low SES were negatively associated with exercise capacity 6 months after discharge (). Being overweight independently explained 45.9% of the variance in exercise capacity at 6 months, followed by low SES (25.6%), age (22.9%), and behavioral problems (22.2%).
Prediction of exercise capacity from prior assessment
Univariate multilevel regression analyses performed to find out whether prior assessments can independently predict exercise capacity 6 months after discharge, showed that each prior SRT assessment was a significant predictor. The SRT outcome at discharge explained 36.9%, the SRT at 6 weeks 75.7%, and the SRT at 3 months 93.1% of the variance in exercise capacity 6 months after discharge (). Visual inspection of the graphs in which individual POpeak/kg scores were presented with respect to age- and sex-specific healthy reference values, showed that only two out of the ten participants who were “at risk” at 6 weeks, did achieve reference values of exercise capacity 6 months after discharge.
Discussion
This study described the course of exercise capacity in pediatric burn patients after discharge from the burn center. Group level exercise capacity improved significantly over time in our study population, but healthy reference values of exercise capacity were not achieved within 6 months after discharge. Individual assessment showed that 48% of the pediatric burn patients scored more than one SD below the age- and sex-specific healthy reference value 6 months after discharge and was therefore considered “at risk” for diminished functioning, participation, and quality of life [Citation5–7]. Prior assessment of exercise capacity with the Steep Ramp Test (SRT) predicted exercise capacity 6 months after discharge, and can therefore be used to identify “at risk” patients at an early stage.
Until now, all longitudinal studies on exercise capacity during the first year after pediatric burns were performed by the research group of the Shriners Hospital for Children in Galveston, U.S.A. [Citation6,Citation14–18,Citation22–27]. It is hard to make a fair comparison between these studies and our findings, as the Galveston patients suffered from more extensive burns compared to our participants (>30% or >40% versus <35% TBSA burned, respectively). Moreover, the Galveston studies focused primarily on the effects of exercise therapy, either or not combined with drug therapy (e.g. oxandrolone, propranolol, metformin, growth hormone), and not on the natural course of exercise capacity. The best option is to compare our findings to the results of the Galveston patients who served as control and did not participate in any structured exercise [Citation14–16]. In these patients, exercise capacity improved with 3.12 ± 3.5% to 9.35 ± 16.8% from 3 to 6 months after discharge, which is comparable to the 5.5 ± 6.3% improvement found in our study population. Patients who participated in a 12-week structured exercise program during this period showed considerably larger improvements in exercise capacity (up to 24.3 ± 4.7%) [Citation14–16]. In the more recent studies, the exercise program is started immediately after discharge and is offered to all pediatric burn patients (i.e. no control groups). This current exercise regime leads to even larger improvements in exercise capacity (up to 30%) [Citation22–27].
Given the obvious benefits of such a structured exercise program after discharge [Citation6,Citation18,Citation22–27], current practice guidelines state that this should be prescribed to all pediatric burn patients aged ≥7 years who score ‘below normal’ levels of exercise capacity [Citation43]. However, such an in-hospital program is expensive and the child is away from home, school, family, and friends for an extended period of time. The question is, do all pediatric burn patients who score ‘below normal’ at discharge from the burn center need this kind of intensive rehabilitation? Thus far, the rehabilitation needs of the general pediatric burn population were unknown. Hence, this preliminary study offers essential new insights. We showed that 75% of the patients scored ‘below normal’ on exercise capacity at discharge, but half of them achieved healthy levels of exercise capacity within 6 months without specific intervention. The other half did not and these patients do need additional attention.
The current study also showed that the course of exercise capacity varied widely among patients. The large SDs in the rates of change presented in the Galveston studies suggest that this was also the case in their study populations. Unfortunately, none of these studies reported individual scores, so it remains unclear if some of their participants did reach, or approach, healthy reference values, or that exercise capacity was significantly reduced in the entire study population.
To our knowledge, this preliminary study was the first to examine potential predictors of exercise capacity following pediatric burns. Burn severity characteristics, like %TBSA, number of surgeries, and length of hospital stay, did not predict exercise capacity 6 months after discharge. These findings are in line with previous research on functional outcome at 6 months post-burn in patients of the same age and with similar burn characteristics (<1–35% TBSA) [Citation44]. The fact that sports participation was a borderline non-significant predictor (p = 0.076), suggests a potential better outcome for those who participated in formal sports activities compared to those who did not. Our finding that SES and behavioral problems were significant predictors of exercise capacity is also in agreement with previous findings, as both sociodemographic factors were also found to be significant predictors of functional outcome [Citation44]. However, as SES and behavioral problems are known to influence physical activity levels as well [Citation45–48], it could be the case that the patients with behavioral problems and/or low SES already had low exercise capacity before the burn injury. Likewise, the five children from our study sample who already achieved healthy reference values of exercise capacity at discharge, might have had excellent exercise capacity before the injury. Nevertheless, no matter how big the decline in exercise capacity after discharge, some improvement was to be expected within 6 months, if only through ending the periods of bed rest and through natural growth and development. Therefore, the inconsistency or even decline in exercise capacity observed in five of our participants is definitely worrying.
Undeniably the most important finding of the current study was the predictive value of prior assessment of exercise capacity. Prior SRT assessment could explain up to 93.1% of the variance in exercise capacity 6 months after discharge. Although further research is required to confirm these preliminary results, this short and feasible bicycle exercise test appears valuable in identifying patients who are likely not to achieve healthy reference values of exercise capacity within 6 months. All pediatric burn patients who are considered “at risk” at 6 weeks after discharge, should receive additional attention.
What this additional attention should include, is still a point of discussion. For now we recommend to encourage sports participation and an active lifestyle in these patients, and provide them with the opportunity to enjoy physical activities in their own environment, together with their family and friends. Regular assessment of their exercise capacity at the burn center is essential though [Citation43]. This might also be a good motivator for them. Proper education of the patients and their parents, (physical education) teachers, and sports trainers/coaches, might also be valuable, as they are not always aware of the benefits of, or even need for, physical activity, and might fear a harmful effect [Citation49]. An additional opportunity might be the use of telerehabilitation; the use of virtual services to deliver health education, rehabilitative exercises, and personalized support [Citation49–51].
Although standard cardiopulmonary exercise testing (CPET) remains the golden standard for the assessment of exercise capacity, the SRT was chosen deliberately for this study, as it has several advantages in daily clinical practice. First, the SRT is easier to perform and does not require expensive equipment for respiratory gas analyses [Citation33]. Participants do not have to wear a face mask or mouthpiece, which makes the SRT more appropriate in anxious young children and patients suffering from facial burns. Second, the actual test duration is much shorter compared to the CPET, 2–3 min versus 8–12 min, respectively [Citation32]. Third, the test is well tolerated by pediatric patients and when they were asked about their preferential maximal exercise test, all patients indicated that they favored performing the SRT over a traditional CPET [Citation34]. Accordingly, lower values for exhaustiveness were reported after the SRT when compared to the CPET [Citation33,Citation34]. Last but not least, POpeak, the primary outcome measure of the SRT, seems to be a better indicator of daily life performance in children and adolescents than maximal oxygen uptake [Citation32,Citation52]. The only disadvantage of the SRT is that maximal effort cannot be identified objectively, as POpeak is generally determined by local muscle fatigue and maximal heart rate is not attained [Citation33].
Strengths and limitations
Although this study should be seen as a pilot study considering the limited number of 24 patients, it is a first and important start to gain insight in the course of exercise capacity in the general pediatric burn population and, morerover, the factors predicting the recovery of exercise capacity. Our study population was considered representative for the Dutch pediatric burn population, with a large variety in demographics and burn characteristics and no differences between participants and non-participants were found. The use of Z-scores enabled a valid comparison of this heterogeneous pediatric patient population with reference values from healthy Dutch peers. Furthermore, our study highlights the importance of focusing on individual scores. As group level exercise capacity was not significantly reduced 6 months after discharge, it might have seemed unnecessary to pay attention to exercise capacity following pediatric burns affecting <35% of TBSA. However, group level performance is not of interest for individual patients and their parents. Actually, it is important for every individual patient to perform within healthy ranges, and therefore, the eleven “at risk” patients deserve special attention.
Limitations of this study are, first of all, that selection bias might have occurred with especially those who were already interested in sports and physical activity willing to participate. This implies that the proportion of pediatric burn patients who are “at risk” might be even higher than the 48% presented in this study. Secondly, some of the burn and/or sociodemographic characteristics will be mutually related and, accordingly, a combination of characteristics in a multivariate regression model might have been able to explain more of the variance in exercise capacity 6 months after discharge. However, due to the small number of subjects included in this study, it was not possible to perform multivariate multilevel regression analyses. Further research, including larger patient populations, is definitely required to gain insight in the potential mutual dependency of burn and/or sociodemographic characteristics and to enable generating a stronger prediction model that enables identification of “at risk” patients at an early stage. Moreover, if burns are included as a single factor in the multilevel regression analysis, it would even be possible to use data from other pediatric patient populations, e.g. juvenile idiopathic arthritis or childhood cancer, to examine the predictive value of sociodemographic characteristics on the recovery of exercise capacity.
Implications for clinical practice
The current study showed that half of the pediatric patients with burns affecting <35% TBSA did not reach healthy reference values of exercise capacity within 6 months after discharge and were therefore considered “at risk” for diminished functioning, participation, and quality of life [Citation5–7]. It should be clear that exercise capacity following - even minor - pediatric burns deserves more attention. As the SRT outcome at 6 weeks after discharge was able to predict which children had a reduced recovery of exercise capacity, we recommend incorporating the assessment of this short and feasible exercise test during the regular 6-week follow-up visit for all pediatric burn patients older than 6 years of age who have been hospitalized for their burns. Patients who are identified “at risk” should be encouraged to participate in sports and active play on a regular basis, in order to prevent serious deconditioning. Personal support in the form of education and structured exercise using additional (tele)rehabilitation might be valuable as well. Furthermore, it is important to continue to monitor their exercise capacity beyond 6 months.
Implications for future research
The results of the current study are part of a larger multidimensional study which also comprised the assessment of body composition, joint range of motion, muscular strength, physical activity and sedentary behavior, perceived fatigue, and health-related quality of life. These results have to be analyzed and will be discussed in future publications, also in relation to the current findings. Additionally, it would be interesting to assess how our participants will do in several years, and when they reach adulthood. With regard to our speculations about encouraging sports participation and adopting an active lifestyle, it should be evaluated to determine if this has the desired effect.
Further (international) research, including larger patient populations, is definitely required to confirm our preliminary finding that early application of the SRT can identify patients who are likely not to achieve healthy reference values of exercise capacity within 6 months after discharge. We encourage the development of a multivariate multilevel regression model, including burn characteristics, sociodemographic characteristics, and the SRT outcome at discharge, which enables the identification of “at risk” patients already at the point of discharge.
Conclusion
Although group level exercise capacity improved significantly within 6 months after discharge, 48% of the participants did not achieve healthy reference values and was therefore considered “at risk” for diminished functioning, participation, and quality of life. Our results suggest that early application of the SRT can identify those individuals. However, data from larger patient populations are required to strengthen this preliminary conclusion.
Acknowledgements
The authors would like to thank all the children and parents who participated in this study. We also acknowledge the staff and research groups from the burn centers of the Red Cross Hospital Beverwijk and the Maasstad Hospital Rotterdam who were responsible for the inclusion and assessment of the participants who were admitted to their burn centers, specifically D.C. Baas PhD, A.A. Boekelaar RN, N. Trommel RN, A. Vlaanderen PT, and P.M. van Eesteren, PT. Finally, we would like to thank the Dutch Burn Repository Group, for their contribution to the Dutch Burn Repository and, accordingly, the Dutch Burns Foundation Beverwijk, Red Cross Hospital Beverwijk, Maasstad Hospital Rotterdam, and Martini Hospital Groningen for their support to the Dutch Burn Repository.
Disclosure statement
The authors report no conflicts interest.
Correction Statement
This article has been republished with minor changes. These changes do not impact the academic content of the article.
Additional information
Funding
References
- Hart DW, Wolf SE, Chinkes DL, et al. Determinants of skeletal muscle catabolism after severe burn. Ann Surg. 2000;232:455–465.
- Jeschke MG, Chinkes DL, Finnerty CC, et al. Pathophysiologic response to severe burn injury. Ann Surg. 2008;248:387–401.
- Hart DW, Wolf SE, Mlcak R, et al. Persistence of muscle catabolism after severe burn. Surgery. 2000;128:312–319.
- Ryan CM, Parry I, Richard R. Functional outcomes following burn injury. J Burn Care Res. 2017;38:e614–e7.
- Painter P. Exercise for patients with chronic disease: physician responsibility. Curr Sports Med Rep. 2003;2:173–180.
- Hardee JP, Porter C, Sidossis LS, et al. Early rehabilitative exercise training in the recovery from pediatric burn. Med Sci Sports Exerc. 2014;46:1710–1716.
- World Health Organization. International classification of functioning, disability and health: children & youth version (ICF-CY). Geneva, Switzerland. WHO Press, World Health Organization; 2007.
- Ortega FB, Ruiz JR, Castillo MJ, et al. Physical fitness in childhood and adolescence: a powerful marker of health. Int J Obes. 2008;32:1–11.
- Ruiz JR, Castro-Pinero J, Artero EG, et al. Predictive validity of health-related fitness in youth: a systematic review. Br J Sports Med. 2009;43:909–923.
- Stone J, Gawaziuk JP, Khan S, et al. Outcomes in adult survivors of childhood burn injuries as compared with matched controls. J Burn Care Res. 2016;37:e166–73.
- Duke JM, Randall SM, Fear MW, et al. Respiratory morbidity after childhood burns: a 10-year follow-up study. Pediatrics. 2016;138:e20161658.
- Duke JM, Randall SM, Fear MW, et al. Long-term effects of pediatric burns on the circulatory system. Pediatrics. 2015;136:e1323–30.
- Duke JM, Randall SM, Fear MW, et al. Increased admissions for musculoskeletal diseases after burns sustained during childhood and adolescence. Burns. 2015;41:1674–1682.
- Suman OE, Mlcak RP, Herndon DN. Effect of exercise training on pulmonary function in children with thermal injury. J Burn Care Rehabil. 2002;23:288–293; discussion 7.
- Suman OE, Thomas SJ, Wilkins JP, et al. Effect of exogenous growth hormone and exercise on lean mass and muscle function in children with burns. J Appl Physiol. 2003;94:2273–2281.
- Przkora R, Herndon DN, Suman OE. The effects of oxandrolone and exercise on muscle mass and function in children with severe burns. Pediatrics. 2007;119:e109–16.
- Porro LJ, Al-Mousawi AM, Williams F, et al. Effects of propranolol and exercise training in children with severe burns. J Pediatr. 2013;162:799–803 e1.
- Pena R, Ramirez LL, Crandall CG, et al. Effects of community-based exercise in children with severe burns: a randomized trial. Burns. 2016;42:41–47.
- Wurzer P, Voigt CD, Clayton RP, et al. Long-term effects of physical exercise during rehabilitation in patients with severe burns. Surgery. 2016;160:781–788.
- Hundeshagen G, Herndon DN, Clayton RP, et al. Long-term effect of critical illness after severe paediatric burn injury on cardiac function in adolescent survivors: an observational study. Lancet Child Adolesc Health. 2017;1:293–301.
- Rivas E, Herndon DN, Beck KC, et al. Children with burn injury have impaired cardiac output during submaximal exercise. Med Sci Sports Exerc. 2017;49:1993–2000.
- Clayton RP, Wurzer P, Andersen CR, et al. Effects of different duration exercise programs in children with severe burns. Burns. 2017;43:796–803.
- Chao T, Porter C, Herndon DN, et al. Propranolol and oxandrolone therapy accelerated muscle recovery in burned children. Med Sci Sports Exerc. 2018;50:427–435.
- Cambiaso-Daniel J, Rivas E, Carson JS, et al. Cardiorespiratory capacity and strength remain attenuated in children with severe burn injuries at over 3 years postburn. J Pediatr. 2018;192:152–158.
- Rivas E, Herndon DN, Chapa ML, et al. Children with severe burns display no sex differences in exercise capacity at hospital discharge or adaptation after exercise rehabilitation training. Burns. 2018;44:1187–1194.
- Rivas E, Tran J, Gutierrez IL, et al. Rehabilitation exercise increases physical activity levels in severely burned children while improving aerobic exercise capacity and strength. J Burn Care Res. 2018;39:881–886.
- Rivas E, Herndon DN, Porter C, et al. Short-term metformin and exercise training effects on strength, aerobic capacity, glycemic control, and mitochondrial function in children with burn injury. Am J Physiol Endocrinol Metab. 2018;314:E232–E40.
- Disseldorp LM, Mouton LJ, Van der Woude LH, et al. Anthropometry, muscular strength and aerobic capacity up to 5 years after pediatric burns. Burns. 2015;41:1839–1846.
- Valenciano PJ, Itakussu EY, Trelha CS, et al. Anthropometric characteristics, functional capacity of exercise, and physical activity of children who suffered burns. Fisioterapia e Pesquisa 2017;24:371–377.
- Akkerman M, Mouton LJ, Disseldorp LM, et al. Physical activity and sedentary behavior following pediatric burns – a preliminary investigation using objective activity monitoring. BMC Sports Science, Medicine and Rehabilitation 2018;10:4.
- Disseldorp LM, Mouton LJ, Takken T, et al. Design of a cross-sectional study on physical fitness and physical activity in children and adolescents after burn injury. BMC Pediatr. 2012;12:195.
- Bongers BC, de Vries SI, Obeid J, et al. The Steep Ramp Test in Dutch white children and adolescents: age- and sex-related normative values. Phys Ther. 2013;93:1530–1539.
- Bongers BC, DE Vries SI, Helders PJM, et al. The steep ramp test in healthy children and adolescents: reliability and validity. Med Sci Sports Exerc. 2013;45:366–371.
- Bongers BC, Werkman MS, Arets HG, et al. A possible alternative exercise test for youths with cystic fibrosis: the steep ramp test. Med Sci Sports Exerc. 2015;47:485–492.
- Braam KI, Van Dulmen-Den Broeder E, Veening MA, et al. Application of the steep ramp test for aerobic fitness testing in children with cancer. Eur J Phys Rehabil Med. 2015;51:547–555.
- Schokker DF, Hekkert KD, Kocken PL, et al. Meten van lichamelijke activiteit van kinderen: vragenlijsten vergeleken met versnellingsmeter. Tijds Gezondheidswetenschappen. 2012;90:434–441.
- van Baar ME, Essink-Bot ML, Oen IM, et al. Reliability and validity of the Dutch version of the American Burn Association/Shriners Hospital for Children Burn Outcomes Questionnaire (5-18 years of age). J Burn Care Res. 2006;27:790–802.
- Curtis AE, Smith TA, Ziganshin BA, et al. The mystery of the Z-score. Aorta (Stamford). 2016;4:124–130.
- Varni JW, Burwinkle TM, Seid M, et al. The PedsQL 4.0 as a pediatric population health measure: feasibility, reliability, and validity. Ambul Pediatr. 2003;3:329–341.
- Akkerman M, Mouton LJ, Dijkstra F, et al. Perceived fatigue following pediatric burns. Burns. 2017;43:1792–1801.
- TNO growth calculator for professionals [Internet]. Leiden, The Netherlands: TNO innovation for life; [cited 2017 Jun 6]. Available from: https://www.tno.nl/nl/aandachtsgebieden/gezond-leven/roadmaps/prevention-work-health/gezond-en-veilig-opgroeien/groeicalculator-voor-professionals/
- de Onis M, Lobstein T. Defining obesity risk status in the general childhood population: which cut-offs should we use? Int J Pediatr Obes. 2010;5:458–460.
- Nedelec B, Parry I, Acharya H, et al. Practice guidelines for cardiovascular fitness and strengthening exercise prescription after burn injury. J Burn Care Res. 2016;37:e539–e58.
- Tyack ZF, Ziviani J. What influences the functional outcome of children at 6 months post-burn? Burns. 2003;29:433–444.
- Bowser J, Martinez-Donate AP, Carrel A, et al. Disparities in fitness and physical activity among children. WMJ. 2016;115:245–250.
- Finger JD, Mensink GB, Banzer W, et al. Physical activity, aerobic fitness and parental socio-economic position among adolescents: the German Health Interview and Examination Survey for Children and Adolescents 2003-2006 (KiGGS). Int J Behav Nutr Phys Act. 2014;11:43.
- Cook BG, Li D, Heinrich KM. Obesity, physical activity, and sedentary behavior of youth with learning disabilities and ADHD. J Learn Disabil. 2015;48:563–576.
- Khalife N, Kantomaa M, Glover V, et al. Childhood attention-deficit/hyperactivity disorder symptoms are risk factors for obesity and physical inactivity in adolescence. J Am Acad Child Adolesc Psychiatry. 2014;53:425–436.
- Armbrust W, Bos G, Wulffraat NM, et al. Internet program for physical activity and exercise capacity in children with juvenile idiopathic arthritis: a multicenter randomized controlled trial. Arthritis Care Res (Hoboken). 2017;69:1040–1049.
- dos Santos MT, Moura SC, Gomes LM, et al. Telehealth application on the rehabilitation of children and adolescents. Rev Paul Pediatr. 2014;32:136–143.
- De Bourdeaudhuij I, Maes L, De Henauw S, et al. Evaluation of a computer-tailored physical activity intervention in adolescents in six European countries: the Activ-O-Meter in the HELENA intervention study. J Adolesc Health. 2010;46:458–466.
- Woude L, Groot S, Drongelen S, et al. Evaluation of manual wheelchair performance in everyday life. Topics Spinal Cord Injury Rehabil. 2009;15:1–15.