

 ?Mathematical formulae have been encoded as MathML and are displayed in this HTML version using MathJax in order to improve their display. Uncheck the box to turn MathJax off. This feature requires Javascript. Click on a formula to zoom.
ABSTRACT
Whilst a growing literature has documented the link between academic rank and educational progression, the effect of socioeconomic rank on these outcomes has been largely neglected. Using longitudinal data and exploiting the idiosyncratic variation in test score distributions across secondary school classes, I analyze the impact of within-class academic and socioeconomic rank on educational outcomes in Chile. I show that being relatively advantaged (socioeconomically or academically) compared to one’s classmates leads to a greater likelihood of positive educational progression outcomes. Results suggest socioeconomic rank is not simply proxying the influence of within-class academic rank on young people’s educational progression.
JEL CLASSIFICATION:
1. Introduction
The influence of school and class peers has been widely studied. A vast literature on peer effects has argued about the benefits of surrounding yourself with high-performing peers (Booij, Leuven, and Oosterbeek Citation2016; Kremer and Levy Citation2008; Sacerdote Citation2011; Whitmore Citation2005), and drawbacks of sharing the school or classroom with low-performing peers (Carrell, Fullerton, and West Citation2009; Carrell, Hoekstra, and Kuka Citation2018; Lavy, Silva, and Weinhardt Citation2012).
However, there is another mechanism through which peer’s characteristics affect educational progression outcomes: ordinal position – otherwise known as ‘rank’. Rank effects are a particular type of peer effect relating to their relative position in their school or class. According to the psychology theory on Big Fish Little Pond effects (BFLP, Marsh Citation1987), since students lack information about their ability (Stinebrickner and Stinebrickner Citation2012; Zafar Citation2011) they use their relative ability (rank) as a marker of their true ability – or comparative advantage – and compare their achievements against their school or class peers. Literature has indicated BFLP effects impact a range of outcomes such as academic self-concept, motivation, and aspirations (Roy, Guay, and Valois Citation2015; Wentzel et al. Citation2010); which in turn influence academic effort, interest and attainment (Alivernini and Lucidi Citation2011; Marsh et al. Citation2005; Marsh and O’Mara Citation2008).
Using data from the UK, US, Sweden, Italy and Greece a flourishing literature on academic rankFootnote1 has reported rank determines subject choice and track selection (Goulas, Griselda, and Megalokonomou Citation2022; Murphy and Weinhardt Citation2020) and is positively linked with tests scores, the probability of finishing high school, attending college, and choosing STEM (Murphy and Weinhardt Citation2020; J. Carneiro et al. Citation2024; Dadgar Citation2021; Delaney and Devereux Citation2022; Denning, Murphy, and Weinhardt Citation2023; Elsner and Isphording Citation2017; Payne and Smith Citation2020). Also, the literature has reported academic rank to be negatively linked to violent behavior (Comi et al. Citation2020) and behavioral issues (Cicala, Fryer, and Spenkuch Citation2018), higher conscientiousness (Pagani, Comi, and Origo Citation2021) and higher earnings (Dadgar Citation2021; Denning, Murphy, and Weinhardt Citation2023).
Despite the strong association between a student’s academic achievement and socioeconomic status, the study of the role of students’ ordinal socioeconomic position in determining future educational achievements has been mostly neglected. The literature on socioeconomic rank has focused on other outcomes such as political preferences, mortality, health and mental health, among others (Brown-Iannuzzi, Lundberg, and McKee Citation2021; Kraus, Tan, and Tannenbaum Citation2013; Paffenholz Citation2022). Jerrim, Lopez-Agudo, and Marcenaro-Gutierrez (Citation2021) is the only paper that to my knowledge analyses the role of ordinal rank socioeconomic status in explaining educational outcomes and finds socioeconomic rank to be negatively associated with grade retention and positively associated with performance in standardized tests and attitudes toward school. The related literature on relative income or wealth deprivation has posited that since individuals have interpersonal preferences, the comparison to others doing better is associated with worse health outcomes and lower well-being, social and job satisfaction, among others (Balsa, French, and Regan Citation2014; Eibner and Evans Citation2005; Luttmer Citation2004). The few papers that have examined the role of relative deprivation on educational outcomes suggest relative deprivation negatively affects educational attainment (Destin et al. Citation2012; Esposito and Villaseñor Citation2019; Verkuyten Citation2016; Wilkinson and Pickett Citation2007), but also that the effect fades away when controlling for absolute measures of family background (Nieuwenhuis and Chiang Citation2021).
This paper builds on such previous work by using administrative records from over one million students to investigate how rank position within one’s class (both academic and socioeconomic) impacts education progression outcomes in Chile. It contributes to the literature in several ways. First, I investigate the impact of both academic and socioeconomic rank on educational progression outcomes. As noted above, very few previous studies have considered this issue, including whether academic and socioeconomic rank effects are offsetting or adding to one another. Secondly, I do this in Chile, a country where rank effects have not been studied before. Third, I follow the approach of Murphy and Weinhardt (Citation2020) and estimate the impact of 10th-grade class rank (instead of school-rank or single-class schools) on future educational outcomes. This is important as students are more likely to know their relative position within smaller groups (i.e. classes versus schools) (Thijs, Verkuyten, and Helmond Citation2010; Townsend Citation2007). Finally, the data I use includes two measures of students’ achievement: Grade Point Average (GPA) and standardized test scores, which allows for a more complete identification of achievement, thus allowing a better identification of the rank effect of GPA compared to what has been previously done in the literature.
Results show that conditional on individual characteristics and class-cohort fixed-effects, being on the top of one’s class compared to the bottom in both academic and socioeconomics terms leads to increases in the probability of completing secondary education, enrolling in higher education, enrolling in academic rather than vocational higher education, enrolling in a STEM subject and completing higher education. This suggests that despite the well-known correlation between academic achievement and socioeconomic status, the ranking effect of these measures operates independently, and both affect educational progression outcomes for years after rank is measured.
Teachers’, parents’, and child’ expectations could act as mechanisms beneath the effect of rank. Educational expectations are influenced by resources related to family socioeconomic status (Sewell, Haller, and Portes Citation1969), and individual-level factors such as cognitive ability, parental influence, and academic achievement; which also influence educational attainment (Andrew and Hauser Citation2011; Bozick et al. Citation2010; Sewell, Haller, and Portes Citation1969). The way in which parents and schools respond to student rank and allocate their resources may affect the direction of the effect of rank on educational outcomes. If a school allocates more or higher quality resources to the top performing students (Allen and Sims Citation2018) or teachers’ pay more attention to more advantaged students (Pop-Eleches and Urquiola Citation2013) the effect is likely to be positive, but the opposite holds true if schools allocate better resources to the least able students. Similarly, parents may change their involvement, behaviors, and expectations according to how advantaged or disadvantaged their children is with respect to their peers, which will also impact the direction of the effect (Murphy and Weinhardt Citation2020). Finally, there are institutional factors external to the students who are determined by rank. If, for example, teachers grade on a curve, having a lower rank tends to reduce student’s GPA and hence, their educational progression (Calsamiglia and Loviglio Citation2019). Rank effects can also affect educational progression in settings where rankings are used to prioritize college entry.
The paper now proceeds as follows. Section 2 describes the data, and Section 3 presents the methodology. Results follow in Section 4, with a discussion presented in Section 5.
2. Materials and methods
2.1. Data
I draw on a set of publicly availableFootnote2 Chilean administrative registers. These form a longitudinal dataset following individuals who took math and language examinations (‘SIMCE’) when they were in the 10th grade at age 15 and 16, through tertiary education.
SIMCE is a standardized test administrated annually by the Ministry of Education of ChileFootnote3 used to measure students’ progression in Math and Language at certain grades. Test scores from SIMCE are comparable across schools and years. Average test scores are publicly disclosed and strongly disseminated at the aggregate school level, but results are never informed at the student level. When students take SIMCE, their parents also answer a questionnaire that includes questions about family background (average response rate of 79.5%). I use all the cohorts that took SIMCE in the 10th grade between 2003 (first-year data available) until 2012,Footnote4 linked to data on secondary and/or tertiary education outcomes between 2007 and 2019. Importantly, I can observe the students’ GPA – a continuous measure of a student’s average achievement across subjects that ranges between 1 and 7. Further information on Chile’s education system is provided in appendix 1.
A key advantage of these data is that it contains information about the class to which each student attended in each year. Another is that allows me to observe non-continuous trajectories, e.g. those of students who repeated grades, changed from institutions, dropout and then went back to education, or simply took some time in between secondary and tertiary education. Finally, it also includes information on individual and family characteristics that could influence the link between socioeconomic rank, academic rank and educational outcomes.
2.1.1. Sample selection
The initial sample contains 1,109,717 students who took the SIMCE tests in the 10th grade between 2003 and 2012, distributed across 36,060 classes and 12,519 schools. I exclude those in classes with less than 10 students (N = 2415 students from 335 schools) and those with no information on GPA (N = 14,718, corresponding to 1.3% of the sample). This leaves a total analytic sample of 1,092,584 students distributed across 35,650 classes and 12,266 schools. These pupils are then ranked according to their academic and socioeconomic position within their class and school. The average class and school size are 33.4 and 172 students, respectively. A comparison of the population and sample descriptive statistics for the outcome variables is provided in appendix Table A1.
2.1.2. Measurement of human capital
Following previous literature (Carneiro et al. Citation2024; Comi et al. Citation2020; Dadgar Citation2021; Elsner, Isphording, and Zölitz Citation2021; Pagani, Comi, and Origo Citation2021), I use students’ 10th-grade GPA as my preferred measure of human capital. GPA is a continuous measure of student’s average achievement across subjectsFootnote5 that range between 1 and 7. GPA is measured at the end of the year, and the grade in each subject is based on several tests the students give throughout the year to evaluate their accomplishment of the learning goals and understanding of the national curricula defined by the Chilean Ministry of Education. The minimum passing grade is 4.0.
Whilst standardized test scores have the advantage of being an objective measure of achievement and have been used by a relevant part of the literature to measure academic rank (J. M. Delaney and Devereux Citation2021; Denning, Murphy, and Weinhardt Citation2023; Elsner and Isphording Citation2017; Murphy and Weinhardt Citation2020), the choosing of using GPA over SIMCE (a standardized test score) as the preferred measure to create academic rank is based on two grounds. First, SIMCE standardized scores cannot be used because its matrix design (similar to other international standardized test scores such as PISA) makes individual results not valid to understand individual learning and has huge measurement error at the individual level. Relatedly, SIMCE standardized test scores are less salient than GPA. Salience is a key characteristic of rank measures because for a student to respond to their rank, they need to have some knowledge of it (J. Delaney and Devereux Citation2022; Murphy and Weinhardt Citation2020). The literature has reported a strong and positive correlation between objective and self-perceived ability rank, which indicates students do indeed have some knowledge of their position in the hierarchy (Elsner and Isphording Citation2017; Pagani, Comi, and Origo Citation2021; Yu Citation2020). Since SIMCE standardized test scores are not reported back to students, it is impossible for students to deduct their rank using this measure. Conversely, students are likely to have good knowledge of their own GPA as well as the GPA of their class peers. First panel in appendix figure A1 shows the distribution of GPA.
2.1.3. Measurement of socioeconomic background
To reflect the fact that socio-economic circumstances are multidimensional and cannot be captured by a single indicator alone (OECD 2017; Citation2016), and to obtain a continuous measure of SES circumstances that allow me to rank students within their class, I follow Jerrim, Lopez-Agudo, and Marcenaro-Gutierrez (Citation2021) and create a composite measure of socio-economic status. The continuous socio-economic status index was created by applying item response theory (IRT)-graded response models to the categorical variables that are present for all cohorts in the SIMCE questionnaire: paternal education, maternal education, and household income; thus, reflecting different aspects of children’s family background. Higher values of the SES index reflect higher socioeconomic advantage. I standardized the SES index within cohort, so the index has mean 0 and standard deviation 1 (see the appendix, Table A2). Second panel in the appendix, Figure A1 shows the socio-economic status index distribution.
Salience is also relevant for socioeconomic rank: for a student to respond to it, they need to have an idea about their relative socioeconomic position within their class. Whilst students are not officially informed of their peer’s socioeconomic status, the literature has established they effortlessly and unconsciously learn this through repeated interaction based on subjective judgements about their own and their peers’ economic resources (income, wealth, education and occupational prestige, among others), sociocultural experiences within their families, school and workplace, and social comparisons (Brown-Iannuzzi, Lundberg, and McKee Citation2021; Kraus, Tan, and Tannenbaum Citation2013; Stephens, Markus, and Taylor Phillips Citation2014). Whilst this learning process may also occur at the school level, daily interaction within the classroom allows classmates to assess each other’s socioeconomic background as well as obtain detailed information on each other’s family resources (Chiang and Lareau Citation2018). In Chile, the literature has established university students can accurately ascertain the socioeconomic position of a person based on surnames (Nuñez and Gutierrez Citation2004) and skin color (Torres et al. Citation2019).
2.1.4. Rank measures
The level at which rank is measured is important to inform student’s perception of their relative position. Most of the literature on the topic has measured rank at the school-cohort level (Dadgar Citation2021; Delaney and Devereux Citation2021; Elsner and Isphording Citation2017). Those who have done it at a lower level have done it at the school-subject-cohort level (Denning, Murphy, and Weinhardt Citation2023; Murphy and Weinhardt Citation2020). According to Delaney et al. (2022),
[f]or the most part, researchers have not been able to measure how students rank within individual classrooms. Instead, most of the literature measures the academic rank of each student amongst children in the same year group in the same school. (3)
I rank students in ascending order; those with the lowest score (GPA and socioeconomic index) within the class are assigned the first position and the student with the highest score the last.Footnote7 For academic rank, this implies low-attainment students are in the first position and high-attainment students in the last. For socioeconomic rank, this results in the least socioeconomically advantaged student within the class occupies the first position and the most advantaged the last. Consistent with the literature, I then transform the rank position () into a local percentile rank (
) so that it’s comparable across schools and classes of different sizes:
where
is the cohort size of class j in school s in cohort c. An individual’s ordinal rank position within this set is
, which increases test score to a maximum of
. Note that this rank measure will be uniformly distributed and bounded between 0 and 1, with the lowest-ranked student in each class cohort having R = 0 and the highest-ranked having R = 1. In case of ties, both students are assigned the lower rank. Similar to Denning, Murphy, and Weinhardt (Citation2023), the human capital variables are measured at the same time as the group identifier, which poses no methodological risks since changes in human capital accumulation due to rank do not lead to systematic changes in rank (J. Delaney and Devereux Citation2022).
GPA rank is interpreted as a proxy for perceived ranking derived from previous interactions with peers, as well as repeated teacher feedback. Regarding the quality of observed rank as a proxy for perceived rank, previous literature has established that individuals have accurate perceptions of their position within a group (Anderson et al. Citation2006). It has also been shown that, conditional on test scores, higher academic rank is associated with higher confidence (Murphy and Weinhardt Citation2020; Rubie-Davies Citation2006; Tiedemann Citation2000). Furthermore, if individuals had no perception of their rank, I would expect to find no effect of rank on the outcomes.
On the other hand, while children’s socio-economic status captures whether the child comes from an advantaged or disadvantaged background compared to other children in the country, socio-economic rank indicates whether the child comes from an advantaged or disadvantaged background compared to other children within their class. I estimate that around 49.5% of the total variation in my SES scale occurs within classes, with the remaining 50.5% occurring between students in different classes.Footnote8 This illustrates that despite the high socioeconomic segregation of the Chilean educational system, it is still possible for a child to come from a high socio-economic background but be comparatively disadvantaged compared to their school and/or class (and vice-versa).
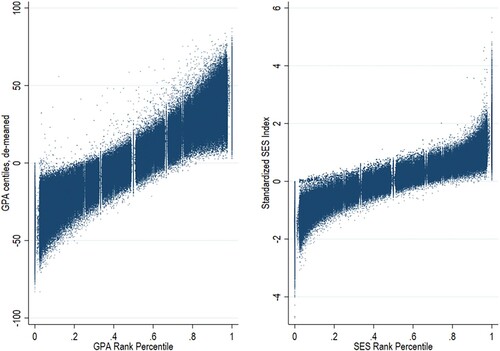
shows the distribution of students’ academic and socioeconomic class rank across rank percentiles. The left-hand panel illustrates that it is possible for students with the same GPA rank to have different relative positions according to their class size. The right-hand panel of further illustrates the variation in SES rank at a given SES level. The same figure for their school rank can be found in appendix Figure A2. Finally, appendix Figure A3 presents the local polynomial fit between GPA and class and school rank percentile.
Figure 1. Distribution of students across class-rank percentiles, by GPA (pct) and SES index (Std). Note: This figure shows SES index and GPA scores variation by rank. GPA and SES index are de-meaned by class-cohort.
2.1.5. Outcome variables
I use five binary outcome variables that represent different milestones of a student’s educational progression that occurred after 10th grade and up until 2019. High school completion is a binary variable that takes value 1 if students completed two more levels of education and graduated from high school, and 0 if students did not. Higher education enrollment takes value 1 for students who enrolled in any higher education institution, and 0 otherwise. For those students that did enroll in higher education, I created two binary indicators that take value 1 if they enrolled in academic rather than vocational higher education institutions, and on STEM rather than non-STEM programs. These variables take value 0 for students who enrolled in higher education vocational and non-STEM degrees, respectively. Finally, higher education completion takes value 1 for students who completed any higher education degree in the studied period, and 0 for students who enrolled in higher education but did not complete any degree. As explained in appendix 1, academic higher education degrees use a Higher Education entrance test called PSU to select incoming students. More information on the outcome variables can be found in appendix 2.
In the analytic sample, 84.3% of students completed their secondary education, and 74.6% enrolled in higher education. Conditional on having enrolled, 62.6% did so in an academic rather than vocational higher education institution, and 34.6% in a STEM rather than non-STEM degree. Finally, only 41.2% of the students who enrolled completed their higher education degree, which is consistent with national statistics (OECD Citation2019).
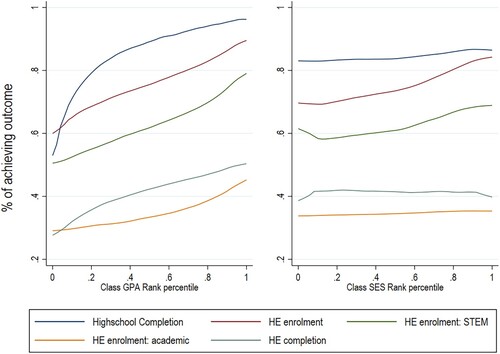
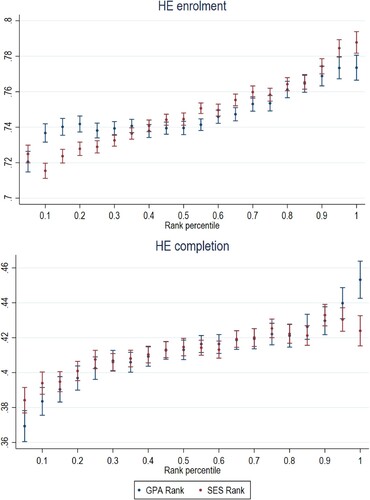
shows the prevalence of each outcome across GPA and SES within-class rank percentiles. It shows that higher-ranked students in terms of their GPA or socioeconomic status are more likely than their low-rank peers to enroll in higher education and enroll in STEM higher education. For high school completion, enrollment in academic rather than vocational higher education programs and higher education completion the picture is less clear: whereas higher ranked students according to their GPA are more likely to complete their higher education degree conditional on having enrolled, the same does not hold true for SES rank. Similarly, the association between rank percentile and completing secondary education and enrolling in academic higher education degree is positive when using GPA rank, but it is approximately zero when analyzing SES rank. The same figure for within-school rank percentiles is presented in appendix Figure A4. The correlation between GPA and SES class-rank is 0.058, which suggests there is plenty of independent variation to exploit.
Figure 2. Local polynomial fit of the outcomes by GPA and SES Class-rank percentile.
2.2. Methods
2.2.1. Model
I estimate the causal effect of rank on the outcomes using the same approach as in Murphy and Weinhardt (Citation2020) by exploiting the idiosyncratic variation in test score distributions across secondary school classes, conditional upon secondary school achievement. This variation in rank exists because students vary in ability and thus, students with the same achievement may have different rank in different classes (Murphy and Weinhardt Citation2020). I will thus be comparing students who have the same GPA or SES score relative to their class mean, but different ranks due to variation in the distribution of each of these scores across classes. To account for factors that would additively impact all students in a class such as peers, teachers, or unexpected events on test day, main estimates include class-cohort fixed effects. Then, my estimates compare students who have the same score (in achievement or SES index) relative to their class mean during secondary school, but different rank due to the score distribution of their class. I am thus exploiting variation in the score distribution across subjects, classes, and cohorts (for more information on the use of fixed effects, see appendix Table A3).
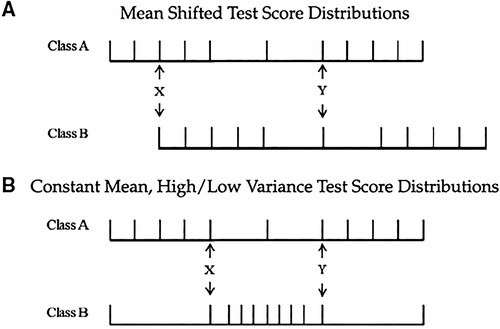
The intuition behind this approach is illustrated in (taken from Murphy and Weinhardt Citation2020, 2078) which presents two different scenarios (A and B). Both scenarios include two classes of eleven students, with student’s scores increasing from left to right. In the first scenario, the two classes have similar score distributions, but the distribution of class B is shifted to the right of class B. This means students with the same absolute score would have a lower rank in Class B than in Class A. In the second scenario, the two classes have the same mean, minimum and maximum student scores. The variance of scores in class B is however much smaller than in class A, which leads to students with the same absolute and relative-to-the-class mean scores having different ranks. For more information see Murphy and Weinhardt (Citation2020).
Figure 3. Rank dependent on test score distribution, taken from Murphy and Weinhardt (Citation2020, 2078).
I estimate linear probability models – with standard errors clustered at class-cohort level – that capture the link between children’s relative academic and socioeconomic position and their educational progression outcomes, conditional on other factors included in the model. The starting point for my analysis is the following model specification (model M1 and M2) for child i in class j and school s in cohort c:
(1)
(1) where
stands for the outcome of interest,
refers to the within-class percentile measure of GPA or SES index, and
to the absolute value used to compute rank.
corresponds to the SES index when estimating for SES rank. When estimating for academic rank,
corresponds to their 10th grade GPA in Model 0 and both their 10th-grade GPA and average of Math and Language SIMCE scores in Model 1. The simultaneous adjustment for SIMCE and GPA scores (correlation = 0.56) in Model 1 allows me to clean rank effects of absolute achievement effects in the most complete possible way.
Since test scores are a noisy measure of ability, both rank and scores are subject, to different extents, to the same measurement error. This type of nonsystematic measurement error is potentially problematic for our estimation strategy, as it could generate a spurious relationship between student rank and gains in test scores. To address this, I follow the strategy of Murphy and Weinhardt (Citation2020) and estimate the main models adjusting for within-cohort percentilized measures of achievement (GPA and SIMCE). I used the polynomial that was most appropriate based on the distribution of the measures against each outcome (See appendix Figures A5 and A6).
estimates hence capture the association of being relatively advantaged or disadvantaged compared to one’s classmates, amongst young people with similar individual achievement or socioeconomic status. As such, these estimates speak to rank effects, but likely also incorporate peer influence effects stemming from a student's relative standing amongst their peers.
Then, Model 3 simultaneously adjusts for both within-class rank measures and individual characteristics (achievement, SES index and sex)
(2)
(2)
Because of the adjustment for socioeconomic rank, estimates from these models will illustrate whether relative academic position continues to be associated with educational progression, over and above the potential influence of their relative and absolute socioeconomic position.
2.2.2. Balance tests
A key assumption is that a student’s academic and socioeconomic rank is effectively random conditional on achievement and socioeconomic status, respectively. This would not be the case if schools assign pupils non-randomly, or if parents chose schools (and classes) based on the rank their child would have.
Whilst it has been reported that in Chile parents choose schools based on the perceived achievement or socioeconomic characteristics of its students (Elacqua, Schneider, and Buckley Citation2006; Epple and Romano Citation1998; Hsieh and Urquiola Citation2006), it is unlikely that parents choose schools based on rank since it would require them to know the ability and socioeconomic status of their child and all their potential peers. Also, it is unfeasible for the analysis of class rank since parents do not choose the exact class to which their child is assigned.
With regards to school choice, there is evidence of socioeconomic and ability sorting between schools in Chile (Contreras, Sepúlveda, and Bustos Citation2010; Valenzuela, Bellei, and Ríos Citation2014). This relates to private and voucher schools being allowed to charge fees and to screen and select their students with ability tests, parental interviews and based on their demographic characteristics. Nonetheless, this should not affect within school or within-class rank. There is also evidence of within schools ability (but not socioeconomic) sorting (Treviño Citation2014; Treviño, Valenzuela, and Villalobos Citation2016), with sorting being more common among larger, municipal, academic and vulnerable schools.
To investigate whether classes are sorted according to individual and/or parental characteristics, I performed balance tests of academic rank conditional on achievement measures, shown in the first two columns of below. Conditional on the achievement measures and class-cohort fixed effects, class rank is statistically significantly associated with sex and high parental income, with students at the top of class being 1 and 0.8 percentage points more likely to be female (51.8%) and from the high parental income category (10.4%), respectively.Footnote9 To account for this, I follow (Denning, Murphy, and Weinhardt Citation2023)’s strategy and allow both achievement measures to vary by quartiles of mean class achievement which allows for comparison across classes with similar distributions. Column 2 in shows no imbalances in observable characteristics, and so allows me to assume the remaining variation in rank to be orthogonal to unobservable factors that determine our outcomes. Column 3 in shows the balance test for socioeconomic rank. The table shows some evidence of sorting according to sex, with students at the top of their class in socioeconomic terms being 0.9% more likely to be male.
Table 1 . Class academic rank balance tests.
When doing the same analysis for schools the story is different, with evidence of passive sorting of individuals according to their characteristics (See appendix Table A4). Conditional on achievement, students ranked at the top of their school in academic terms are 3.4% more likely to be female, 2.7% more likely to have high parental income and 1.6 less likely to have a parent with high education (27.6%). There is evidence of sorting on observable characteristics even after interacting individual achievement with school mean quartiles of achievement. This evidence of sorting across schools is consistent with the evidence of ability sorting between schools (Contreras, Sepúlveda, and Bustos Citation2010; Valenzuela, Bellei, and Ríos Citation2014). The positive association between parental income and rank is likely to lead to an upward bias in the school-level rank estimates.
3. Results
and present the summary of within-class rank coefficients estimated with linear probability models. Full estimation tables can be found in appendix, Tables A5–A9. Since rank is measured in percentiles, estimates refer to the marginal effect of ranking at the top of the class/school compared to the bottom. Throughout the article, the interpretation of the results is made in terms of the marginal effect of increasing rank by 1 decile.
Figure 4. Class-level academic and SES Rank coefficients (probability difference), estimated with fully adjusted linear probability model. 95% confidence intervals shown in error bars. Note: Bars show academic and socioeconomic rank coefficient, which reflect the difference in probability of achieving the outcome between the highest and the lowest ranked student in each class.
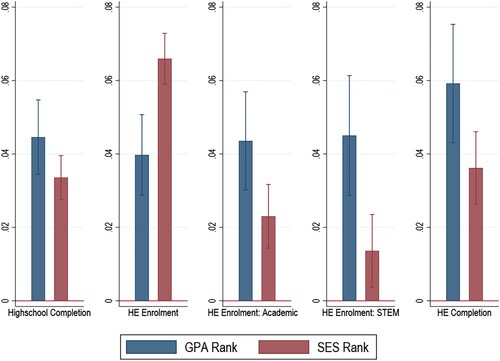
Table 2. Summary of academic and SES class-rank coefficient after linear probability estimations.
Model 0 and Model 1 estimates show academic rank has a positive effect on all the outcomes. Model 1 estimates adjusting for both measures of academic achievement (SIMCE and GPA) indicate that a one-decile increase in academic rank leads to an increase of around 0.4 percentage points in the probability of completing secondary education, enrolling in higher education, and enrolling in academic rather than vocational higher education. The impact of academic rank on the probability of enrolling in STEM higher education and of completing higher education is 0.45 and 0.59 percentage points, respectively. Model 2 shows socioeconomic rank also has a positive and statistically significant effect on all the outcomes. The larger effects are observed for the probability of completing secondary education and enrolling in higher education, with one decile increase in rank leading to increases of 0.58 and 0.86 percentage points in the likelihood of completing these milestones.
Whereas the magnitude of academic rank coefficients remains mostly unchanged when adjusting for within-class socioeconomic rank, the magnitude of socioeconomic rank shrinks for all the outcomes when adjusting for within-class academic rank (see M3 in and ). The effect of both ranks is positive and statistically significant. This allows me to establish that academic and socioeconomic rank effects are measuring different aspects of the impact of relative position and the outcomes.
highlights the differences between academic and socioeconomic rank. For all outcomes both the academic and socioeconomic rank effects on the outcomes are positive, suggesting their effects are additive. In terms of their magnitude, academic rank is bigger than socioeconomic rank only for the probability of enrollment in STEM rather than non-STEM higher education degrees. Conversely, for the probably of enrollment in higher education the effect of socioeconomic rank is larger than that of academic rank. For all other outcomes, there are no statistically significant differences between academic and socioeconomic rank.
3.1. School-level ranking analysis
As previously mentioned, most of the previous literature has measured rank at the school level. For comparability purposes, I re-estimate all models using school rank (), and most coefficients maintain their sign and statistical significance. Whilst the effect of GPA school rank on the probability of completing higher education is similar to that of class rank, the effect of school rank is larger than that of class rank for the probability of completing secondary education and enrollment in STEM higher education. Conversely, the magnitude of the effect of class rank is bigger than that of school rank for the probability of enrolling in higher education and enrollment in academic rather than vocational higher education. For SES rank, the effects are larger for school rank than for class rank for all outcomes but for the probability of enrollment in academic higher education, for which the two ranks have a similar effect.
Table 3 . Summary of academic school-rank coefficient after linear probability estimations.
Whilst students are more likely to know their relative position within smaller groups (i.e. classes versus schools) (Thijs, Verkuyten, and Helmond Citation2010; Townsend Citation2007), these results suggest students are not only aware of their school ranking, but for some outcomes in GPA rank and most outcomes in SES rank, the effects of school rank may be more important than that of class rank.
Fully adjusted estimates suggest that conditional on achievement, sex, socioeconomic status, and socioeconomic rank, one decile increase in academic rank leads to increases of 0.77, 0.18 and 0.23 percentage points in the probability of completing secondary education, enrolling in higher education and enrolling in academic rather than vocational higher education, respectively. Also, 1 decile increases in within-school academic rank are linked to increases of 0.92, and 0.51 percentage points in the probability of enrolling in STEM higher education and completing higher education institution.
Again, when including both ranks in the estimates both coefficients are positive and statistically significant. In terms of their magnitude, academic rank is bigger than socioeconomic rank for two out of five outcomes: secondary education completion, enrollment in STEM rather than non-STEM higher education. Conversely, the effect of socioeconomic rank is larger than that of academic rank on the probability of enrolling in higher education. The comparison between academic and socioeconomic rank at class and school level can be seen in appendix Figure A7.
3.2. Exploration of non-linearities
To allow for non-linear relationship between rank and the outcomes (Dadgar Citation2021; Denning, Murphy, and Weinhardt Citation2023), I re-estimated all models using rank ventiles instead of the continuous rank measure, where the lowest ranked students within their class-cohort are in ventile 1, and the highest ranked students in ventile 20. shows predicted probabilities for two outcomes (Higher education enrollment and higher education completion) by academic and socioeconomic rank percentiles estimated after the fully adjusted model (Model 3).Footnote10 It shows that the effect academic and socioeconomic rank have on the outcomes differs by the students’ relative position and outcome. There are some small differences in the probability of enrolling in higher education between students at the bottom of the academic and socioeconomic rank distribution. Whereas GPA rank becomes more relevant than socioeconomic rank for those in the middle-low part of the academic and socioeconomic class-rank distribution, there are no significant differences between the two types of rank for those in the middle-upper part of the distribution. Differences become statistically significant at the very upper part of the distribution.
Figure 5. Predicted probabilities for class-level academic and SES Rank ventiles, estimated after fully adjusted linear probability model. Note: 95% confidence intervals shown in error bars.
The story is somewhat different for the probability of completing higher education: For most of the distribution, there are no statistically significant differences between academic and socioeconomic rank. Differences are statistically significant only for the 5% most academically and socioeconomically advantaged in their classes, with them having a probability of 45.3% and 42.4% of completing higher education, respectively. Predicted probability figures for the rest of the outcomes can be found in appendix Figure A8.
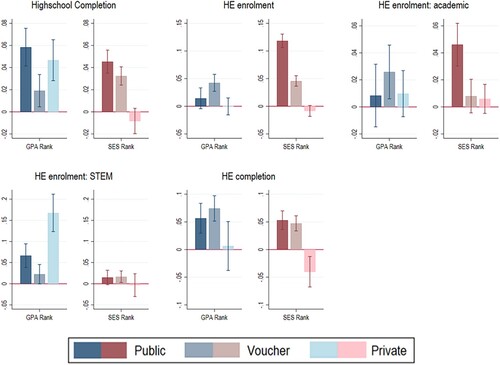
3.3. Heterogeneous effects
and show the coefficients for the effect of academic and socioeconomic rank on each of the outcomes, by gender and school type. Whilst the literature predicts boys may be more responsive to rank than girls because they are more competitive (Buser and Yuan Citation2019; Buser, Ranehill, and van Veldhuizen Citation2021) and/or more willing to compete (Niederle and Vesterlund Citation2007), estimations by gender () reveal differences between men and women in the effect of GPA rank on the outcomes tend to be non-statistically significant. The effect of GPA rank on the outcomes is always positive for both men and women.
Figure 6. Academic and SES Rank coefficients at class and school level after estimating the fully adjusted model, by sex. Note: 95% confidence intervals shown in error bars.
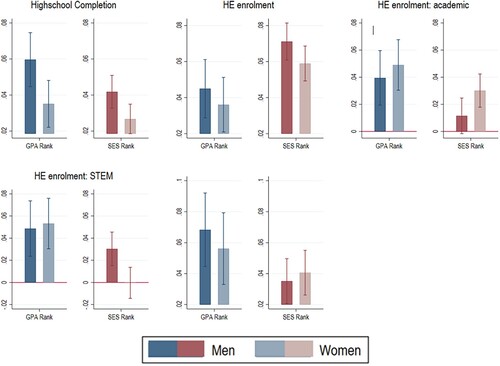
Figure 7. Academic and SES Rank coefficients at class and school level after estimating the fully adjusted model, by school type. Note: Note: 95% confidence intervals shown in error bars.
There are differences between men and women in the impact of socioeconomic rank on the probability of completing secondary education, and the probability of enrolling in STEM rather than non-STEM higher education, which suggests socioeconomic rank effects are bigger for men than for women. There are no statistically significant differences in socioeconomic rank coefficients between men and women in the other outcomes.
The lack of academic rank effect differences by gender could be related to a differential impact perception of rank by gender (Murphy and Weinhardt Citation2020) and is consistent with previous literature that reports no statistically significant differences by gender (Carneiro et al. Citation2024; Denning, Murphy, and Weinhardt Citation2023; Pagani, Comi, and Origo Citation2021; Payne and Smith Citation2020), and contradicts other findings according to which rank effects are larger for men than for women (Murphy and Weinhardt Citation2020; J. M. Delaney and Devereux Citation2021; Elsner, Isphording, and Zölitz Citation2021) or the other way round (Goulas, Griselda, and Megalokonomou Citation2022).
The estimation by school type () also provides interesting insights: First, there are statistically significant differences by school type in the effect of GPA rank for all the outcomes. The differences between school types suggest that academic rank effects on the probability of completing secondary education and enrolling in STEM degrees are larger for students from public schools than for those from voucher schools. The only outcome for which the effect of academic rank is larger for students from private schools than for students from public and voucher schools is for the probability of enrolling in STEM degrees.
There are also statistically significant differences among school types in the impact of socioeconomic rank on all outcomes but the probability of enrolling in STEM rather than non-STEM higher education. Differently to what happened with academic rank, differences among school type in SES rank always show that the effect of socioeconomic rank on the outcomes is stronger (and always positive) for students in public schools than for students in private schools. One possible explanation for this could relate to the fact that on average, students in public schools tend to be less socioeconomically advantaged than students in private schools and thus, being among the top of the class in socioeconomic terms in public schools does make a difference in terms of the student’s self-confidence or the resources, attention, and opportunities that the student gets.
3.4. Robustness checks
To test if specification errors are orthogonal to the rank measures, I re-estimate the models using different functional forms of absolute ability and SES index ( and appendix Table A10). shows that regardless of the functional form of the achievement adjustment the sign and statistical significance of the coefficient holds. Nonetheless, the magnitudes do vary. Whilst the coefficient for the effect of GPA rank on the probability of completing secondary education ranges between 6.4% and 22.8%, that of the probability of completing higher education ranges between 5.5% and 11.4%.
Table 4. Robustness checks: Academic and socioeconomic rank coefficients after adjustment for different functional forms of achievement in Model 3.
The effect of socioeconomic rank is also stable to the adjustments for different functional forms of the socioeconomic index for most outcomes (appendix Table A10). The adjustment for the socioeconomic index in its linear, cubic or quadratic form, or in deciles does not change the sign nor the statistical significance of the effect of socioeconomic rank on the probability of enrolling and completing higher education, as well as the probability of enrolling in STEM or academic higher education.
Finally, the effects of both socioeconomic and academic rank on the outcomes remain stable when estimating for the subsample with no missing values in either of the variables used to create the socioeconomic index (85% of the whole sample), or the subsample in which the percentage of students in the class with missing data in all these variables is below 20% (appendix Table A11).
4. Discussion
Using national administrative registers of 1,109,584 students, I have found that having a higher academic rank has a positive impact on five education progression outcomes. The estimates suggest that conditional on individual characteristics and class-cohort fixed-effects one decile increase in academic class rank leads to increases of around 0.4 percentage points in the probability of completing secondary education, enrolling in higher education and enrolling in academic rather than vocational higher education. The effect of rank on the probability of enrolling in a STEM subject and completing higher education is of 0.45 and 0.59 percentage points, respectively. The effects of one’s socioeconomic rank within their class are always positive, and except for the effect on higher education enrollment, the effects of socioeconomic rank are larger than those of academic rank.
When simultaneously adjusting for both academic and socioeconomic rank, both rank effects are positive and statistically significant, which suggest they measure different aspects of the impact of relative position and the outcomes.
My results are in line with theoretical accounts on peer effects and Big Fish Little Pond contrast effects, which stipulate students feel more positive about their own competencies in low-achieving than in high-achieving atmospheres. It could also be the case that this reflects schools allocating more resources to the most advantaged students within their class or parents and/or schools placing higher expectations on these children. The findings on socioeconomic rank are also related to those of relative deprivation, according to which the comparison to others could be harmful to the least advantaged ones, even after adjustment for absolute levels of socioeconomic status and academic achievement. Also, my findings are consistent with previous findings in this literature (Dadgar Citation2021; J. M. Delaney and Devereux Citation2021; Denning, Murphy, and Weinhardt Citation2023; Elsner and Isphording Citation2017; Murphy and Weinhardt Citation2020), not only in terms of its sign and statistical significance but also in terms of their magnitude (See appendix Table A12 for a summary).
The analysis by sex and school types revealed interesting insights: whilst there are no statistically significant differences in academic rank effects between men and women, there are socioeconomic rank effects, which tend to be larger for men than for women.
The comparison of school and class ranks showed that for some outcomes in GPA rank and most outcomes in SES rank, the effects of school-rank may be more important than that of class-rank. A possible explanation behind the larger effect of GPA school rank compared to class rank could be related to its use in some university admissions processes and the recognition given to top students in Chile. Some Chilean universities weigh a student's school ranking or relative performance among their graduating school cohort when making admissions decisions, so being among the top achievers of one’s schools may carry advantages to enter selective higher education institutions. Additionally, Chilean schools commonly publish ‘honour rolls’ to recognize their highest achieving students in each grade, which could amplify the salience and importance of a student's academic school rank compared to just their rank within an individual classroom. Also, the larger effects of SES school rank may suggest that certain characteristics (such as surname, skin color, and economic assets) are salient beyond the classroom.
One of the limitations of this research is that I am not able to explore the mechanisms through which the impact of both types of rank on the outcomes occur. Murphy and Weinhardt (Citation2020) explored competitiveness, parental investment, environmental favourability to ranks, student learning about their ability and development of non-cognitive skills as possible mechanisms and suggested the academic rank effect is driven by the development of non-cognitive skills.
These results have several implications. First, for parents, they suggest that when choosing a school, parents should think not only about the academic and socioeconomic characteristics of the children they want to be around their own, but also about the relative academic and socioeconomic position that their child will occupy within them. This could serve as an explanation for the lack of positive effects in interventions where children are allocated to better schools. Second, for schools, results suggest that information about their relative position within their class could be beneficial for students in the upper part of the distribution, but not for those in the bottom. This could explain the widening of achievement gaps between advantaged and disadvantaged groups over the education cycle (Hanushek, Kain, and Rivkin Citation2009; Murphy and Weinhardt Citation2020), and poses a challenge by suggesting that appropriate and timely accompaniment to those falling behind may prevent the widening of these gaps. Finally, these results can help to reconcile the mixed findings of policies that change the school/classroom composition. Rank effects can partly explain why the potential benefits of such policies may be attenuated through the reduction in confidence these students experience upon being placed in a higher-achieving or higher-socioeconomically advantaged peer group where they rank lower in any of these measures (Cullen, Jacob, and Levitt Citation2006; Murphy and Weinhardt Citation2020). Thus, policies aimed at re-grouping students need to consider the potential offsetting effects of rank.
Supplemental Material
Download MS Word (1 MB)Acknowledgements
The author thanks supervisors John Jerrim and Lindsey Macmillan for their continuous support. Also, to Samuel Sims, Asma Benhenda and Richard Murphy for valuable comments and suggestions.
Disclosure statement
No potential conflict of interest was reported by the author(s).
Data availability statement
This paper uses data from the Chilean Education Minister that can be accessed online at http://datos.mineduc.cl/ and https://informacionestadistica.agenciaeducacion.cl/.
Additional information
Funding
Notes
1 See J. Delaney and Devereux (Citation2022) for a complete revision of the literature.
2 The data can be accessed at: http://datos.mineduc.cl/ and https://informacionestadistica.agenciaeducacion.cl/
3 SIMCE stands for National System of Quality Measurement.
4 I used 10th grade SIMCE for years 2003, 2006, 2008, 2010 and 2012.
5 The subjects used to calculate GPA are the same for all schools, and include Language and literature, English, Mathematics, History and geography, Natural sciences, Art, Design and technology, and physical Education.
6 In Chile, 10th-grade class is fixed across subjects, meaning a student attends all subjects with the same group of classmates. Elective courses (and thus, different peers for different subjects) are part of the national curricula from the Ministry of Education for 11th and 12th grade only.
7 In case of ties, both students are assigned the lower rank.
8 Similarly, within-school SES variation represents around 46% of total SES variation.
9 Larger rank imbalances on these variables have been previously reported in the literature (Denning, Murphy, and Weinhardt Citation2023; Murphy and Weinhardt Citation2020).
10 Full result tables available upon request.
References
- Alivernini, Fabio, and Fabio Lucidi. 2011. “Relationship Between Social Context, Self-Efficacy, Motivation, Academic Achievement, and Intention to Drop out of High School: A Longitudinal Study.” The Journal of Educational Research 104 (4): 241–252. https://doi.org/10.1080/00220671003728062.
- Allen, Rebecca, and Sam Sims. 2018. “Do Pupils from Low-Income Families Get Low-Quality Teachers? Indirect Evidence from English Schools.” Oxford Review of Education 44 (4): 441–458. https://doi.org/10.1080/03054985.2017.1421152.
- Anderson, Cameron, Sanjay Srivastava, Jennifer S. Beer, Sandra E. Spataro, and Jennifer A. Chatman. 2006. “Knowing Your Place: Self-Perceptions of Status in Face-to-Face Groups.” Journal of Personality and Social Psychology 91 (6): 1094–1110. https://doi.org/10.1037/0022-3514.91.6.1094.
- Andrew, Megan, and Robert M. Hauser. 2011. “Adoption? Adaptation? Evaluating the Formation of Educational Expectations.” Social Forces 90 (2): 497–520. https://doi.org/10.1093/sf/sor005.
- Balsa, Ana I., Michael T. French, and Tracy L. Regan. 2014. “Relative Deprivation and Risky Behaviors.” Journal of Human Resources 49 (2): 446–471. https://doi.org/10.3368/jhr.49.2.446.
- Booij, Adam S, Edwin Leuven, and Hessel Oosterbeek. 2016. “Ability Peer Effects in University: Evidence from a Randomized Experiment.” The Review of Economic Studies 84 (2): 547–578. https://doi.org/10.1093/restud/rdw045.
- Bozick, Robert, Karl Alexander, Doris Entwisle, Susan Dauber, and Kerri Kerr. 2010. “Framing the Future: Revisiting the Place of Educational Expectations in Status Attainment.” Social Forces 88 (5): 2027–2052. https://doi.org/10.1353/sof.2010.0033.
- Brown-Iannuzzi, Jazmin L., Kristjen B. Lundberg, and Stephanie E. McKee. 2021. “Economic Inequality and Socioeconomic Ranking Inform Attitudes Toward Redistribution.” Journal of Experimental Social Psychology 96 (September): 104180. https://doi.org/10.1016/j.jesp.2021.104180.
- Buser, Thomas, Eva Ranehill, and Roel van Veldhuizen. 2021. “Gender Differences in Willingness to Compete: The Role of Public Observability.” Journal of Economic Psychology 83 (3): 102366. https://doi.org/10.1016/j.joep.2021.102366.
- Buser, Thomas, and Huaiping Yuan. 2019. “Do Women Give Up Competing More Easily? Evidence from the Lab and the Dutch Math Olympiad.” American Economic Journal: Applied Economics 11 (3): 225–252. https://doi.org/10.1257/app.20170160
- Calsamiglia, Caterina, and Annalisa Loviglio. 2019. “Grading on a Curve: When Having Good Peers Is Not Good.” Economics of Education Review 73 (12): 101916. https://doi.org/10.1016/j.econedurev.2019.101916.
- Carneiro, Pedro, Norbert Schady, Yyannu Cruz-Aguayo, and Francesca Salvati. 2024. “The Effect of Classroom Rank on Learning Throughout Elementary School: Experimental Evidence From Ecuador.” Journal of Labor Economics. https://doi.org/10.1086/727515
- Carrell, Scott E., Richard L. Fullerton, and James E. West. 2009. “Does Your Cohort Matter? Measuring Peer Effects in College Achievement.” Journal of Labor Economics 27 (3): 439–464. https://doi.org/10.1086/600143.
- Carrell, Scott E., Mark Hoekstra, and Elira Kuka. 2018. “The Long-Run Effects of Disruptive Peers.” American Economic Review 108 (11): 3377–3415. https://doi.org/10.1257/aer.20160763.
- Chiang, Yi-Lin, and L. Lareau. 2018. “Elite Education in China: Insights Into the Transition from High School to College.” In Elites in education, edited by A. van Zanten, 178–194. London: Routledge.
- Cicala, Steve, Roland G. Fryer, and Jörg L. Spenkuch. 2018. “Self-Selection and Comparative Advantage in Social Interactions.” Journal of the European Economic Association 16 (4): 983–1020. https://doi.org/10.1093/jeea/jvx031.
- Comi, Simona, Federica Origo, Laura Pagani, and Marco Tonello. 2020. “Last and Furious: Relative Position and School Violence.” Journal of Economic Behavior & Organization 188: 736–756. https://doi.org/10.2139/ssrn.3665114.
- Contreras, Dante, Paulina Sepúlveda, and Sebastián Bustos. 2010. “When Schools Are the Ones That Choose: The Effects of Screening in Chile*.” Social Science Quarterly 91 (5): 1349–1368. https://doi.org/10.1111/j.1540-6237.2010.00735.x.
- Cullen, Julie Berry, Brian A. Jacob, and Steven Levitt. 2006. “The Effect of School Choice on Participants: Evidence from Randomized Lotteries.” Econometrica 74 (5): 1191–1230. https://doi.org/10.1111/j.1468-0262.2006.00702.x.
- Dadgar, Iman. 2021. “The Effect of Ordinal Rank in School on Educational Achievement and Income in Sweden,” Working Paper. http://urn.kb.se/resolve?urn = urn:nbn:se:su:diva-202995.
- Delaney, Judith M., and Paul J. Devereux. 2021. “High School Rank in Math and English and the Gender Gap in STEM.” Labour Economics 69 (4): 101969. https://doi.org/10.1016/j.labeco.2021.101969.
- Delaney, Judith, and Paul J. Devereux. 2022. “Rank Effects in Education: What Do We Know So Far?” SSRN Scholarly Paper. CEPR Discussion Paper No. DP17090. https://ssrn.com/abstract = 4069898
- Denning, Jeffrey, Richard Murphy, and Felix Weinhardt. 2023. “Class Rank and Long-Run Outcomes.” Review of Economics and Statistics 105 (6): 1426–1441. https://doi.org/10.1162/rest_a_01125.
- Destin, Mesmin, Scott Richman, Fatima Varner, and Jelani Mandara. 2012. “‘Feeling’ Hierarchy: The Pathway from Subjective Social Status to Achievement★.” Journal of Adolescence 35 (6): 1571–1579. https://doi.org/10.1016/j.adolescence.2012.06.006.
- Eibner, Christine, and William N. Evans. 2005. “Relative Deprivation, Poor Health Habits, and Mortality.” Journal of Human Resources XL (3): 591–620. https://doi.org/10.3368/jhr.XL.3.591.
- Elacqua, Gregory, Mark Schneider, and Jack Buckley. 2006. “School Choice in Chile: Is It Class or the Classroom?” Journal of Policy Analysis and Management 25 (3): 577–601. https://doi.org/10.1002/pam.20192
- Elsner, Benjamin, and Ingo E. Isphording. 2017. “A Big Fish in a Small Pond: Ability Rank and Human Capital Investment.” Journal of Labor Economics 35 (3): 787–828. https://doi.org/10.1086/690714.
- Elsner, Benjamin, Ingo E Isphording, and Ulf Zölitz. 2021. “Achievement Rank Affects Performance and Major Choices in College.” The Economic Journal 131 (640): 3182–3206. https://doi.org/10.1093/ej/ueab034.
- Epple, Dennis, and Richard E. Romano. 1998. “Competition Between Private and Public Schools, Vouchers, and Peer-Group Effects.” American Economic Review 88 (1): 33–62. http://www.jstor.org/stable/116817
- Esposito, Lucio, and Adrián Villaseñor. 2019. “Relative Deprivation and School Enrolment. Evidence from Mexico.” Review of Income and Wealth 65 (1): 166–186. https://doi.org/10.1111/roiw.12344.
- Goulas, Sofoklis, Silvia Griselda, and Rigissa Megalokonomou. 2022. “Comparative Advantage and Gender Gap in STEM.” Journal of Human Resources 6, 320. https://doi.org/10.3368/jhr.0320-10781R2.
- Hanushek, Eric A., John F. Kain, and Steven G. Rivkin. 2009. “New Evidence About Brown v. Board of Education: The Complex Effects of School Racial Composition on Achievement.” Journal of Labor Economics 27 (3): 349–383. https://doi.org/10.1086/600386.
- Hsieh, Chang-Tai, and Miguel Urquiola. 2006. “The Effects of Generalized School Choice on Achievement and Stratification: Evidence from Chile’s Voucher Program.” Journal of Public Economics 90 (8-9): 1477–1503. https://doi.org/10.1016/j.jpubeco.2005.11.002.
- Jerrim, John, Luis Alejandro Lopez-Agudo, and Oscar David Marcenaro-Gutierrez. 2021. “Posh but Poor. The Association Between Relative Socio-Economic Status and Children’s Academic Performance.” Review of Income and Wealth 67 (2): 334–362. https://doi.org/10.1111/roiw.12476.
- Kraus, Michael W., Jacinth J. X. Tan, and Melanie B. Tannenbaum. 2013. “The Social Ladder: A Rank-Based Perspective on Social Class.” Psychological Inquiry 24 (2): 81–96. https://doi.org/10.1080/1047840X.2013.778803.
- Kremer, Michael, and Dan Levy. 2008. “Peer Effects and Alcohol Use Among College Students.” Journal of Economic Perspectives 22 (3): 189–206. https://doi.org/10.1257/jep.22.3.189.
- Lavy, Victor, Olmo Silva, and Felix Weinhardt. 2012. “The Good, the Bad, and the Average: Evidence on Ability Peer Effects in Schools.” Journal of Labor Economics 30 (2): 367–414. https://doi.org/10.1086/663592.
- Luttmer, Erzo F. P. 2004. “Neighbors as Negatives: Relative Earnings and Well-Being.” SSRN Scholarly Paper. Rochester, NY. https://doi.org/10.2139/ssrn.571824.
- Marsh, Herbert W. 1987. “The Big-Fish-Little-Pond Effect on Academic Self-Concept.” Journal of Educational Psychology 79 (3): 280. https://doi.org/10.1037/0022-0663.79.3.280.
- Marsh, Herbert W., and Alison O’Mara. 2008. “Reciprocal Effects Between Academic Self-Concept, Self-Esteem, Achievement, and Attainment Over Seven Adolescent Years: Unidimensional and Multidimensional Perspectives of Self-Concept.” Personality and Social Psychology Bulletin 34 (4): 542–552. https://doi.org/10.1177/0146167207312313.
- Marsh, Herbert W., Ulrich Trautwein, Oliver Lüdtke, Olaf Köller, and Jürgen Baumert. 2005. “Academic Self-Concept, Interest, Grades, and Standardized Test Scores: Reciprocal Effects Models of Causal Ordering.” Child Development 76 (2): 397–416. https://doi.org/10.1111/j.1467-8624.2005.00853.x.
- Murphy, Richard, and Felix Weinhardt. 2020. “Top of the Class: The Importance of Ordinal Rank.” The Review of Economic Studies 87 (6): 2777–2826. https://doi.org/10.1093/restud/rdaa020.
- Niederle, Muriel, and Lise Vesterlund. 2007. “Do Women Shy Away From Competition? Do Men Compete Too Much?*.” The Quarterly Journal of Economics 122 (3): 1067–1101. https://doi.org/10.1162/qjec.122.3.1067.
- Nieuwenhuis, Jaap, and Yi-Lin Chiang. 2021. “Oh, the Education (You Think) You’ll Have! Relative Deprivation and Students’ Academic Expectations, Aspirations, and Attainment.” British Journal of Sociology of Education 42 (7): 1037–1054. https://doi.org/10.1080/01425692.2021.1959300.
- Nuñez, Javier, and Roberto Gutierrez. 2004. “Classism, Discrimination and Meritocracy in the Labor Market: The Case of Chile.” Universidad de Chile. http://www2.facso.uchile.cl/sociologia/1060225/docs/chile/nunez.pdf
- OECD. 2016. “PISA Results (Volume I): Excellence and Equity in Education.”
- OECD. 2019. Education at a Glance, Chile. Paris: OECD. https://doi.org/10.1787/f277e17e-en
- Paffenholz, Michaela. 2022. “Essays in Applied Microeconomics.” Universität Mannheim. https://madoc.bib.uni-mannheim.de/62301/.
- Pagani, Laura, Simona Comi, and Federica Origo. 2021. “The Effect of School Rank on Personality Traits.” http://jhr.uwpress.org/content/56/4/1187.refs.
- Payne, A., and J. Smith. 2020. “Big Fish, Small Pond: The Effect of Rank at Entry on Postsecondary Outcomes.” Southern Economic Journal 86 (4): 1475–1509. https://doi.org/10.1002/soej.12420.
- Pop-Eleches, Cristian, and Miguel Urquiola. 2013. “Going to a Better School: Effects and Behavioral Responses.” American Economic Review 103 (4): 1289–1324. https://doi.org/10.1257/aer.103.4.1289.
- Roy, Amélie, Frédéric Guay, and Pierre Valois. 2015. “The Big-Fish–Little-Pond Effect on Academic Self-Concept: The Moderating Role of Differentiated Instruction and Individual Achievement.” Learning and Individual Differences 42 (8): 110–116. https://doi.org/10.1016/j.lindif.2015.07.009.
- Rubie-Davies, Christine M. 2006. “Teacher Expectations and Student Self-Perceptions: Exploring Relationships.” Psychology in the Schools 43 (5): 537–552. https://doi.org/10.1002/pits.20169.
- Sacerdote, Bruce. 2011. “Peer Effects in Education: How Might They Work, How Big Are They and How Much Do We Know Thus Far?” In Handbook of the Economics of Education, edited by Eric A. Hanushek, Stephen Machin, and Ludger Woessmann, vol. 3, 249–277. Elsevier. https://doi.org/10.1016/B978-0-444-53429-3.00004-1
- Sewell, William H., Archibald O. Haller, and Alejandro Portes. 1969. “The Educational and Early Occupational Attainment Process.” American Sociological Review 34 (1): 82–92. https://doi.org/10.2307/2092789.
- Stephens, Nicole M., Hazel Rose Markus, and L. Taylor Phillips. 2014. “Social Class Culture Cycles: How Three Gateway Contexts Shape Selves and Fuel Inequality.” Annual Review of Psychology 65 (1):611–634. https://doi.org/10.1146/annurev-psych-010213-115143.
- Stinebrickner, Todd, and Ralph Stinebrickner. 2012. “Learning About Academic Ability and the College Dropout Decision.” Journal of Labor Economics 30 (4): 707–748. https://doi.org/10.1086/666525.
- Thijs, Jochem, Maykel Verkuyten, and Petra Helmond. 2010. “A Further Examination of the Big-Fish–Little-Pond Effect.” Sociology of Education 83 (4): 333–345. https://doi.org/10.1177/0038040710383521.
- Tiedemann, Joachim. 2000. “Parents’ Gender Stereotypes and Teachers’ Beliefs as Predictors of Children’s Concept of Their Mathematical Ability in Elementary School.” Journal of Educational Psychology 92 (1): 144–151. https://doi.org/10.1037/0022-0663.92.1.144.
- Torres, Fernanda, Mauricio Salgado, Bernardo Mackenna, and Javier Núñez. 2019. “Who Differentiates by Skin Color? Status Attributions and Skin Pigmentation in Chile.” Frontiers in Psychology 10: 429096. https://doi.org/10.3389/fpsyg.2019.01516.
- Townsend, Tony. 2007. International Handbook of School Effectiveness and Improvement: Review, Reflection and Reframing. Springer Science & Business Media.
- Treviño, Ernesto. 2014. “Segregación Académica y Socioeconómica al Interior de La Escuela. Análisis de Su Magnitud, Evolución y Principales Factores Explicativos.” https://hdl.handle.net/20.500.12365/18535
- Treviño, Ernesto, Juan Pablo Valenzuela, and Cristóbal Villalobos. 2016. “Within-School Segregation in the Chilean School System: What Factors Explain It? How Efficient Is This Practice for Fostering Student Achievement and Equity?” Learning and Individual Differences 51 (10): 367–375. https://doi.org/10.1016/j.lindif.2016.08.021.
- Valenzuela, Juan Pablo, Cristian Bellei, and Danae de los Ríos. 2014. “Socioeconomic School Segregation in a Market-Oriented Educational System. The Case of Chile.” Journal of Education Policy 29 (2): 217–241. https://doi.org/10.1080/02680939.2013.806995.
- Verkuyten, Maykel. 2016. “The Integration Paradox: Empiric Evidence from the Netherlands.” American Behavioral Scientist 60 (5-6): 583–596. https://doi.org/10.1177/0002764216632838.
- Wentzel, Kathryn R., Ann Battle, Shannon L. Russell, and Lisa B. Looney. 2010. “Social Supports from Teachers and Peers as Predictors of Academic and Social Motivation.” Contemporary Educational Psychology 35 (3): 193–202. https://doi.org/10.1016/j.cedpsych.2010.03.002.
- Whitmore, Diane. 2005. “Resource and Peer Impacts on Girls’ Academic Achievement: Evidence from a Randomized Experiment.” American Economic Review 95 (2): 199–203. https://doi.org/10.1257/000282805774670158.
- Wilkinson, Richard G., and Kate E. Pickett. 2007. “The Problems of Relative Deprivation: Why Some Societies Do Better Than Others.” Social Science & Medicine 65 (9): 1965–1978. https://doi.org/10.1016/j.socscimed.2007.05.041.
- Yu, Han. 2020. “Am I the Big Fish? The Effect of Ordinal Rank on Student Academic Performance in Middle School.” Journal of Economic Behavior & Organization 176 (August): 18–41. https://doi.org/10.1016/j.jebo.2020.05.006.
- Zafar, Basit. 2011. “How Do College Students Form Expectations?” Journal of Labor Economics 29 (2): 301–348. https://doi.org/10.1086/658091.

