
ABSTRACT
In this study, we conducted sea urchin removal (SUR) experiments at two sites along Hokkaido’s southwestern and northwestern coasts in the Sea of Japan and one site along the northeast coast in the Sea of Okhotsk, to elucidate the biomass balance between macroalgae and sea urchins at different urchin barren sites. The experiments resulted in the restoration of macroalgal biomass at all sites and an increase in macroalgal diversity, indicating that it was the impact of high grazing pressure reducing the macroalgae, regardless of the particular experimental site. Notably, the recovery of the macroalgal biomass was characterized by increased kelp biomass, including Saccharina japonica var. religiosa and S. japonica var. ochotensis. In addition, negative correlations were observed between macroalgal biomass and sea urchin density. The lowest sea urchin density inducing an increase of macroalgal biomass was approximately the same in the reproductive growth phase (0.1 kg m−2) and in the vegetative growth phase (0.15 kg m−2) of Saccharina spp., the dominant kelps, regardless of the experimental site. These values can be helpful indicators for managing sea urchin density in order to restore macroalgae. In contrast, the maximum sea urchin density inducing the lowest macroalgal biomass varied markedly depending on the study site, indicating that different levels of kelp productivity are influenced by oceanographic conditions. Moreover, a strong positive correlation was observed between macroalgal biomass and sea urchins’ gonadosomatic index (GSI). Based on this correlation, macroalgal biomass supporting sea urchins with commercial value (GSI ≥ 15%) was estimated to be 1.6 kg m−2. This sea urchin density value is also a helpful indicator for managing macroalgal biomass and commercially valuable sea urchins. Moreover, this value will depend on the influence of the oceanographic environment of the site, particularly the nutrient conditions, on macroalgal productivity. In addition, we have also discussed how macroalgae and sea urchins can best coexist at the experimental sites.
Highlights
Sea urchin removal (SUR) restored macroalgal biomass and diversity.
Recovery of macroalgal biomass by SUR was characterized by kelps.
Kelp biomass required to support the commercial sea urchin production was estimated.
Introduction
The first description of the disappearance of macroalgal beds from the coast of Shizuoka prefecture (middle Japan) was in the 19th century by Yendo (Citation1911). The losses were primarily species of the Gelidiaceae and Lessoniaceae families, creating barren states (isoyake in Japanese). Since then, shifts from productive kelp beds to sea urchin barren states have been reported globally in temperate rocky coastlines (Breen & Mann, Citation1976a; Ayling, Citation1981; Chapman, Citation1981; Hagen, Citation1983; Harrold & Pearse, Citation1987; Watanabe & Harrold, Citation1991; Vasquez & Buschmann, Citation1997; Filbee-dexter & Scheibling, Citation2014; Ling et al., Citation2015). These shifts are characterized by the disappearance of a kelp-dominated community and its replacement by crustose coralline algae and sea urchins. In some areas, barren states have persisted for several decades. To date, barren states are driven by trophic cascades (Estes & Palmisano, Citation1974; Breen & Mann, Citation1976b), diseases (Pearse & Hines, Citation1979; Miller & Colodey, Citation1983), oceanic conditions (Dayton & Tegner, Citation1984), physical disturbances (Ebling et al., Citation1985; Dayton et al., Citation1992), heavy rain and considerable meandering of warm ocean currents (Taniguchi & Hasegawa, Citation1999). Overgrazing by herbivores is a critical cause of barren states in many coastal regions. In the northern regions of Japan, barrens primarily develop due to uncontrolled sea urchin grazing, whereas in the southern regions, they develop due to increased grazing by a variety of herbivores, including fish and sea urchins (Graham, Citation2010).
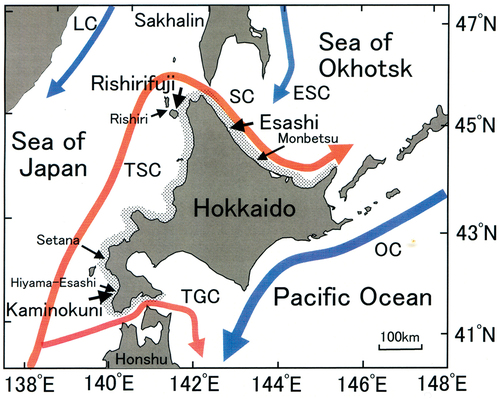
The sites in this study were located in the southwest (SW; Kaminokuni), northwest (NW; Rishirifuji) and northeast (NE; Esashi) of Hokkaido, Japan, which are all in the subarctic zone and cold climate regime. The two sites face the Sea of Japan, and the one additional site faces the Sea of Okhotsk (). Regarding oceanographic conditions, the Tsushima warm current (TSC) flows northwards along the coast of western Hokkaido facing the Sea of Japan. The current divides into two; the Tsugaru warm current (TGC), which flows through the Tsugaru Strait to the Pacific Ocean, and the Soya warm current (SC), which flows through the Soya Strait to the Sea of Okhotsk (). The northeastern side of Hokkaido, facing the Sea of Okhotsk, is affected by the southward East Sakhalin cold current (ESC). The eastern side of Hokkaido, facing the Pacific Ocean, is affected by the Oyashio cold current (Kurile current) (OC) year-round. Sea urchin barrens primarily occur on the coasts influenced by the Tsugaru warm current (TSC) and the Tsugaru warm current (TGC) (). Submerged landscapes in the barren area are usually recognized by the overall disappearance of macroalgal communities, especially canopy species such as Saccharina japonica var. religiosa, Undaria pinnatifida and members of the Sargassaceae family. Crustose coralline algae and sea urchins dominate the subtidal barren area. The primary persistent cause of this phenomenon is overgrazing by herbivorous invertebrates (Agatsuma, Citation1995). In addition, the disappearance of canopy-forming macroalgae was thought to be maintained by oligotrophic oceanic conditions and low productivity. However, barrens are not observed in eastern Hokkaido, which are greatly affected by cold currents with high nutrient concentrations and have large communities of S. angustata and S. longissima.
Fig. 1. Schematic diagram of ocean currents and study sites around Hokkaido, Japan. The red and blue arrows indicate warm and cold water currents, respectively. TSC, Tsushima warm current; TGC, Tsugaru warm current; SC, Soya warm current; OC, Oyashio cold current (Kurile current); LC, Liman cold current; ESC, East Sakhalin current. Sea urchin removal experiments were conducted in the southwestern (SW; Kaminokuni), northwestern (NW; Rishirifuji) and northeastern (NE; Esashi) coastal regions of Hokkaido. Oceanographic surveys were conducted at Kaminokuni, Hiyama-Esashi, Setana, Rishiri, Rishirifuji, and Monbetsu coastal regions. Shaded areas along the coastline indicate the occurrence of sea urchin barrens.
According to fishermen in southwestern Hokkaido, sea urchin barrens did not suddenly occur. Their progress became evident from around 1965 since their first identification there in the 1930s (Fujita, Citation1987). Therefore, barrens might have been present in southwestern Hokkaido for at least 90 years. The species of sea urchins Mesocentrotus nudus and Strongylocentrotus intermedius induce barrens in the southern and northern region, respectively. M. nudus is an omnivorous species with long spines, while S. intermedius is a brownish herbivorous species with short spines. Both species inhabit water shallower than 20 m, but the former is distributed at slightly deeper depths in association with crustose coralline algae (Akaike et al., Citation1999). M. nudus is distributed at shallower depths with kelp communities and those urchins over 10 mm in diameter graze macroalgae and consume sessile animals (Agatsuma, Citation2013a). S. intermedius of more than 10 mm in diameter prefers macroalgae, such as Saccharina spp. (Agatsuma, Citation2013b). Both species are known to graze drifting algae when sufficient algal biomass is available. However, under food scarcity, they often aggregate densely to form a grazing front and eradicate kelp beds, primarily composed of S. japonica and U. pinnatifida along the coast of the Sea of Japan, and S. angustata and S. longissima along the Pacific coast of Hokkaido. These kelp species have been considered to be essential food products traded with China since ancient times (Tazawa, Citation1990).
The shift to sea urchin barrens and their persistence affects the production of economically beneficial benthic organisms, such as important kelp species and sea urchins. In particular, sea urchin gonads are an expensive foodstuff. The disappearance of macroalgal biomass leads to food scarcity for sea urchins, causing economic losses in the fisheries industry. Understanding the potential for kelp beds to recover at sites where sea urchin barrens currently prevail is economically important. In Hokkaido, several trials have been conducted to restore kelp forests, including sea urchin removal (SUR). However, the recovery was not sustainable in almost all cases. Here, we review three SUR experiments, which were conducted in SW, NW and NE Hokkaido in Japan over the last three decades, to determine the effects of SUR on macroalgal biodiversity and biomass. We also investigated the environmental characteristics enabling the coexistence of macroalgae and sea urchins through experiments involving the manipulation of sea urchin density. Finally, we discuss the indicators that could be valuable for managing coastal macroalgal forests based on observed environmental characteristics.
Materials and methods
Oceanographic conditions
During this study, we used data obtained at three sites that were located near SUR sites and generally reflected the oceanographic conditions (). Water temperature was measured daily using a stick thermometer at the sea surface along Hokkaido’s southwestern, northwestern and northeastern coasts from 2001 to 2010. Data from the southwestern coast were obtained from SW (41°48′28′′N, 140°5′20′′E) from 2006–2010 and Hiyama-Esashi (41°52′10′′N, 140°7′25′′E) near SW from 2001–2005. Data from the northwestern and northeastern coasts were obtained from NW (45°14′32′′N, 141°13′45′′E) between 1991 and 1998 and NE (44°55′49′′N, 142°35′44′′E) between 1995 and 2000 (Hokkaido Aquaculture Promotion Corporation, Citation1992–2011). Temperature data were represented as mean values for every 10 day interval. Seawater samples were also collected from the sea surface from Setana (42°30′15′′N, 139°39′79′′E) in only even-numbered months between 1999 and 2006 (Hokkaido Fisheries Experimental Station, Citation1988‒2007), Rishiri (45°11′40′′N, 141°7′57′′E) between 1999 and 2006 and Monbetsu (44°20′9′′N, 143°22′44′′E) between 2007 and 2013 (Kasai et al., Citation2017) to investigate the nutrient environment. The water samples were stored at −20°C until analysis after filtration (Millipore, 0.45 µm). Inorganic nutrient (NO3-N, PO4-P) concentrations were analysed using an autoanalyser (BLTEC Corp., TRAACS 800).
Sea urchin removal experiment
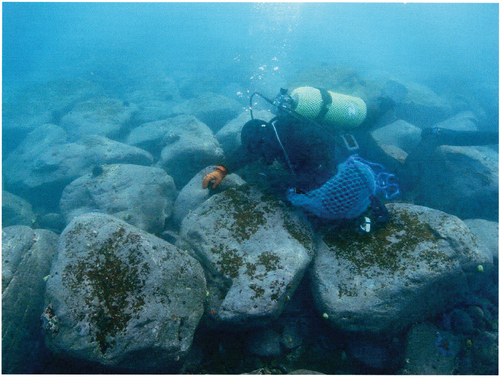
SUR experiments were conducted at subtidal rocky reefs in the three regions: SW (41°48′33′′N, 140°5′37′′E) from 2009 to 2013, NW (45°14′5′′N, 141°14′0′′E) from 1989–1992 and NE (44°57′6′′N, 142°35′0′′E) from 1989–1991 (). The SUR areas were 70 m × 80 m (1–3 m deep, bedrock) at SW, 50 m × 50 m (4 m deep, boulder <100 mm diameter) at NW and 70 m × 100 m (2–4 m deep, bedrock and thrown reef stone with a diameter of ~1 m) at NE. SUR manipulations were conducted by scuba divers primarily in autumn, but continued throughout the year (Supplementary table S1). The SUR experimental plot was encircled with a chain on the bottom. The SUR experimental plot was far from the control plot, by ca. 50 m in SW and NW and by ca. 80 m in NE. In addition, the site was marked by recording with Global Positioning System (GPS) and using a floating buoy. Sea urchins were collected by hand () and transferred to an area where they could not influence the experimental area. The removal of sea urchins was performed by 5–10 divers for 2–3 h per session, but sea urchins < 10 mm in diameter could not be removed as they hid deep within rock crevices. The number of sea urchins removed annually ranged from 2000–120 000 at SW, 15 000–120 000 at NW and 70 000–200 000 at NE. The ratios of M. nudus to S. intermedius were 99:1 at SW, 3:7 at NW and 0:100 at NE. The SUR plots did not have measures such as intrusion prevention fences, to prevent sea urchin’s invasion, so sea urchins could move freely into the SUR plots after SUR. This resulted in an increase in the density in SUR plots over time.
Fig. 2. A photograph of sea urchin removal performed by a diver in the southwestern (SW; Kaminokuni) coastal region of Hokkaido.
Quadrats (0.25 m2 or 1 m2) were positioned at 5–10 m intervals in the SUR and unmanipulated plots (controls) along the transect lines (50–100 m) perpendicular to the coastline to analyse the effects of SUR in the experimental regions. Both sea urchins and macroalgae were collected from the quadrats. Macroalgal biomass was expressed as the value per m2. However, crustose coralline red algae were not collected. The collected macroalgal samples were classified at the species level, and the wet weight of classified macroalgae species was measured. The collected sea urchins were taken onboard or onshore, and the number of sea urchins was counted. Selections of individual urchins were kept to measure their diameters, wet body weights and gonad weights.
During SUR conducted in NW and NE, the gonadal development of S. intermedius was investigated to determine the conditions necessary for the coexistence of commercially valuable macroalgae and sea urchin populations. The number of measured samples was 14–30 at NW and 10–188 at NE. Investigations were conducted in March and May of 1992, July, September and December of 1992 and April of 1993 at NW, as well as in May, July and September of 1989, May and July of 1990, May and July of 1991 and June and July of 1992 and July of 1993 at NE. The fresh weight of sea urchin gonads collected from SUR plots and unmanipulated control was measured after dissection. The gonadal development was evaluated using the gonadosomatic index (GSI) calculated as (gonad weight × 100)/body weight.
Statistical analysis
The sea urchin biomass and macroalgal biomass data were subjected to natural logarithmic transformation (ln[x + 1]) to reduce the skewness of the distribution, after which they were used for statistical comparisons among the sites and the SUR experiments using a two-way analysis of variance (ANOVA). Next, a post hoc comparison was conducted using Tukey’s honestly significant difference test. The difference in the development of sea urchin gonads (GSI values) between the control and SUR treatment groups at each sampling site was tested using one-way ANOVA and post hoc comparisons using Scheffé’s method. All statistical tests were conducted using STATA (16.0 for Windows, StataCorp LLC) and R (version 3.6.1).
Results
Oceanographic conditions
Fluctuations in mean surface seawater temperatures along the coast of the three regions of Hokkaido are illustrated in . Throughout the year, the seawater temperature in the SW was higher than that in the NW and NE. In the SW, the mean seawater temperature changed from a minimum of 5°C in mid-February to a maximum of 23°C in late August. In the NW region, the mean seawater temperature varied from a minimum of 3°C in early March to a maximum of 18°C in late August. The NE coastal region was covered with sea ice from January to mid-March, and seawater temperatures were below 0°C during these months. Subsequently, the seawater temperature rapidly increased after mid-March and was higher than that in the NW region in early May. It reached the annual maximum of 20°C in late August. After September, the mean seawater temperature dropped below the values for the NW region in late November.
Fig. 3. Monthly fluctuation in mean seawater temperatures of surface water for 10 days (mean ± standard error) in the coastal regions of southwest (SW, neighbouring Hiyama-Esashi 2001–2005; Kaminokuni 2001–2010, n = 8–10), northwest (NW; Rishirifuji 1991–1998, n = 8) and northeast (NE; Esashi 1995–2000, March–November n = 5, December n = 2). Seawater temperature data in NE from January to early mid-March were not measured because of the sea-ice berthing period.
The three study regions displayed similar fluctuations in nitrate and phosphate, with high levels during winter and low levels during summer. The mean nitrate concentration in the SW region (off Setana) reached an annual maximum of 5 µM in February, but the concentration was almost completely depleted from May to October and increased again from December (). In the NW region, the mean nitrate concentration reached an annual maximum of 3 µM in January. Compared with the levels in other regions, mean nitrate concentrations were higher in the NE region (Monbetsu) throughout the year, reaching an annual maximum of 10 µM in February. From June to October, detectable levels of nitrate (> 0.1 µM) were observed, and nitrate concentrations increased again from November. Mean phosphate concentrations exhibited a fluctuation similar to that of nitrate concentrations at all sites throughout the year (). The values varied from 0.1 to 0.4 µM in the Setana region, from 0.1 to 0.4 µM in the NW region and from 0.1 to 1.0 µM at the NE site. From May to November, the N/P ratio of seawater along the Monbetsu coast facing the Sea of Okhotsk (~3.99–10.03) was higher than that in Setana and the NW region, which face the Sea of Japan (~0.10–3.83). This indicated that nitrogen limitations were more severe on the coast of the Sea of Japan than on the coast of the Sea of Okhotsk during these periods.
Fig. 4. Monthly fluctuation in mean inorganic nutrient concentrations (NO3-N, upper; PO4-P, lower) of surface seawater (mean ± standard error) in the coastal regions of southwestern (SW; Setana 1999–2006, n = 4–8), northwestern (NW; Rishirifuji 1999–2006, n = 5–8) and northeastern sites (NE; Monbetsu 2007–2013, n = 7). ND, no data.
Sea urchin removal experiments
The SUR experiments substantially reduced the number of sea urchins in all regions. However, the effects of the SUR plot on the sea urchin biomass differed between experimental sites and years. In the SW region, the decrease in sea urchin biomass was only observed in May 2011 for a short period of time (). In contrast, SUR frequently resulted in a decrease in sea urchin biomass in NW and NE (). The effects were maintained for some months. In the NW region, SUR caused a decrease in sea urchin biomass from October 1989 to March 1991, but the effects of SUR were minimal from May 1991 to December 1992 (). Sea urchin biomass decreased in the NE region after SUR from May 1989 to July 1990. In contrast, macroalgal biomass could increase after SUR in the same site throughout the study period. The macroalgal biomass displayed marked increases (). Statistical analyses also indicated that the biomass of sea urchins and macroalgae was independently related to the sites and SUR manipulations (). Post hoc comparison indicated significant differences between the sites in the Sea of Japan (SW and NW) and the Sea of Okhotsk (NE, ).
Fig. 5. Effects of sea urchin removal (SUR) on the biomass of macroalgae and sea urchins (g wet weight m−2, mean ± standard error) in the southwestern site (SW, Kaminokuni) from September 2010 to May 2013 (SUR, n = 5–12; control, n = 4).
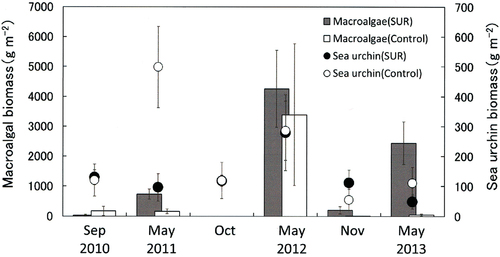
Fig. 6. Effects of sea urchin removal (SUR) on the biomass of macroalgae and sea urchins (g wet weight m−2, mean ± standard error) in the northwestern site (NW, Rishirifuji) of Hokkaido from September 1989 to September 1993 (SUR, n = 2–9; control, n = 3). ND, no data (September 1989).
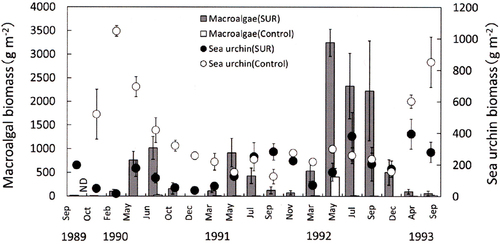
Fig. 7. Effects of sea urchin removal (SUR) on the biomass of macroalgae and sea urchins (g wet weight m−2, mean ± standard error) in the northeastern site (NE, Esashi) of Hokkaido from May 1989 to June 1992 (SUR, n = 3–17; control, n = 2–5). ND, no data (September 1989, April 1991, May 1991 and July 1991).
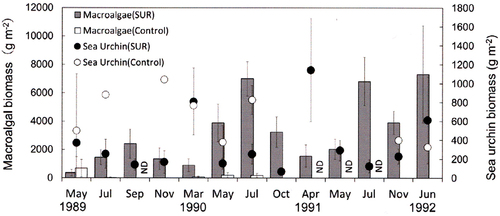
Table 1. Comparisons of seaweed biomass (g wet weight m−2 ± SE) among study sites (SW, Kaminokuni 2009–2013; NW, Rishirifuji 1989–1992; NE, Esashi 1989–1991) with and without sea urchin removals (SUR).
Table 2. (a) Analysis of variances of effects of SUR on sea urchin and macroalgal biomass and (b) Tukey’s post-hoc honestly significant difference (HSD) tests of site effects on sea urchin removal (SUR). SW, Kaminokuni; NW, Rishirifuji; NE, Esashi.
The number of algal species increased in SUR plots compared with control plots in all study regions (). The number of algal species found after SUR was highest in SW (n = 44), followed by NW (n = 38). The lowest number was observed in NE (n = 28). The Laminariales macroalgal species were the annual S. japonica var. religiosa, Costaria costata and U. pinnatifida in the SW region; biennial S. japonica var. ochotensis, annual C. costata and U. pinnatifida in the NW region; and perennial S. japonica var. ochotensis and annual C. costata in the NE region. The canopy-forming Fucales algae were the perennial Sargassum siliquastrum, S. confusum and S. miyabei in the SW region and S. confusum in the NW region. These Fucales algae were not observed in NE. These results indicate that the diversity of algal species was highest in the southern region of Hokkaido. Perennial kelps and canopy-forming species dominated in NW and NE. The biomass of S. japonica in SW and NW in the SUR plot was 318.3 and 378.6 g m−2, respectively. In particular, a considerable increase in the number of Laminariales algae in the SUR plot was observed in the NW region, and high biomass was noted (2644.1 g m−2) in the NE SUR region compared with the control level. Regarding Fucales algae, the biomass in SW and NW in the SUR plot was 11.2–38.9 and < 0.1 g m−2, respectively.
The early colonizing algal species in the SUR plot were opportunistic, such as Ulva pertusa, Monostroma nitidum, Polysiphonia morrowii and Cumathamnion serrulatum, followed by annual kelps, such as S. japonica var. religiosa and U. pinnatifida (). Macroalgal biomass increased over time in the SUR plot, and it was characterized by the regeneration of perennial kelp species. The perennial kelp S. japonica var. ochotensis was dominant in this region, regardless of SUR.
The effect of SUR on the development of the mean GSI of S. intermedius was significant in NW and NE sites (). Temporal changes in the mean GSI in the SUR and control plots in NW and NE are illustrated in , respectively. The GSI of S. intermedius in the SUR plot in NW was significantly higher than that in the control plot throughout the experimental period. However, the mean GSI of S. intermedius in the SUR plot in NE was significantly higher than that in the control plot from May 1989 to May 1991, but significant differences were not detected from June 1992 to July 1993. In contrast, the SUR experiments resulted in a positive correlation between the GSI of sea urchins and macroalgal biomass (). This relationship indicates that the macroalgal biomass gradually increased the GSI over 10% and then rapidly increased over 15%.
Table 3. Analysis of variances for difference in the development of sea urchin gonads (GSI values) between the control and sea urchin removal (SUR) treatment groups at Rhishirifuji (NW) and Esashi (NE).
Fig. 8. Effects of sea urchin removal (SUR) on gonad indices (mean ± SE) of Strongylocentrotus intermedius in the northwestern (NW, Rishirifuji) region from March 1992 to April 1993. Different letters indicate significant differences among months and treatments in a one-way ANOVA with a post hoc comparison using Scheffé’s method. The number of samples is indicated in parentheses. ND, no data.
Fig. 9. Effects of sea urchin removal (SUR) on gonadal indices (mean ± SE) of Strongylocentrotus intermedius in the northeastern (NE, Esashi) region from May 1989 to July 1993. Different letters indicate significant differences among months and treatments in a one-way ANOVA with a post hoc comparison using Scheffé’s method. The number of samples is indicated in parentheses. ND, no data.
Fig. 10. Relationship between macroalgal biomass and the gonadosomatic index (GSI) of sea urchin in the NE (Esashi) and NW (Rhishiri) regions.
All study sites displayed negative correlations between sea urchins and macroalgal biomass in the vegetative propagation and reproductive growth phases of Saccharina species that were dominant (, ). In the macroalgal vegetative growth phase, the observed highest density of sea urchins with the lowest macroalgal biomass was defined as F1 values, resulting in a negative effect on the macroalgal biomass in each site. F1 values varied among the experimental sites. Mean F1 values were 0.3 kg m−2 in SW, 0.4 kg m−2 in NW and 1.1 kg m−2 in NE. The F1 values were about 3.7 times higher in NE than in SW. In contrast, the observed lowest density of sea urchins with the highest macroalgal biomass (F2) during the reproductive growth phase indicated positive effect of the density on the macroalgal biomass in each site. Interestingly, F2 values were almost constant (~0.1 kg m−2) in the reproductive growth phase, regardless of the experimental site. However, the F2 values were ~1.5 times higher in the vegetative growth phase of kelp than in the reproductive phase (~0.15 kg m−2).
Fig. 11. Relationship between mean sea urchin and macroalgal biomass (mean ± SE) in sea urchin removal experiments. Open circles indicate autumn to winter (September–December) and closed circles indicate spring to summer (March–August). Each season corresponds to the dominant reproductive or vegetative growth season of kelps, which is expressed as bold regression curves. F1 and F2 indicate the highest density of sea urchins with the lowest macroalgal biomass and the lowest density of sea urchins with the highest macroalgal biomass, respectively. These values were determined by using the following equations fitted on the decrease (F1) or increase (F2) of algal biomass by sea urchin removal experiments: (a) Kamiinokuni (SW) F1 ≈ 0.3 kg, y = −4012ln(x) + 2333, r2 = 0.94, F2 ≈ 0.1 kg, y = −1014ln(x) + 5345, r2 = 0.98, (b) Rishirifuji (NW) F1 ≈ 0.4 kg, y = −2050ln(x) + 14 607, r2 = 0.56, F2 ≈ 0.1 kg, y = –427ln(x) + 2771, r2 = 0.61, (c) Esashi (NE) F1 ≈ 1.1 kg, y = −2566ln(x) + 19 995, r2 = 0.89, F2 ≈ 0.1 kg, y = −2123ln(x) + 14 494, r2 = 0.92.
Discussion
The SUR experiments in this study had different effects between the two growth phases, reproductive and vegetative, of Saccharina species at all sites. The restoration pattern of the experiments differed between the two seasons, reproductive (September–December) and vegetative (March–August), based on the seasonal growth of kelp. SUR during the reproductive season did not increase the macroalgal biomass as much as during the vegetative growth season. Grazing by sea urchins was also observed before and during the reproductive season of kelps. Therefore, SUR could contribute to maintaining the reproductive cycle of kelps.
Notably, the most effective sea urchin density (F2) resulting in the highest macroalgal production was ~100 g m−2, which did not vary among the experimental sites. This F2 value was similar to that reported by Ling et al. (Citation2019), who observed macroalgal recovery at less than 71 ± 20 g m−2. In contrast, the kelp bed recovered when sea urchin densities were reduced to less than 213 g m−2 biomass (Kriegisch et al., Citation2016). The difference in the density inducing the macroalgal biomass recovery depends on the size and species of sea urchins and their grazing activity in their habitat. Additionally, this threshold based on weight is a valuable indicator for restoring macroalgal beds and can be changed to the unit of individuals m−2. For example, regarding sea urchins with 25 g or 50 g fresh weight, in order for the kelp biomass restoration to be successful, the sea urchin must be reduced in density to less than 4 or 2 individuals per m2, respectively.
The observed mean values for the highest sea urchin density suppressing the macroalgal biomass (F1), 0.3 kg m−2 in SW to 1.1 kg m−2 in NE, indicate the sea urchin biomass that is acceptable at each site for sea urchin production. Therefore, in the NE, there is higher capacity for sea urchin biomass development. In addition, the variance depends on the primary productivity of macroalgae based on the coastal environment, with nutrient availability in particular being the main environmental factor. Macroalgal systems in nutrient-rich conditions were more resilient to grazing, shifting to barrens beyond more than twice the sea urchin biomass in nutrient-poor conditions (Boada, Citation2017). From this perspective, the higher F1 values in NE than in SW and NW would depend on ambient nutrient-rich conditions caused by the cold current. Therefore, the ‘bottom-up’ effects of nutrient supply could result in differences in the restoration of kelp beds among the sites. The nutrient environment also influences the diversity of algal communities. For example, nutrient enrichment increases the production of annual filamentous and thin seaweeds (Valiela et al., Citation1997), whereas thick perennial algae require more nutrients than annual seaweeds (Wallentinus, Citation1984). The removal of sea urchins increased the algal diversity in all study sites (). Moreover, some differences were observed between the SW and NE. In the SW region, the dominant algae were annual macroalgae, whereas the NE region exhibited a large amount of perennial brown macroalgae, particularly S. japonica var. ochotensis. Meanwhile, the NW region features intermediate features between those of SW and NE. These observations might be due to differences in productivity based on ‘bottom-up’ effects.
Species of Laminariales serve as major or climax canopy formers in coastal regions and have a wide variety of industrial uses. Differences were observed among the Laminariales species recovered in SUR experiments between the study regions with low (SW and NW) and high (NE) macroalgal community resilience phases (, ). The perennial alga S. japonica var. ochotensis recovered remarkably in the NE region, while the annual Laminariales U. pinnatifida appeared in the SW region after SUR. The recovery trajectory of macroalgal forests exposed to multiple stressors is determined by the interaction of ‘top-down’ and ‘bottom-up’ forces, indicating grazing pressure and nutrient inputs, respectively (Tamburello, Citation2019). In addition, the difference in thresholds of forward and reverse shifts is triggered by trophic and environmental changes, as reviewed by Ling et al. (Citation2019). The SW and NW regions are influenced by the Tsugaru warm current () and its branches with oligotrophic conditions, inducing low productivity. On the other hand, the Soya current influences the NE region from summer to autumn with oligotrophic conditions, but the East Sakhalin current and intermediate cold water are nutrient-rich from winter to spring (Takizawa, Citation1982; Kasai et al., Citation2017). Therefore, two resilience phases are influenced by variations in oceanographic conditions. The difference in macroalgal production and diversity, regardless of SUR manipulation, might be due to the oceanographic conditions of each study site.
The SUR experiments also drastically improved the gonadal development of sea urchins () with the recovery of macroalgae in all study sites along the coast of Hokkaido (). These results were due to the abundant food supply and oceanographic conditions affecting the feeding behaviour of sea urchins. The annual lowest mean seawater temperature in the SW and NW regions was 6°C and 3°C in February and March, respectively. In the NE region, temperatures dropped below freezing temperature, with sea ice forming in winter. The winter and early-spring months corresponded to the time of germination and the following growth stages of kelp under the suppression of herbivorous grazing activity. The grazing rates of S. japonica by the southern species M. nudus and the northern species S. intermedius were remarkably decreased at temperatures below 5°C and 0°C, respectively (Akaike, unpubl. data). This suggests that macroalgae in the SW are exposed to grazing by M. nudus throughout the year. In addition, the experimental regions were often exposed to strong wave action (water movement) during winter. Based on experiments using oscillatory flow tanks, the grazing activity of M. nudus was suppressed at water flow above 0.40 m s−1 and could not move at water flow above 0.70 m s−1 (Kawamata, Citation1998). Therefore, the differences in these ‘top-down’ effects among the study regions are crucial in influencing the growth of young kelps during kelp restoration.
Numerous studies were conducted on the factors controlling sea urchin grazing pressure in kelp bed ecosystems. Predators, such as sea otters (Estes & Palmisano, Citation1974) and spiny lobsters (Breen & Mann, Citation1976b), and mass mortality caused by diseases (Peares & Hines, Citation1979; Miller & Colodey, Citation1983; Scheibling, Citation1984; Scheibling & Lauzon-Guay, Citation2010; Feehan & Scheibling, Citation2014) have been well studied. In mainland Japan, M. nudus suffered mass mortality due to high water temperature (Tsuji et al., Citation1994), but this phenomenon has not been reported in the coastal waters of Hokkaido in northern Japan. The primary predators along the coastlines of Hokkaido are the sea stars Lysastrosoma anthostica and Asterina pectinifera and the rock crabs Pugettia quadridens, Hemigrapsus sanguineus and Gaetica depressus (Miyamoto et al., Citation1985; Agatsuma et al., Citation1995; Kawai & Agatsuma, Citation1996; Shiraishi, Citation1997). Sea urchins in the intertidal zones are predated by the seagulls Larus hyperboreus pallidissimus, L. glaucescens, L. argentatus vegae and L. schistiagus and the crows Corvus corone orientalis and C. macrorhynchos japonensis (Kawamura, Citation1993; Hori & Noda, Citation2007). In the past, the rare appearance of the sea otter Enhydra lutris has been reported in the eastern regions of Hokkaido (Hattori et al., Citation2005). However, no sites focused on the present study corresponded to the distribution of otter reported by Hattori et al. (Citation2005) and sea otter has not been witnessed at these sites to date. In addition, herbivorous fish do not affect the study sites because the latitudinal sites are outside the area influencing the macroalgal biomass (Ferreira et al., Citation2004). At present, it is considered that the macroalgal beds have disappeared because of the high grazing activity by the sea urchin S. nudus in southeast Hokkaido (Nabata et al., Citation1992), however, grazing by small herbivorous gastropods is evident (Nakata et al., Citation2006). Further investigation is needed in future for studying the inclusive effects caused by all herbivorous animals.
Sea urchins were the target organisms for removal in this study because they are harmful to kelps, but also important industrial trade products. Since the 1960s, sea urchin roe, with male and female gonads, has been considered as a luxurious foodstuff, often eaten with sushi in traditional Japanese cuisine. In 2012, the global production of sea urchins was ~63 000 mt, and Japan accounted for more than 80% of the demand (Sun & Chiang, Citation2015). Sea urchin production in Japan declined below 15 000 mt after the 1990s (Sun & Chiang, Citation2015), and ~50% of the total sea urchins were harvested from Hokkaido (Unuma et al., Citation2015). However, to preserve resources, the fishery adjustment rule of Hokkaido Prefectural Government prohibits the harvesting of substantial amounts of sea urchins with a diameter of less than 4 cm. In addition, sea urchin populations distributed offshore are transplanted to the upper subtidal kelp beds to enhance gonadal development and harvesting along the coasts. In the urchin barren regions, many sea urchins only grow to less than 4 cm in diameter and occur at high densities in kelp beds. This situation can cause the emergence of sea urchin barrens in Hokkaido, despite a substantial number of sea urchins being removed by fishing every year. However, in previous decades, coastal fishermen have often observed an abundance of kelps and sea urchins in the study region. The experiences of fishermen suggest that many sea urchins and kelps coexist at high density because the study regions previously featured a highly resilient algal community. Hereafter, it is important to optimize the sea urchin density to balance the productivity in each coastal region for sea urchin fisheries and the conservation of kelp beds.
In contrast, F1 and F2 values do not reflect the commercial value of sea urchins. It is thus necessary to estimate sea urchin density in order to determine the industrial sustainability of kelps and sea urchins. The GSI is often used as an indicator of the quality of commercial products of sea urchins. Although the reproductive cycle of sea urchins influences gonadal development, the GSI value was greatly influenced by macroalgal biomass. High GSI values were observed in the SUR plot, relative to those in the control plot, from June 1992 to July 1993 in NE, when the high GSI was supported by the beneficial supplementation of drift algae. In Japan, S. intermedius with GSI of more than 15% is commercially valuable (Machiguchi, Citation2012), whereas sea urchins with GSI of less than 10% are not commercially valuable. The GSI shows a positive relationship with macroalgal biomass (), and that a higher macroalgal biomass was observed when the GSI of sea urchins exceeded 15%. The macroalgal biomass supporting sea urchins with 10% and 15% GSI was estimated to be 539.2 and 1613 g m−2, respectively, using the correlative equation displayed in . Moreover, the sea urchin density with a commercial GSI level of sea urchin was estimated to be lower than 224 g m−2 in SW, 567 g m−2 in the NW and 1292 g m−2 in NE, using the equations displayed in . Therefore, the capacity of sea urchins acceptable for maintaining commercial standards is higher in the NE, where a high productivity of macroalgae was observed. Furthermore, the difference in sustainability ranges among the sites depends on the productivity of experimental sites.
In conclusion, the SUR experiments we conducted to elucidate the optimal balance of biomass between macroalgae and sea urchins in barren sites restored macroalgal biomass at all sites and increased macroalgal diversity. Notably, the recovery of macroalgal biomass was characterized by increased kelp biomass. Based on the negative correlation between macroalgal biomass and sea urchin density, the sea urchin density was set as ca. 0.1 kg m−2 in the reproductive growth phase and 0.15 kg m−2 in the vegetative growth phase of kelps, regardless of the experimental site, which provided an appropriate balance between sea urchin density and macroalgal biomass. The ability to support the maximum sea urchin density was greatly influenced by oceanographic conditions. Given the significantly positive relationship between macroalgal biomass and sea urchin GSI, the macroalgal biomass supporting sea urchins with commercial value (GSI ≥ 15%) was estimated to be 1.6 kg m−2. The above values are useful indicators of conditions under which commercially valuable macroalgae and sea urchins can successfully coexist.
Supplementary table S1. Sampling date, sites and number of quadrats (N) in each experimental plot. Macroalgae and sea urchins were collected from 0.25 m2 or 1 m2 quadrats, respectively. The sites are in the southwestern (SW, Kaminokuni), northwestern (NW, Rishirifuji), and northeastern (NE, Esashi) parts of Hokkaido.
Author contributions
S. Akaike: original concept, fieldwork, performed measurements and analysis and manuscript editing; H. Mizuta: original concept, drafting and manuscript editing.
Supplemental Material
Download MS Word (31.3 KB)Acknowledgements
We are very grateful to the Hiyama, Oshidomari, Kutsugata, and Esashi Fishermen’s Cooperative Association staff, the Kaminokuni and Rishirifuji town office staff, the Hiyama-nanbu, Rishiri, and Esashi Fisheries Technical Guidance Office, and the Hokkaido Prefectural Government. We are also grateful to the following colleagues of the Hokkaido Research Organization: K. Kikuchi, H. Monma, Y. Nozawa, S. Kiyokawa, Y. Kuwahara, T. Kuribayashi, H. Asami, H. Okumura and H. Yoshida. A part of the compilation work was supported by the ‘Regional University and Local Industrial Vitalization Grant Project’(Hakodate City) adopted by the Cabinet Office, Government of Japan in March 2022.
Disclosure statement
No potential conflict of interest was reported by the author(s).
Supplementary information
The following supplementary material is accessible via the Supplementary Content tab on the article’s online page at https://doi.org/10.1080/09670262.2024.2306397
Additional information
Funding
References
- Agatsuma, Y. (1995). Isoyake in southwestern coasts of Hokkaido. Hokusishidayori, 31:3–9. (in Japanese).
- Agatsuma, Y. (2013a). Chapter 29 Strongylocentrotus Nudus. In sea urchins: biology and ecology 3rd ed. (Lawrence, J. M. ed.), 449–460. Elsevier B. V, London.
- Agatsuma, Y. (2013b). Chapter 28 Strongylocetrotus Intermedius. In sea urchins: biology and ecology 3rd ed. (Lawrence, J. M. ed.), 437–447. Elsevier B. V, London.
- Agatsuma, Y., Sakai, Y. & Matsuda, T. (1995). Manual of transplantation of the Sea Urchin seeds Strongylocentrotus intermedius. Hokkaido Central Fisheries experimental Station. Nitto Press Co. Ltd., Otaru. (in Japanese).
- Akaike, S., Yoshida, H., Matuda, T., Yagi, H. & Tomiyama, M. (1999). Year-to-year variation of areas of macroalgal crustose coralline algal communities interpreted from aerial photographs and SCUBA along the western coast of Shakotan Peninsula, Hokkaido, Japan. Scientific Reports of Hokkaido Fisheries Experimental Station, 56:125–135. (in Japanese with English abstract).
- Ayling, A.M. (1981). The role of biological disturbance in temperate subtidal encrusting communities. Ecology, 62:830–847.
- Boada, J. (2017). Immanent conditions determine imminent collapse: nutrient regimes define the resilience of macroalgal communities. Proceeding of the Royal Society B, 284:20162814.
- Breen, P.A. & Mann, K.H. (1976a). Destructive grazing of kelp by sea urchins in eastern Canada. Journal of the Fisheries Research Board of Canada, 33:1278–1283.
- Breen, P.A. & Mann, K.H. (1976b). Changing lobster abundance and destruction of kelp beds by sea urchins.Marine Biology, 34:137–142.
- Chapman, A.R.O. (1981). Stability of sea urchin dominated barren grounds following destructive grazing of kelp in St. Margarets Bay, eastern Canada. Marine Biology, 62:307–311.
- Dayton, P.K. & Tegner, M.J. (1984). Catastrophic storms, El Nino, and patch stability in a southern California kelp community. Science, 224:283–285.
- Dayton, P.K., Tegner, M.J., Parnell, P.E. & Edwards, P.B. (1992). Temporal and spatial patterns of disturbance and recovery in a kelp forest community. Ecological Monographs, 62:421–445.
- Ebling, A.W., Laur, D.R. & Rowley, R.J. (1985). Severe storm disturbance and reversal of community structure in southern California kelp forest. Marine Biology, 84:287–294.
- Estes, J.A. & Palmisano, J.F. (1974). Sea otters: their role in structuring nearshore communities. Science, 185:1058–1060.
- Feehan, C. & Scheibling, R.E. (2014). Disease as a control of sea urchin populations in Nova Scotian kelp beds. Marine Ecology Progress Series, 500:149–158.
- Ferreira, D.E.L., Floeter, S.R., Gasparini, J.L., Ferreira, B.P. & Joyeux, J.C. (2004). Trophic structure patterns of Brazilian reef fishes: a longitudinal comparison. Journal of Biogeography, 31:1093–1106.
- Filbee-dexter, K. & Scheibling, R.E. (2014). Sea urchin barrens as alternative stable states of collapsed kelp ecosystems. Marine Ecology Progress Series, 495:1–25.
- Fujita, D. (1987). The report of an interview with fishermen on Isoyake in Taisei-cho, Hokkaido. Aquaculture Science, 35:135–138. (in Japanese).
- Graham, M.H. (2010). Comparison between East-Asian isoyake and deforestation in global kelp systems. Bulletin of Fisheries Research Agency, 32:47–50.
- Hagen, N.T. (1983). Destructive grazing of kelp beds by sea urchins in Vestfjorden, Northern Norway. Sarsia, 68:177–190.
- Harrold, C. & Pearse, J. (1987). The ecological role of Echinoderms in Kelp forests. In Echinoderm studies 2: the ecological role of Echinoderms in Kelp forests (Jangoux, M. & Lawrence, J.M., eds.), 137–233. A.A. Balkema, Rotterdam.
- Hattori, K., Kawabe, I., Mizuno, A.W. & Ohtaishi, N. (2005). History and status of sea otters, Enhydra lutris along the coast of Hokkaido, Japan. Mammal Study, 30:41–51.
- Hokkaido Aquaculture Promotion Corporation. (1992-2011). Bulletin of oceanographic condition in aquaculture fishing grounds, 21–40. (In Japanese).
- Hokkaido Fisheries Experimental Station. (1988–2007). Data record of oceanographic observations, 1–15. Hokkaido Research Organization, Sapporo. (in Japanese).
- Hori, M. & Noda, T. (2007). Avian predation of wild and cultured sea urchin Strongylocentrotus intermedius in a rocky shore habitat. Fisheries Science, 73:303–313.
- Kasai, H., Nagata, R., Murai, K., Katakura, S., Tateyama, K. & Hamaoka, S. (2017). Seasonal changes in oceanographic environments and the influence of interannual variation in the timing of sea-ice retreat on chlorophyll a concentration in the coastal water of northeastern Hokkaido along the Okhotsk Sea. Bulletin on Coastal Oceanography, 54:181–192. (in Japanese with English abstract).
- Kawai, T. & Agatsuma, Y. (1996). Predators on released seed of the sea urchin Strongylocentrotus intermedius in Shiribeshi, Hokkaido, Japan. Fisheries Science, 62:317–318.
- Kawamata, S. (1998). Effect of wave-induced oscillatory flow on grazing by a subtidal sea urchin Strongylocentrotus nudus (A.Agassiz). Journal of Experimental Marine Biology and Ecology, 224:31–48.
- Kawamura, K. (1993). Uni Zouyoushoku To Kakou, Ryutsu. Hokkai Suisan Company, Sapporo. (in Japanese).
- Kriegisch, N., Reeves, S., Jonson, C.R. & Ling, S.D. (2016). Phase-shift dynamics of sea urchin overgrazing on nutrified reefs. PLoS One, 11:e0168333.
- Ling, S.D., Kriegisch, N., Woolley, B. & Reeves, S.E. (2019). Density-dependent feedbacks, hysteresis, and demography of overgrazing sea urchins. Ecology, 100:e02577.
- Ling, S.D., Scheibling, R.E., Rassweiler, A., Johnason, C.R., Shears, N., Connell, S.D., Salomon, A.K., Norderhaug, K.M., Pérez-Matus, A., Hernández, J.C., Clemente, S., Blamey, L.K., Hereu, B., Ballesteros, E., Sala, E., Garrabou, J., Cebrian, E., Zabala, M., Fujita, D. & Johnson, L.E. (2015). Global regime shift dynamics of catastrophic sea urchin overgrazing. Philosophical Transactions of the Royal Society B, 370:20130269.
- Machiguchi, Y. (2012). Dietary value of marine algae for seedling production of the sea urchin Strongylocentrotus intermedius. PhD Thesis Abstract, Nagasaki University. Nagasaki. PhD Thesis Abstract.
- Miller, R.J. & Colodey, A.G. (1983). Widespread mass mortalities of the green sea urchin in Nova Scotia, Canada. Marine Biology, 73:263–267.
- Miyamoto, T., Ito, M. & Mizutori, Y. (1985). Experiments on the qualities for the seeds of the sea urchin (Strongylocentrotus intermedius) collected by the hanging plates in situ. Hokusuishi Geppo, 42:203–221. (In Japanese.).
- Nabata, S., Abe, E. & Kakiuchi, M. (1992). On the ‘Isoyake’ condition in Taisei-cho, southwestern Hokkaido. Scientific Reports of Hokkaido Fisheries Experimental Station, 38:1–14. (In Japanese with English abstract).
- Nakata, K., Yamazaki, T., Mizuta, H., Kawai, T., Ito, H. & Goshima, S. (2006). Feeding traces on the kelp Laminaria religiosa by four species of small herbivorous gastropods. Aquaculture Science, 54:217–224. (In Japanese with English abstract).
- Peares, J.S. & Hines, A.H. (1979). Expansion of central California kelp forest following the mass mortality of sea urchins. Marine Biology, 51:83–91.
- Scheibling, R.E. (1984). Echinoids, epizootics and ecological stability in the rocky subtidal off Nova Scotia, Canada. Helgoländer Meersunters, 37:233–242.
- Scheibling, R.E. & Lauzon-Guay, J.-S. (2010). Killer storms: North Atlantic hurricanes and disease outbreaks in sea urchins. Limnology and Oceanography, 55:2331–2338.
- Shiraishi, K. (1997). Effect of water temperature on the predation of the sea urchin, Strongylocentrotus nudus. Suisanzoshoku, 45:321–325. (In Japanese).
- Sun, J. & Chiang, F.-S. (2015). Chapter 2. use and exploitation of Sea Urchins. In Echinoderm Aquaculture (Brown, N.P. & Eddy, S.D., eds.), 25–44. John Wiley & Sons, Inc, Hoboken, New Jersey.
- Takizawa, T. (1982). Characteristics of the Soya warm current in the Okhotsk Sea. Journal of the Oceanographical Society of Japan, 38:281–292.
- Tamburello, L. (2019). Enhanced nutrient loading and herbivory do not depress the resilience of subtidal canopy forests in Mediterranean oligotrophic waters. Marine Environmental Research, 149:7–17.
- Taniguchi, K. & Hasegawa, M. (1999). Cyclic succession of marine algal communities in an infralittoral zone. In The ecological mechanism of “Isoyake” and marine afforestation (Taniguchi, K., ed.), 25–37. Koseisya kouseikaku, Tokyo. (In Japanese).
- Tazawa, T. (1990). History of Kelp Fishery in Hokkaido. Otaru. (In Japanese).
- Tsuji, S., Munekiyo, M., Itani, M. & Douke, A. (1994). A distributional change of sea urchin, Anthocidaris crassipina, after mass biolysis of another kind, Strongylocentrotus nudus. Bulletin of the Kyoto Institute of Oceanic and Fishery Science, 17:10–13. (In Japanese with English abstract).
- Unuma, T., Sakai, Y., Agatsuma, Y. & Kayaba, T. (2015). Chapter 5. Sea Urchin aquaculture in Japan. In Echinoderm Aquaculture (Brown, N.P. & Eddy, S.D., eds.), 77–126. John Wiley & Sons, Inc, Hoboken, New Jersey.
- Valiela, I., McClelland, J., Hauxwell, J., Behr, P.J., Hersh, D. & Foreman, K. (1997). Macroalgal blooms in shallow estuaries: controls and ecophysiological and ecosystem consequence. Limnology and Oceanography, 42:1105–1118.
- Vásquez, J.A. & Buschmann, A.H. (1997). Herbivore-kelp interactions in Chilean subtidal communities: a review. Revista Chilean De Historia Natural, 70:41–52.
- Wallentinus, I. (1984). Partitioning of nutrient uptake between annual and perennial seaweeds in a Baltic archipelago area. Hydrobiologia, 116-117:363–370.
- Watanabe, J.M. & Harrold, C. (1991). Destructive grazing by sea urchins Strongylocentrotus spp. in a central California kelp forest: potential roles of recruitment, death, and predation. Marine Ecology Progress Series, 71:125–141.
- Yendo, K. (1911). Kaisan-Syokubutsugaku. Hakubunkan, Tazawa, T. Tokyo. (In Japanese).