Abstract
A critical point in the V1 sector and entire V1VO complex is the interaction of stalk subunits G (Vma10p) and E (Vma4p). Previous work, using precipitation assays, has shown that both subunits form a complex. In this work, we have analysed the N-terminal segment of subunit G (G1–59) of the V1VO ATPase from Saccharomyces cerevisiae by using nuclear magnetic resonance (NMR) spectroscopy. Analyses of 1H-15N heteronuclear single quantum coherence (HSQC) spectra of G1–59 in the absence and presence of the N-terminal peptides E1–18 and E18–38 as well as the produced and purified C-terminal segment (E39–233) shows specific interactions only with the peptide fragment E18–38. The binding of this peptide occurs via the residues M1, V2, S3, and K5 as well for V22, S23, K24, A25 and R26 of G1–59. The specific E18–38/G1–59 binding has been confirmed by fluorescence correlation spectroscopy data. The E18–38 peptide has been studied by CD spectroscopy and NMR. The 3D structure of this peptide adopts a stable helix-hinge-helix formation in solution. A model structure of the E18–38/G1–59 complex reveals the orientation of E18–38 relative to G1–59 via salt-bridges of the polar residues and van der Waals forces at the very N-terminus of both segments.
| Abbreviations | ||
| CSI | = | chemical shift index |
| DSS | = | 2,2-Dimethyl-2-silapentane-5-sulfonate |
| DTT | = | dithiothreitol |
| EDC | = | 1-ethyl-3-(dimethylaminopropyl)-carbodiimide |
| FCS | = | fluorescence correlation spectroscopy |
| GST | = | glutathione-S-transferase |
| HSQC | = | heteronuclear single quantum coherence |
| HPLC | = | high pressure liquid chromatography |
| IPTG | = | isopropyl-β-D-thio-galactoside |
| NMR | = | nuclear magnetic resonance |
| NOESY | = | nuclear Overhauser effect spectroscopy |
| NTA | = | nitrilotriacetic acid |
| PAGE | = | polyacrylamide gel electrophoresis |
| PCR | = | polymerase chain reaction |
| SAXS | = | small angle X-ray scattering |
| SDS | = | sodium dodecyl sulfate |
| TFE | = | trifluorethanol |
| TOCSY | = | total correlation spectroscopy |
| Tris | = | Tris-(hydroxymethyl)aminomethane |
Introduction
The vacuolar H+-ATPase (V1VO ATPase) functions in almost every eukaryotic cell and energizes a wide variety of organelles and membranes Citation[1]. Besides this function the enzyme is also described to be responsible for sensing and/or measuring the intravesicular pH, and subsequently transmitting this information from the vesicle lumen to the cytosolic side of the membrane Citation[2]. The V1VO ATPase is composed of a water-soluble V1 ATPase and an integral membrane subcomplex, VO Citation[3–5]. Under certain physiological conditions both domains can undergo a reversible disassembly, a phenomenon unique for eukaryotic vacuolar H+-ATPases Citation[6–8]. The integral and proton transducting VO domain contains six different subunits in a stoichiometry of a1:d1:c4–5:c’1:c”1:e1. The energy, needed for proton translocation, is provided from the cleavage of adenosine triphosphate into adenosine diphosphate and inorganic phosphate, catalyzed in the A3:B3 hexamer of the V1 headpiece. The V1 sector is composed of eight subunits in a proposed stoichiometry of A3:B3:C1:D1:EX:F1:G2:HX Citation[3], Citation[4]. The A and B subunits are arranged hexagonally and alternate around a central cavity in which a seventh mass is located Citation[9–11]. A comparison of independently identified V1 structures reveals that a compact stalk protrudes from the bottom of the A3:B3 hexamer with a length of 11 nm Citation[9], Citation[11], Citation[12]. The stalk subunits undergo rearrangements when the V1 ATPase reassembles with the VO sector to form the entire V1VO complex as shown by crosslinking experiments, in which H-E, H-F crosslinks are observed in the V1 sector and C-E crosslink in the V1VO ATPase Citation[13], Citation[14], and electron microscopy images Citation[15]. In addition, the arrangement of the stalk subunits, which are involved in the coupling process of ATP-hydrolysis and proton pumping, is nucleotide dependent. While binding of CaATP to the V1 part results in the zero-length crosslink products E-F and E-G, a strong D-F formation is observed in the presence of CaADP Citation[16], Citation[17]. Since the assembled V1VO ATPase and the dissociated V1 sector as well as the coupling process are of physiological relevance, the topology of these stalk subunits are of great interest. Insight into the structural traits of stalk subunits came from the low resolution- Citation[18] and crystallographic structure of subunit C Citation[19], and H Citation[20]. Subunit C has an elongated boot-shaped feature Citation[18] with an upper head domain, a large globular foot and an elongated neck domain Citation[19]. Stalk subunit H is characterized by a large, primarily α-helical N-terminal domain, forming a shallow groove, and a C-terminal domain, both connected by a four-residue loop Citation[20]. In contrast, no structural details are known for the stalk subunits E and G, which have been proposed to be essential for the assembly of the V1VO ATPase Citation[21–23] and activity of the V1- Citation[21], Citation[24–27] as well as the V1VO ATPase Citation[22–24]. Subunit G of the V-ATPase from yeast has been shown to be elongated with about 8.0 nm in length Citation[28], and to interact with the N-terminus of subunit E Citation[29], Citation[30].
Here, we describe the spectoscopical studies of the N- and C-terminal part of G subunit, G1–59 and G61–114, respectively, of the V1VO ATPase from Saccharomyces cerevisiae in solution using nuclear magnetic resonance spectroscopy and fluorescence correlation spectroscopy. The 2D 1H-15N heteronuclear single quantum correlation (HSQC) spectra provided a unique opportunity to assign the amino acids involved in the E-G assembly.
Materials and methods
Materials
ProofStart™ DNA Polymerase and Ni2 + -NTA-chromatography resin were received from Qiagen (Hilden, Germany); restriction enzymes were purchased from Fermentas (St Leon-Rot, Germany). Chemicals for gel electrophoresis were received from Serva (Heidelberg, Germany). Bovine serum albumin was purchased from GERBU Biochemicals (Heidelberg, Germany). (15NH4)2SO4 and (13C) glucose were purchased from Cambridge Isotope Laboratories (Andover, USA). All other chemicals were at least of analytical grade and received from BIOMOL (Hamburg, Germany), Merck (Darmstadt, Germany), Roth (Karlsruhe, Germany), Sigma (Deisenhofen, Germany), or Serva (Heidelberg, Germany).
Expression and purification of proteins
The constructs of subunit E (E39–233), and G (G1–59, G61–114) were cloned from S. cerevisiae genome using PCR cloning method. PCR products incorporating NcoI and SacI restriction sites were digested and ligated to pET9d(+)-His3 vector. Forward Primer F1 5′ TCATGCCATGGTAGCTGACCAAGAGT 3′ and reverser primer R1 5′ CTTCGAGCTCTCAATCAAAGAACTTTCTTG 3′ were used to amplify and clone E39–233 (Vma4p39–233). G1–59 (Vma10p1–59) was cloned using forward primer F2 5′ TTTCCATGGCCTCCGCTATTACTG 3′ and reverser primer R2 5′ TTTGAGCTCTTAGCAGGCGATTCC 3′. G61–114 (Vma10p61–114) was cloned using forward primer F3 5′ATGGATAATGCCGGTGGTGTTG3′ and reverse primer R3 5′ CGTTCGAGCTCTTAGCACAAGGCATTGATATG 3′.
To express the respective proteins, liquid cultures were shaken in LB medium containing kanamycin (30 µg ml-1) for about 6 h at 37°C until an optical density OD600 of 0.6–0.7 was reached. The uniformly 15N- and 15N/13C-labeled G1–59 and G61–114 were expressed in Escherichia coli BL21 (DE3) cells using M9 minimal media containing 15NH4Cl, or 15NH4Cl plus [U-13C]-glucose. To induce production of proteins, cultures were supplemented with isopropyl-β-D-thio-galactoside (IPTG) to a final concentration of 1 mM. Following incubation for another 4 h at 30°C, the cells were harvested at 8000 g for 15 min at 4°C. Subsequently, all cells were lysed on ice by sonication for 3×1 min at 50% power in appropriate buffer, G1–59 in buffer A (50 mM HEPES, pH 7.0, 150 mM NaCl, 1 mM DTT 1 mM PMSF), G61–114 in buffer B (50 mM HEPES, pH 7.5, 150 mM NaCl, 1 mM DTT, 1 mM PMSF), and E39–233 in buffer C (50 mM Tris/HCl, pH 8.5, 200 mM NaCl, 4 mM PefablocSC (BIOMOL) and 2 mM PMSF). The lysate was cleared by centrifugation at 10,000 g for 30 min at 4°C, the supernatant was passed through a filter (0.45 µm pore-size) and supplemented with Ni2 + -NTA resin. The His-tagged protein was allowed to bind to the matrix for 2 h at 4°C by mixing on a sample rotator (Neolab), and eluted with an imidazole-gradient (25–250 mM) in buffer A, B and C, respectively. Fractions containing His-tagged proteins were identified by SDS-PAGE1 (31), pooled and concentrated using Centriprep YM-3 or YM-5 (5 kDa molecular mass [MM] cut-off) spin concentrators (Millipore) and subsequently applied on a gel filtration column Superdex HR75 (10/30, Amersham Biosciences). Selected fractions were concentrated in 3 kDa cut-off centricon. The purity of the protein sample was analysed by SDS-PAGE Citation[31]. The SDS-gels were stained with Coomassie Brilliant Blue R250. Protein concentrations were determined by the bicinchoninic acid assay (BCA; Pierce, Rockford, IL, USA).
Peptide synthesis
The peptides E1–18 and E18–38 were synthesized at the peptide core facility, School of Biological Sciences, NTU on Liberty Automatic Microwave Peptide Synthesizer (CEM, USA) using N-(9-fluorenyl) methoxycarbonyl (Fmoc) chemistry on a Rink amide MBHA resin (Novabiochem, Germany). The C-terminal amidinated peptides were purified by reverse phase high pressure liquid chromatography (HPLC) on a Dynamax C-18 column (Varian Inc., USA) eluted with a linear 5–100% gradient of acetonitrile in 0.04% aqueous trifluoroacetic acid. The identity of the purified peptide was confirmed by MALDI-TOF mass spectrometry (4800 MALDI TOF/TOF, AB Applied Biosystems MDS Sciex, USA). The final product was judged to be 99% pure based on analytical high pressure liquid chromatography.
Circular dichroism spectroscopy
Steady state CD spectra were measured in the far UV-light (185–260 nm) using a CHIRASCAN spectropolarimeter (Applied Photophysics, UK). Spectra were collected in a 60 µl quartz cell (Hellma, Germany) with a path length of 0.1 mm, at 20°C and a step resolution of 1 nm. The readings were the average of 2 sec at each wavelength and the recorded ellipticity values were the average of three determinations for each sample. CD spectroscopy of the E39–233 (2.0 mg/ml), E1–18 and E18–38 was performed in a buffer of 25 mM Tris/HCl, pH 8.5, 200 mM NaCl, 1 mM DTT for E39–233 and 50 mM phosphate buffer (pH 6.8) and 30% trifluorethanol (TFE) for E1–18 and E18–38. The spectrum for the buffer was subtracted from the spectrum of the protein/peptide. CD values were converted to mean residue ellipticity (κ) in units of degree cm2 dmol–1 using the software Chirascan Version 1.2, Applied Photophysics. This baseline corrected spectrum was used as input for computer methods to obtain predictions of secondary structure. The CD spectra were analysed as described recently Citation[32].
NMR data collection and processing
The NMR sample, G1–59 and G61–114 was prepared in 90% H2O/10% D2O containing 25 mM NaH2PO4 (pH 6.8), 0.1% NaN3 and 50 mM Tris/HCl (pH 7.5) 200 mM NaCl, respectively. All NMR experiments were performed at 288 K on a Bruker Avance 600 MHz spectrometer. The experiments recorded on 15N/13C-labelled sample were HNCO, HNCACO, CBCA(CO)NH, HNCACB and 3D 15N-NOESY-HSQC (τm = 200 ms). The 3D 15N-NOESY-HSQC used mixing time of 200 ms. All the two- and three-dimensional experiments made use of pulsed-field gradients for coherence selection and artifact suppression, and utilized gradient sensitivity enhancement schemes. Quadrature detection in the indirectly detected dimensions was achieved using either the States/TPPI (time-proportional phase incrementation) or the echo/anti-echo method. Baseline corrections were applied wherever necessary. The proton chemical shift was referenced to the methyl signal of DSS (2, 2-dimethyl-2-silapentane-5-sulphonate [Cambridge Isotope Laboratories]) as an external reference to 0 ppm. The 13C and 15N chemical shifts were referenced indirectly to DSS. All the NMR data were processed using Bruker Avance spectrometer in-built software Topspin. Peak-picking and data analysis of the Fourier transformed spectra were performed with the SPARKY program Citation[33].
Peptide E18–38 was prepared by dissolving appropriate amount in 50 mM phosphate buffer pH 6.8 and 30% TFE-d3. The one dimensional (1D) and two dimensional (2D) 1H NMR spectra including total correlation spectroscopy (TOCSY) and nuclear overhauser enhancement spectroscopy (NOESY) were obtained at the temperature of 288 K on a Avance Bruker NMR spectrometer at 600 MHz proton frequency. TOCSY and NOESY spectra of the peptide were recorded with mixing times of 80 and 300 ms, respectively. All the NMR data were processed using Bruker Avance spectrometer in-built software Topspin. Peak-picking and data analysis of the Fourier-transformed spectra were performed with SPARKY program Citation[33]. Assignments were carried out according to classical procedures including spin-system identification and sequential assignment Citation[34].
Structure calculation
Three-dimensional structures of peptide E18–38 was calculated based on both distance and angle restraints by using CYANA 2.1 program package Citation[35]. Dihedral angle restraints were calculated from chemical shifts using torsion angle likelihood obtained from shift and sequence similarity (TALOS) Citation[34]. In total 100 structures were calculated. An ensemble of five structures with lowest total energy was chosen for structural analysis. This final ensemble of accepted structures satisfies the following criteria: no NOE violations greater than 0.3 Å, rmsd of 0.825±0.29 Å.
NMR binding experiments
To analyze the binding between subunits G1–59-E1–18, G1-59-E18–38, G1-59-E39–233 and G61-114-E39–233 a series of 1H-15N heteronuclear single quantum coherence (HSQC) spectra were recorded at 288 K for the fixed concentration of 100 µM of G1–59, titrated with increasing amounts (up to 1.5 equivalents) of E1–18, E18–38 and E39–233 separately or with 100 µM of G61–114 mixed with increasing amounts of E39–233. The proteins were incubated for 30 min for binding during each step of the experiment. The change of chemical shift was monitored in the HSQC spectra. All the samples used were either finally dissolved in or exchanged with the 25 mM sodium phosphate (pH 6.8) buffer prior to the binding experiments.
Fluorescence correlation spectroscopy
Fluorescence correlation spectroscopy (FCS) was performed on a LSM-FCS system (ConfoCor 3, Zeiss, Jena/Germany) by using an Atto655-NHS ester (ATTO-TEC, Siegen/Germany) to label the E18–38 peptide. The labeling and FCS experiments were performed in 25 mM sodium phosphate buffer, pH 6.8 for 10 min at room temperature. The excess of the unbound dye was removed by using a ZipTip® P-10 Pipette Tip with C4 resin (Millipore, USA) for seven times replacing the solution with 5% acetonitrile/water, 0.1% trifluoroacetic acid which was verified by FCS. The fluorescent labeled peptide was subsequently eluted by 60% acetonitrile/water, 0.1% trifluoroacetic acid.
The 633 nm laser line of 5 mW HeNe laser was focused into the aqueous solution by a water immersion objective (40×/1,2 W Korr UL-VIS-IR, Zeiss). FCS was measured in 15 µl droplets, which were placed on gelatin treated Nunc 8 well chambered cover glass according to Citation[36]. The following filter sets were used: MBS: HFT 514/633, EF: None, DBS: None, EF2: BP 655–710 IR. Out-of-focus fluorescence was rejected by a 90 µm pinhole in the detection pathway, resulting in a confocal detection volume dimensions of L: 1.5 µm and ∅: 0.3 µm. Fluorescence autocorrelation functions were measured for 30 sec each with 12 repetitions. Solutions of Atto655 dye in buffer were used as references for the calibration of the ConfoCor 3 beam path. To analyze the autocorrelation functions of E18–38 bound to subunit G1–59, a standard autocorrelation two diffusion coefficients normalized triplet model (FCS-LSM software, ConfoCor 3, Zeiss) was used for fitting. The diffusion time of fluorescently labeled peptide E18–38 was measured independently, and kept fixed during the fitting of the FCS data. Therefore, the determination of the binding constants were made by the calculation of the relative amount of free labeled E18–38 that displays a shorter diffusion time in comparison with G1–59 bound to E18–38 with rising diffusion times. The calculations were done by the ConfoCor 3-software 4.2, Microsoft Excel 2003, and Origin 7.5.
Modeling of the interacting domain of E18–38 with G1–59
Molecular modeling was performed using a HP-Linux workstation. The three-dimensional model of subunit G1–59 was constructed based on the secondary structural information obtained from NMR data, using the programs Swiss-PdbViewer 3.7 Citation[37] and COOT Citation[38]. The model was optimized by carrying out energy minimization in vacuo with the GROMOS96 43B1 parameter set, without reaction field, implemented in Swiss-PdbViewer program. Initially 200 steps of Steepest Descent followed by multiple steps of Conjugate Gradient protocols were adopted until the derivative convergences to 0.050 kJ/mol. This model was then docked with the average NMR structure of E18–38 using the web interface of the protein docking software, GRAMM Citation[39] that uses Fast Fourier Transform methodology for the global search of the best rigid body conformations. The top 100 complex conformations which were scored based on soft Lennard-Jones potential, evolutionary conservation of predicted interface, statistical residue-residue preference, volume of the minimum, empirical binding free energy and atomic contact energy were analyzed and the one that best satisfies the NMR HSQC titration study was chosen. The best docking model was chosen in such a way that the model should have almost all residues that show shift in NMR HSQC spectrum, and has some kind of interaction in the complex. The subunits G1–59, E18–38 and the docked complex where optimized as described above and the docking energy was calculated to be −309.73 kJ/mol using the formula,
Docking energy = Energy of the G1–59 E18–38 Complex − (Energy of the subunit G1–59+Energy of the subunit E18–38); where the final minimized energy of the G1–59 E18–38 Complex, subunit G1–59 model and the subunit E18–38 are −4462.21, −3034.05 and −1118.44 kJ/mol, respectively.
Results
Resonance assignments of G1–59 of yeast V-ATPase
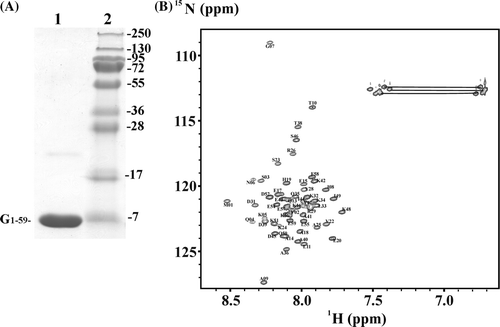
From mutational analysis it is proposed that subunit G (Vma10p) of the yeast V-ATPase might interact via its N-terminal segment to subunit E (Vma4p) Citation[23]. To get further inside into this phenomenon and the question about the amino acids involved in the proposed binding segments, NMR studies have been performed with the N-terminal segment G1–59, which has been produced in E. coli cells and purified to high quality and quantity (A). A 2D 1H-15N heteronuclear single quantum coherence (HSQC) spectrum (B) shows that the protein is properly folded. Besides the residues L11, I21, K27 and K53 all residues of G1–59 could be assigned by backbone 15N and 13C signals using 15N NOESY-HSQC as well as triple resonance backbone experiments (HNCACB, CBCA(CO)NH).
Figure 1. (A) SDS-gel of the purified G1–59 (lane 1) and a protein ladder (lane 2) with molecular weights as indicated. (B) 2D 1H-15N-HSQC spectrum of G1–59 in 25 mM sodium phosphate buffer (pH 6.5) at 288 K. Backbone and amide assignments (N and Q) are shown for each residue. Signals from side-chain NH2 groups are connected by horizontal lines.
NMR-titration of G1–59 with E1–18, E18–38 and E39–233 as well as G61–114 with E39–233
Recently, an N-terminal truncated and GST-fused form of subunit E (E39–233) from the yeast V-ATPase shows no interaction with subunit G Citation[29]. Here, we produced and purified the truncated protein E39–233, encoding the amino acids 39–233 of subunit E. The CD-spectrum of E39–233 shows a protein with a content of 41% of α-helix and 23% of β-sheet structure (data not shown). This protein was used in NMR titration experiments using 1H-15N HSQC spectra to study possible interactions between subunit G1–59 and the N-terminal truncated segment of E39–233. HSQC spectra of 15N labeled G1–59 were recorded in the presence of increasing amounts of unlabeled E39–233. As demonstrated in Supplementary A (online version only) no obvious chemical shift of the residues of G1–59 (shown in red) could be detected in the presence E39–233 (shown in blue), indicating that no interaction of both segments occurs. This was similar, when E39–233 was added to the C-terminal and 15N labeled domain of G61–114 (Supplementary B; online version only). Furthermore, no chemical shift could be detected, when the N-terminal peptide E1–18, with the amino acid sequence 1MSSAITALTPNQVNDELN18, has been titrated in increasing amounts to G1–59 (see Supplementary C; online version only). On the contrary, when equimolar amounts of the peptide E18–38 (18NKMQAFIRKEAEEKAKEIQLK38) of subunit E was added to G1–59 significant chemical shift perturbations could be observed. A shows superpositions of the HSQC spectra of the 15N-labeled G1–59 (shown in red) and the G1–59-E18–38 complex (shown in green), recorded in the presence or absence of E18–38. The HSQC spectra of the 15N-labeled G1–59 in absence and presence of E18–38 yield noticeable differences in terms of changes in chemical shift specifically for residues M1, V2, S3, and K5 as well for V22, S23, K24, A25 and R26 (B).
Figure 2. (A) Sections from the overlaid 2D 1H-15N-HSQC spectra of G1–59 in the absence (red) and presence (green) of 1.5 equivalent of unlabeled E18–39. (B) Combined amide (1H) and nitrogen (15N) chemical shift changes ([(Δ1HN)2+(Δ15Nppm/6.51)2]0.5) for G1–59 and E18–38 binding as a function of the amino acid sequence.
![Figure 2. (A) Sections from the overlaid 2D 1H-15N-HSQC spectra of G1–59 in the absence (red) and presence (green) of 1.5 equivalent of unlabeled E18–39. (B) Combined amide (1H) and nitrogen (15N) chemical shift changes ([(Δ1HN)2+(Δ15Nppm/6.51)2]0.5) for G1–59 and E18–38 binding as a function of the amino acid sequence.](/cms/asset/627c0935-7ac8-4ab5-a6af-8a0243f34da0/imbc_a_318510_f0002_b.jpg)
G1–59/E18–38-binding characterized by fluorescence correlation spectroscopy
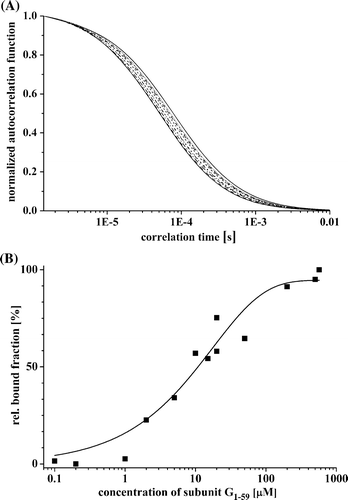
To confirm and quantify the G1–59/E18–38-binding, fluorescence correlation spectroscopy (FCS) has been used. The fit of the autocorrelation function of Atto655 labeled peptide E18–38 resulted in a characteristic diffusion time of 53.5 µs with a mean count rate of 61.1 kHz. A displays the plotted autocorrelation curves of the fluorescent labeled E18–38 in the absence and presence of non-fluorescent-labeled subunit G1–59. The increase of the diffusion time was due to the increase in the mass of the diffusing particle, when Atto655-E18–38 was interacting with subunit G1–59. A binding constant of about 10 µM bound E18–38 was calculated (B).
Figure 3. G1–59/E18–38–binding studied by fluorescence correlation spectroscopy. (A) Normalized autocorrelation functions of Atto655 labeled peptide E18–38 by increasing the quantity of subunit G1–59. (B) Concentration-dependent binding of E18–38 to subunit G1–59. The binding constant was calculated by determining the relative bound fraction using a standard autocorrelation two diffusion coefficients normalized triplet model (FCS-LSM software, ConfoCor 3, Zeiss). Best fits yielding the binding constants are represented as fitted line by a non-linear, asymptotic curve fit (see the text).
Assignment and structure calculation
To better understand the feature of the binding peptide E18–38, we determined its structural traits. The CD spectrum of E18–38 shows an α-helical structure (69%), indicated by minima at 208 and 222 nm (A). Using the standard procedure for sequential assignment based in homonuclear TOCSY and NOESY experiments, besides K38 all the residues of E18–38 were assigned (B). The connectivity diagram of E18–38 is indicative of a helical conformation with the sequential HN—HN, Hα—HN(i, i + 3), Hα—HN(i, i + 4), and Hα—Hβ(i, i + 3) connectivities (C). A shows an overlay of the five lowest energy structures of E18–38, and the statistics are given in . These structures have an overall root mean square deviation (RMSD) of 0.825±0.29 Å. All these structures have energies lower than −100 kcal mol-1, no NOE violations greater than 0.3 Å and no dihedral violations greater than 5°. The peptide displays a helix-hinge-helix structural motif (B). Both helices are separated by 119° and the C-terminal helix is bent in the z-axis relative to the N-terminal one by about 67° (C). It should be noted that in all the structures it is the hinge region which show least deviation. The peptide exhibits amphiphilic character such that the positive charge spread from the N-terminal and fades away at the C-terminal while the negative charge starts from the C-terminal and extends till the hinge region (Supplementary A, online version only). The exterior region of the helix-hinge-helix motif is distributed evenly with positive charge which is attributed to the residues K19, R25, K26, K31, and K38, whereas the interior region of this motif is distributed by negative charge coming from residues E27, E29, E30 and E34, where the hinge region is covered by E29 and E30 (Supplementary B, online version only).
Figure 4. (A) Far UV-CD spectrum of the peptide E18–38. (B) HN-HN region of the NOESY spectra of E18–38. (C) Connectivity diagram of E18–38. The line thickness reflects the intensities of the NOE connectivities.
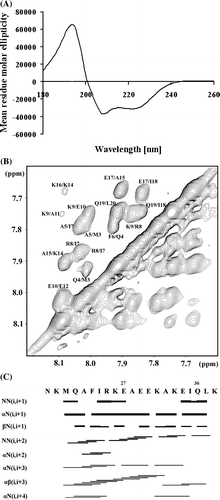
Figure 5. Cartoon representation for the NMR structure of the peptide E18–38. (A) Superposition of the five lowest energy structures, (B) average structure showing the angle between the helices and (C) average structure indicating the bend angle of the C-terminal helix with respect the N-terminal helix.
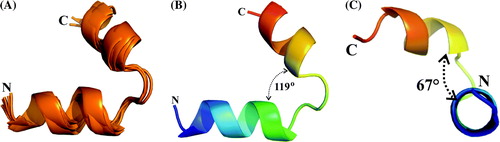
Table I. Summary of structural statistics for five selected structures of E18–38.
Model for the interface of G1–59/E18–38 complex
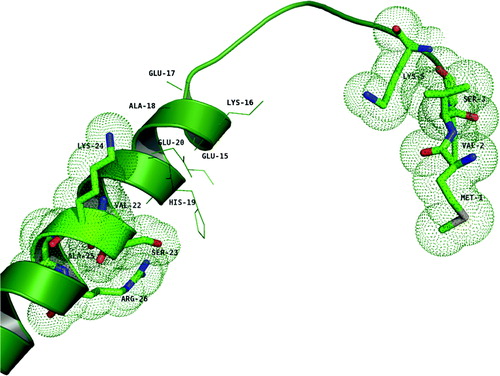
The NMR data presented demonstrate that residues M1, V2, S3, and K5 as well for V22, S23, K24, A25 and R26 contribute largely to the binding region of both subunits. While building the G1–59/E18–38 interacting domain, we have docked the helical peptide, E18–38, with G1–59 iteratively maximizing favorable interactions between the exposed sidechains (see Material and methods). shows a plausible model of the connected segments E18–38 and G1–59. The interface of the interacting segments turns out to be rich in polar residues as expected, since the E18–38 peptide are rich in polar residues, wherein the charged residues alone contributes 47.6%, other polar residues 14.3% and the non-polar residues 38.1%. Residues, E29, E30 of E18–38 may form potential salt bridges with R26 of G1–59 whereas the main chain nitrogen of N18 of E18–38 forms a hydrogen bond with mainchain carbonyl of M1 of G1–59. These strong interactions are also evidenced from the relatively large chemical shift in the HSQC spectrum (A) for the R26 and M1 residues. The shift in the HSQC spectrum for the residues S3 and K5 of G1–59 may be attributed to the weak hydrophilic interactions that they are involved in. Such as, the sidechain hydroxyl of S3 shows weak interaction with the sulphur of M20 (E18–38) and the sidechain nitrogen of K5 (G1–59) shows cation-Π interaction with the phenyl ring of the F23 (E18–38). The other binding residues, V22, S23, K24, A25 and V2 may confer hydrophobic interaction through van der Waals forces for the stability of the complex. In this model, in addition to these interactions with the binding region identified through NMR titration experiments, R25 and K26 of E18–38 forms hydrogen bond interaction with E20 and E17 of G1–59 respectively. The NMR HSQC spectrum did not show any marked shift for residues E20 and E17, probably because they are found near the N-terminal region which is flexible.
Figure 6. The structure of the modeled segment G1–59 (green). The residues shown in stick representation encircled with dotted spheres are the ones that are shown to have binding (M1, V2, S3 and K5; V22, S23, K24, A25 and R26) with the E18–38 peptide. Residues shown in line representation are the ones proposed to be in the interacting region in the docked complex.
Discussion
Subunit G is required for assembly Citation[21–23], ATPase activity Citation[24–27] as well as for proton pumping catalyzed by the V1VO complex Citation[23], Citation[24], Citation[41]. A vma10 null mutation resulted in loss of ATP-dependent proton uptake activity Citation[23]. For the H+-ATPase of clathrin-coated vesicles it has been demonstrated that the addition of recombinant subunit G to a recombinant A3B3CE-complex significantly increased the ATPase activity Citation[24]. Recent work on the relationship of nucleotide binding and interaction of subunit G with other stalk subunits showed a trapped CaATP conformation of the V1 ATPase after CuCl2 addition in which a zero-length crosslink E-G was formed Citation[16]. By comparison, no crosslink between these subunits can be obtained in the trapped CaADP form, implying a rearrangement of both subunits during coupling Citation[16]. Using precipitation assays with truncated forms of subunit E of the yeast V-ATPase, Jones et al. Citation[29] have shown that deletions of the N-terminal 38 (E39–233) and 110 amino acids (E110–233) results in a complete loss of E-G association, whereby the truncations of the first 19 residues or the C-terminal amino acids 112–233 (E1–112) did not alter the binding traits of both subunits, suggesting that the N-terminal region 19–38 of subunit E might interact with subunit G. The presented NMR and FCS titration data support the view that the association of subunit E and G occurs only via the N-terminal regions of both subunits, and allows the clear identification of amino acids M1, V2, S3, and K5 as well for V22, S23, K24, A25 and R26 of subunit G in the assembly of E18–38 (B). The importance of the positively charged amino acids among K24 to R26 is supported by mutational analysis Citation[23], in which the residue R26 has been substituted to Ala or Leu, resulting in an inhibited disassembly of V1 from VO in response to glucose deprivation. As pointed out above (see Results) the interface of the interacting subunits are rich in polar residues in G1–59 as well as in the peptides E18–38, with the latter being almost universally conserved among eukaryotic V-ATPases Citation[29], and allows thereby salt bridge formations between both proteins (). Importantly, no binding could be detected, when the truncated protein E39–233 (A, online version only) or the peptide E1–18, shown to interact with subunit C Citation[30], has been used. Furthermore, when 15N labeled G61–114 has been titrated with E39–233 (B, online version only) no chemical shift could be observed either, indicating that the E-G association occurs only via the N-terminal segment of both subunits. Together with the data published by Jones et al. Citation[29] the present results exclude that E and G might form a coiled-coiled interaction over the length of both molecules as proposed Citation[40].
Figure S1. (A) Overlaid 1H/15N-HSQC spectra of G1–59 in the absence (red) and presence (blue) of 1.5 equivalents of E39–233 in 25 mM sodium phosphate buffer (pH 6.8) at 288 K. (B) Overlaid 1H/15N-HSQC spectra of G61–114 in the absence (red) and presence (blue) of 1.5 equivalents of E39–233 in 25 mM sodium phosphate buffer (pH 6.8) at 288 K. (C) Overlaid 1H/15N-HSQC spectra of G1–59 in the absence (red) and presence (yellow) of 1.5 equivalents of E1–18 in 25 mM sodium phosphate buffer (pH 6.8) at 288 K.
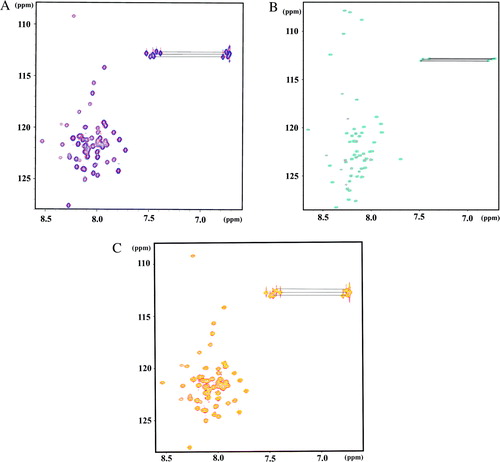
Figure S2. The molecular surface showing the electrostatic potential of the peptide E18–38 drawn in pyMol (DeLano WL [2001] The pyMol Molecular Graphics SystemSan Carlos, CA: DeLano Scientific) that uses Poisson-Boltzmann equation, where the positive potentials are drawn in blue and negative in red. (A) Front view, (B) Back view.
![Figure S2. The molecular surface showing the electrostatic potential of the peptide E18–38 drawn in pyMol (DeLano WL [2001] The pyMol Molecular Graphics SystemSan Carlos, CA: DeLano Scientific) that uses Poisson-Boltzmann equation, where the positive potentials are drawn in blue and negative in red. (A) Front view, (B) Back view.](/cms/asset/52afe9e1-698c-4929-9769-f0a0379da5f1/imbc_a_318510_f0008_b.jpg)
The 3D structure of E18–38 shows a helix-hinge-helix formation in which both helices are separated by 119° and the C-terminal helix is bent in the z-axis relative to the N-terminal one by about 67°. This arrangement brings both helices in close proximity with the detected amino acid regions inside the N-terminus of subunit G and allows the plausible docking of this peptide to G1–59. The helix-hinge-helix formation also indicates that the N- and C-termini of subunit E might at least partially be separate, which allows subunit C and E to associate Citation[29], Citation[30] via the very N-terminal amino acids 1–18 of E Citation[29]. Point mutations in the N-terminal half of subunit G (E14A) resulted in destabilization of subunit E and C Citation[23], which could be caused by an alteration of the flexible part between Lys5 and Lys16 of subunit G and thereby weaken interaction between subunit E and G. Based on crosslinking by zero-length crosslink reagents EDC and CuCl2, subunit E is in close neighborhood to subunit D in both the V1 complex Citation[17] and the V1VO ATPase Citation[13]. As mapped for the D-E product inside the Manduca sexta V1 ATPase the CuCl2 induced crosslink is formed by the cysteine residue 178 of the C-terminus of subunit E Citation[17]. In addition, subunit E forms also a zero-length crosslink with subunit F in the V1 complex, when CaATP is bound to the enzyme Citation[16]. As mentioned above the crosslink formation and/or the strength of such formed products inside the V1 sector are nucleotide dependent. In the way as CaATP induces E-F and E-G crosslinks Citation[16], the D-E formation is strong after addition of MgADP whereas a lower amount is produced in the presence of MgATP or -AMP·PNP Citation[17]. Although E18–38 makes up only a segment of subunit E, the 3D structure of this peptide gives a first insight into how the neighboring subunit(s) of E might bind and that this subunit has at least one hinge region which might translate conformational changes in the V1 ATPase during coupling as well as rearrangements combined with the process of reversible V1 and VO disassembly. The binding constant of G1–59/E18–38 determined, which might be lower in the entire enzyme, is in line with two subunits, undergoing rearrangements during catalysis, assembly and regulative processes Citation[41], Citation[42].
Acknowledgements
We are grateful to Dr C. F. Liu and Ms I. Toh Mui Jin (School of Biological Sciences, NTU) for synthesizing the peptides. S. Rishikesan and S. Gayen are grateful to the authority of Nanyang Technological University (NTU) for awarding research scholarship. This research was supported by the School of Biological Sciences, NTU. Declaration of interest: The authors report no conflicts of interest. The authors alone are responsible for the content and writing of the paper. A Declaration of interest statement reporting no conflict of interest has been inserted.
References
- Nelson N. A journey from mammal to yeast vacuolar H+-ATPase (V-ATPase). J Bioenerg Biomembr 2003; 35: 281–290
- Marshansky V. The V-ATPase a2-subunit as a putative endosomal pH-sensor. Biochem Soc Trans 2007; 35: 1092–1099
- Lolkema JS, Chaban Y, Boekema EJ. Subunit composition, structure, and distribution of bacterial V-Type ATPase. J Bioenerg Biomembr 2003; 35: 323–336
- Kluge C, Lahr J, Hanitzsch M, Bolte S, Golldack D, Dietz KJ. New insight into the structure and regulation of the plant vacuolar H+-ATPase. J Bioenerg Biomembr 2003; 35: 377–388
- Müller V, Grüber G. ATP syntases: structure, function and evolution of unique energy converters. Cell Mol Life Sci 2003; 60: 474–494
- Sumner JP, Dow JAT, Earley FG, Klein U, Jäger D, Wieczorek H. Regulation of plasma-membrane V-ATPase activity by dissociation of peripheral subunits. J Biol Chem 1995; 270: 5649–5653
- Kane PM. Disassembly and reassembly of the yeast vacuolar H+-ATPase in vivo. J Biol Chem 1995; 270: 17025–17032
- Trombetta ES, Ebersold M, Garrett W, Pypaert M, Mellman I. Activation oflysosomal function during dendritic cell maturation. Science 2003; 299: 1400–1403
- Svergun DI, Konrad S, Huss M, Koch MHJ, Wieczorek H, Altendorf K, Volkov VV, Grüber G. Quaternary structure of V1 and F1 ATPase: significance of structural homologies and diversities. Biochemistry 1998; 37: 17659–17663
- Radermacher M, Ruiz T, Harvey WR, Wieczorek H, Grüber G. Molecular architecture of Manduca sexta midgut V1 ATPase visulalized by electron microscopy. FEBS Lett 1999; 453: 383–386
- Radermacher M, Ruiz T, Wieczorek H, Grüber G. Three-dimensional electron microscopy reveals the structure of the V1-ATPase. J Struct Biol 2001; 135: 26–37
- Chaban Y, Ubbink-Kok T, Keegstra W, Lolkema JS, Boekema EJ. Composition of the central stalk of the Na+-pumping V-ATPase from Caloramator fervidus. EMRO Rep 2002; 3: 1–10
- Xu T, Vasilyeva E, Forgac M. Subunit interactions in the clathrin-coated vesicle vauolar (H+)-ATPase complex. J Biol Chem 1999; 274: 28909–28915
- Jefferies KC, Forgac M. Subunit H of the V-ATPase inhibits ATP hydrolysis by the free V1 domain by interaction with the rotary subunit F. J Biol Chem 2007; 283: 4512–4519
- Venzke D, Domgall I, Köcher T, Féthière J, Fischer S, Böttcher B. Elucidation of the stator organization in the V-ATPase of Neurospora crassa. J Mol Biol 2005; 349: 659–669
- Grüber G, Radermacher M, Ruiz T, Godovac-Zimmermann J, Canas B, Kleine-Kohlbrecher D, Huss M, Harvey WR, Wieczorek H. Three-dimensional structure and subunit topoloy of the V1 ATPase from Manduca sexta midgut. Biochemistry 2000; 39: 8609–8616
- Coskun Ü, Rizzo VF, Koch MHJ, Grüber G. Ligand-dependent structural changes in the V1 ATPase from Manduca sexta. J Bioenerg Biomembr 2004; 36: 249–256
- Armbrüster A, Svergun DI, Coskun Ü, Juliano S, Bailer SM, Grüber G. Structural analysis of the stalk subunit Vma5p of the Yeast V-ATPase in solution. FEBS Lett 2004; 570: 119–125
- Drory O, Frolow F, Nelson N. Crystal structure of yeast V-ATPase subunit C reveals its stator function. EMBO Rep 2004; 5: 1148–1152
- Sagermann M, Stevens TH, Matthews BW. Crystal structure of the regulatory subunit H of the V-type ATPase of Saccharomyces cerevisiae. Proc Natl Acad Sci USA 2001; 98: 7134–7139
- Tomashek JJ, Graham LA, Hutchins MU, Stevens TH, Klionsky DJ. V1-situated stalk subunits of the yeast vacuolar proton-translocating ATPase. J Biol Chem 1997; 272: 26787–26793
- Tomashek JJ, Garrison BS, Klionsky DJ. Reconstitution in vitro of the V1 complex from the yeast vacuolar proton-translocating ATPase. Assembly recapitulates mechanism. J Biol Chem 1997; 272: 26787–26793
- Charsky CMH, Schumann NJ, Kane PM. Mutational analysis of subunit G (Vma10p) of the yeast vacuolar H+-ATPase. J Biol Chem 2000; 275: 37232–37239
- Crider BP, Andersen P, White AE, Zhou Z, Li X, Mattson JP, Lundberg L, Keeling DJ, Xie XS, Stone DK, Peng SB. Subunit G of the vacuolar proton pump. Molecular characterization and functional expression. J Biol Chem 1997; 272: 10721–10728
- Gräf R, Harvey WR, Wieczorek H. Purification and properties of a cytosolic V1-ATPase. J Biol Chem 1996; 271: 20908–20913
- Grüber G, Godovac-Zimmermann J, Link TA, Coskun Ü, Rizzo VF, Betz C, Bailer S. Expression, purification and characterization of subunit E, an essential subunit of the vacuolar-ATPase. Biochem Biophys Res Comm 2002; 298: 383–391
- Rizzo VF, Coskun Ü, Radermacher M, Ruiz T, Armbrüster A, Grüber G. Resolution of the V1-ATPase from Manduca sexta into subcomplexes and visualization of an ATPase active A3B3EG-complex by electron microscopy. J Biol Chem 2003; 278: 270–275
- Armbrüster A, Bailer SM, Koch MHJ, Godovac-Zimmermann J, Grüber G. Dimer formation of subunit G of the yeast V-ATPase. FEBS Lett 2003; 546: 395–400
- Jones RPO, Durose LJ, Findlay JBC, Harrison MA. Defined sites of interaction between subunit E (Vma4p), C (Vma5p), and G (Vma10p) within the stator structure of the vacuolar H+-ATPase. Biochemistry 2005; 44: 3933–3941
- Féthière J, Venzke D, Madden DR, Böttcher B. Peripheral stator of the yeast V-ATPase: stoichiometry and specificity of interaction between the EG complex and subunit C and H. Biochemistry 2005; 44: 15905–15914
- Laemmli UK. Cleavage of structural proteins during the assembly of the head of bacteriophage T4. Nature 1970; 227: 680–685
- Biuković G, Rössle M, Gayen S, Mu Y, Grüber G. Small-angle X-ray scattering reveals the solution structure of the peripheral stalk subunit H of the A1AO ATP synthase from Methanocaldococcus jannaschii and its binding to the catalytic A subunit. Biochemistry 2007; 46: 2070–2078
- Kneller DG, Goddard TD. 1997. SPARKY 3.105 edit. San Francisco, CA: University of California.
- Wüthrich K. 1986. NMR of proteins and nuclei acids. New York: Wiley, Interscience; 1986.
- Herrmann T, Güntert P, Wüthrich K. Protein NMR structure determination with automated NOE assignment using the new software CANDID and the torsion angle dynamics algorithm DYANA. J Mol Biol 2002; 319: 209–227
- Hunke C, Chen WJ, Schäfer HJ, Grüber G. Cloning, purification, and nucleotide-binding traits of the catalytic subunit A of the V1VO ATPase from Aedes albopictus. Protein Expr Puri. 2007; 53: 378–383
- Guex N, Peitsch MC. SWISS-MODEL and the Swiss-PdbViewer: an environment for comparative protein modeling. Electrophoresis 1997; 18: 2714–2723
- Emsley P, Cowtan K. Coot: Model-Building Tools for Molecular Graphics. Acta Cryst 2004; D60: 2126–2132
- Tovchigrechko A, Vakser IA. GRAMM-X public web server for protein-protein docking. Nucleic Acids Res 2006; 34: 310–314
- Kitagawa N, Mazon H, Heck AJR, Wilkens S. Stoichiometry of the peripheral stalk subunits E and G of yeast V1-ATPase determined by mass spectrometry. J Biol Chem 2008; 283: 3329–3337
- Poltermann S, Nguyen M, Günther J, Wendland J, Härtl A, Künkel W, Zipfel PF, Eck R. The putative vacuolar ATPase subunit Vma7p of Candida albicans is involved in vacuole acidification, hyphal development and virulence. Microbiology 2005; 151: 1645–1655
- Miura K, Miyazawa S, Furuta S, Mitsushita J, Kamijo K, Ishida H, Miki T, Suzukawa K, Resau J, Copeland TD, Kamata T. The Sos1-Rac1 signaling. Possible involvement of a vacuolar H(+)-ATPase E subunit. J Biol Chem 2001; 276: 46276–46283