Abstract
Adrenergic receptors are integral membrane proteins involved in cellular signalling that belong to the G protein-coupled receptors. Synthetic peptides resembling the putative transmembrane (TM) segments TM4, TM6 and TM7, of the human α2-adrenergic receptor subtype C10 (P08913) and defined lipid vesicles were used to assess protein-lipid interactions that might be relevant to receptor structure/function. P6 peptide contains the hydrophobic core of TM6 plus the N-terminal hydrophilic motif REKR, while peptides P4 and P7 contained just the hydrophobic stretches of TM4 and TM7, respectively. All the peptides increase their helical tendency at moderate concentrations of TFE (30–50%) and in presence of 1,2-dielaidoyl-sn-glycero-3-phosphatidylethanolamine (DEPE) lipids. However, only P6 displays up to 19% of α-helix in the presence of just the DEPE lipids, evidences a transmembrane orientation and stabilizes the Lα lipid phase. Conversely, P4 and P7 peptides form only stable β-sheet structures in DEPE and favour the non-lamellar, inverted hexagonal (HII) phase of DEPE by lowering its phase transition temperature. This study highlights the potential of using synthetic peptides derived from the amino acid sequence in the native proteins as templates to understand the behaviour of the transmembrane segments and underline the importance of interfacial anchoring interactions to meet hydrophobic matching requirements and define membrane organization.
| Abbreviations | ||
| GPCR | = | G protein-coupled receptor |
| AR | = | Adrenergic receptor |
| α2-AR | = | α2-adrenergic receptor |
| TM | = | transmembrane segment |
| TMH | = | membrane-spanning α-helix |
| PE | = | phosphatidylethanolamine |
| DEPE | = | 1,2-dielaidoyl-sn-glycero-3-phosphatidylethanolamine |
| DPPC | = | 1,2-dipalmitoyl-sn-glycero-3-phosphatidylcholine |
| MLV | = | multilamellar lipid vesicles |
| Lβ | = | gel lamellar phase |
| Lα | = | liquid-crystalline lamellar phase |
| HII | = | inverted hexagonal phase |
| d | = | lattice space |
| Tm | = | gel-to-liquid lamellar phase transition temperature |
| TH | = | lamellar-to-inverted hexagonal phase transition temperature |
Introduction
Adrenergic receptors (AR) are integral membrane proteins that belong to the large family of G protein-coupled receptors (GPCRs) Citation[1]. AR are classified in three major types, α1, α2 and β. In particular, α2-adrenergic receptors (α2-AR) have three subtypes (α2A/α2-C10, α2B/α2-C2 and α2C/α2-C4) that share structural and functional common properties Citation[2]. The three subtypes interact with and activate the Gi/o class of guanine nucleotide proteins and through that interaction regulate several signalling pathways, such as the inhibition of adenylate cyclase and voltage-gated calcium channels or the activation of receptor-operated K+ channels. α2-AR subtypes differ with respect to their coupling efficiency in the signalling process and in the regulation of the physiological process Citation[3], Citation[4].
GPCR-associated signalling takes place at the plasma membrane; however, the molecular basis of the interaction of GPCR with biomembranes is largely unknown. This situation is partly due to the fact that the protein structure of GPCRs is not yet sufficiently known. To date, our understanding of GPCR structure is mainly based on the high-resolution crystal structure of bovine rhodopsin Citation[5], Citation[6] and more recently, the human β2 adrenergic G-protein-coupled receptor Citation[7]. Computational modelling has also predicted that GPCRs share a seven membrane-spanning α-helix topology as a common structural property Citation[8], Citation[9]. Likewise, mutagenesis studies have tentatively identified individual transmembrane domains with specific roles in signal transduction function that are conserved throughout the GPCR family Citation[10]. Similar approaches are in progress to gain insight into the three dimensional structure of α2-AR Citation[11–13].
Being integral membrane proteins, the biological activities of GPCRs are expected to be regulated by a specific membrane lipid environment. In turn, membrane proteins should also perturb the lipid structure and the organization of the membrane with which they interact. Thus, these two facets of protein-lipid interactions should be considered as potentially relevant to GPCR-associated signalling, although there is very little information currently available on the subject. For instance, GPCRs are known to undergo conformational changes that affect their transmembrane regions Citation[14]. Also, GPCRs, like G proteins, seem to display preferences for PE-rich domains. Interestingly, PE modulates the conformational energetics of rohodopsin Citation[15] and also enhance its photoactivation and transducing binding Citation[16].
Synthetic peptides and peptides mimicking transmembrane sequences provide a viable reductionist system to get a better understanding of protein-lipid interactions in transmembrane proteins Citation[17], Citation[18]. Earlier reports have shown that synthetic peptides affect the lipid phase behaviour in PE and PC membranes in a mismatch-dependent manner Citation[19–24]. Two general mechanisms have been entertained in order to accommodate the TM segment to the bilayer thickness. First, the peptide hydrophobic mismatch effect could be alleviated by a distortion of the lipid bilayer inducing changes in the phase behaviour and/or promoting the formation of nonlamellar phases as a function of the hydrophobic mismatch Citation[25], Citation[26]; and second, the conformational flexibility of TM segments would allow them to tilt or flex to match the hydrophobic thickness of the bilayer Citation[26–30]. Such conclusions have also been confirmed by molecular dynamics simulation Citation[31], Citation[32].
In the present study we have used model membranes and synthetic peptides with the sequences of the putative transmembrane segments of the human α2-adrenergic receptor (α2-AR) as a reductionist simple system to get a better understanding on the role of protein-lipid interactions in this system. For this purpose, we synthesized three peptides (P4, P6 and P7) with an amino acid sequence of the putative transmembrane segments TM4, TM6 and TM7 according to the model structure of the receptor Citation[33]. The phospholipids 1,2-dielaidoyl-sn-glycero-3-phosphatidylethanolamine (DEPE) and 1,2-dipalmitoyl-sn-glycero-3-phosphatidylcholine (DPPC) were used as model membranes to probe the effect of these peptides to promote the formation of nonlamellar phases. We have attempted to address both, the effects of the peptides on membrane organization and those of the lipid bilayer composition on peptide structure.
Materials and methods
Materials
1,2-dielaidoyl-sn-glycero-3-phosphatidylethanolamine (DEPE), 1,2-dipalmitoyl-sn-glycero-3-phosphatidylcholine (DPPC) were purchased from Avanti Polar Lipids, Inc. (Alabaster, AL, USA) and stored under argon at −80°C. N-(2-Hydroxy ethyl) piperazine-N’-(2-ethanesulfonic acid) sodium salt (Hepes) and deuterium oxide (D2O) were obtained from Sigma Chem. Co. (Poole, Dorset, UK).
Peptide synthesis
The sequence and structure of the seven membrane-spanning α-helix (TMH) of human alpha 2A-adrenergic receptor subtype C10 (ADA2A_HUMAN; P08913) were obtained from Swiss-Prot Database. Three peptides, P4, P6 and P7 (), corresponding to the amino acid sequences 154–171, 368–391 and 412–429 of the potential transmembrane segments of ADA2A-HUMAN were synthesized as C-terminal amidated forms on an automatic peptide synthesizer (Abi 430A, Applied Biosystems, Foster City, CA, USA) at the University of Barcelona (Barcelona, Spain). The peptides were purified by HPLC to 95% purity and further analysed by amino acid analysis MALDI-TOF mass spectrometry. Residual trifluoroacetic acid from peptide purification was removed by three lyophilization/solubilization cycles in 10 mM HCl, to avoid interference in the characterization of the amide I’ band in FTIR studies. Stock solutions of P4 and P7 were prepared in chloroform/methanol and P6 in trifluoroethanol and stored at −80°C until used.
Table I. Peptide synthesis.
Sample preparation
For X-ray diffraction experiments, multilamellar lipid vesicles (MLV) containing 15% (w/w) lipids in 10 mM Hepes, 100 mM NaCl, 1 mM EDTA, pH 7.4 (Hepes buffer) were prepared according to established procedures Citation[34]. Samples were prepared by weighing and mixing appropriate amounts of lipid and peptide at the desired molar ratio. Lipid powder in presence or absence of peptides was hydrated and the mixture was thoroughly homogenized with a pestle-type minihomogenizer (Sigma Chemical) followed by vortexing. The suspensions were then submitted to ten temperature cycles (70°C and −20°C) and equilibrated prior to data acquisition.
For differential scanning calorimetry (DSC) analysis with DPPC membranes, lipid-peptide samples were prepared by a mixed-film method. Appropriate volumes of peptide and lipid stock solutions were mixed, vortexed and vacuum-dried overnight. For measurement of DEPE membranes, a defined amount of the mixtures was transferred to an aluminium pan, hydrated by adding Hepes buffer to a final concentration of 85% by weight and hermetically sealed. All samples were submitted to 10 temperature cycles (70°C and −20°C), to ensure full homogenization. For FTIR studies, MLV were prepared by a mixed-film method as described for DSC samples except that the lipid film was hydrated by adding D2O-Hepes buffer (pD 7.4).
X-ray diffraction analysis
Small and Wide-Angle (SAXS and WAXS) Synchrotron radiation X-ray scattering data were collected simultaneously, using standard procedures, on the Soft Condensed Matter beamline A2 of Hasylab of the Deutsches Elektronen Synchrotron (DESY). DPPC samples were heated from 25–50°C at a scan rate of 1°C/min, and then cooled down to 25°C to check the reversibility of the transitions. For measurement of DEPE samples in quasi-equilibrium conditions, the lipid mixtures were allowed to equilibrate for 15 min at each temperature before data acquisition. The data collection conditions were the same as those described previously Citation[34].
Differential scanning calorimetry (DSC)
Experiments with DEPE or DPPC membranes were carried out on a DSC 2920 scanning calorimeter (TA instruments Spain, Madrid, Spain) or a differential scanning microcalorimeter (MC-2, Microcal Inc., Northampton, MA, USA), respectively. Samples were heated and cooled at a scan rate of 1°C/min. In DEPE membranes (2 mg of lipid mixture), the reproducibility of the results was checked by recording three heating scans of the same sample. Cooling and heating scans yielded similar thermograms, with the transitions in the cooling curves shifting to lower temperature. Thermotropic transitions were evaluated from the heating curves. Data were analysed with the machine software package. The lipid phase transition temperatures (Tm and TH) were determined from the maximum of the excess heat flow vs temperature curves and the transition enthalpy was obtained from the area below the peak. In DPPC membranes (2 mM in lipid phosphorus), transition temperatures and enthalpies were calculated by fitting the transitions to a single Van't Hoff component. The deconvolution analysis of the calorimetric peaks was performed using the Microcal Origin software.
FTIR spectroscopy
Sample measurements were performed in a liquid demountable cell (Harrick, Ossining, NY, USA) equipped with CaF2 windows and 50-µm-thick Mylar spacers. FTIR analysis was carried out on a Bruker IF66/S (Billerica, MA, USA), equipped with deuterated triglycine sulfate (DTGS) detectors. The sample chamber was constantly purged with dry air. A minimum of 200 scans per spectra were taken, averaged, apodized with a Happ-Genzel function and Fourier-transformed to give a nominal resolution of 2 cm−1. Self-deconvolution was performed using a Lorenztian bandwidth of 18 cm−1 and a resolution enhancement factor of 2.0 Citation[35]. The temperature scanned was from 25–75°C, measured in steps of 2°C. Afterwards, the samples were cooled and equilibrated at 20°C to check the reversibility of the transitions.
Peptide-membrane interactions were studied with MLV in D2O-Hepes buffer (45 mM in lipid phosphorus), as described previously Citation[34]. The membrane-bound peptide was separated from the free peptide by centrifuging at 20,000 g for 20 min at 4°C. The pellets were resuspended in 20 µl of D2O-Hepes buffer. The amide I’ band region of these samples and that of the supernatants was further analyzed. The peptide secondary structure was estimated from the IR spectra by decomposition of the Amide I’ band into its spectral components.
Fluorescence spectroscopy
Experiments were carried out on a thermostated Perkin-Elmer MPF-66 fluorescence spectrophotometer (Foster City, CA, USA). SUV of DEPE:peptide mixtures (20:1 molar ratio) (30 µM in phospholipid) were prepared from MLV by sonication in an ice-water bath with a Branson 250 sonicator equipped with a microtip until the solution became clear. The membrane-bound peptide was separated from the free peptide by centrifugation as described above. Samples were excited at 280 nm (bandwidth 4 nm) and the fluorescence emission spectrum was registered at 25°C. Light scattering was always checked using liposomes of DEPE alone. The fluorescence intensity of DEPE samples without peptides was < 2%. Furthermore, acrylamide quenching experiments were carried out at the excitation wavelength of 290 nm instead of 280 nm to reduce the absorbance by acrylamide. The fluorescence intensity was measured at 340 nm (bandwidth 4 nm) and corrected for dilution. Data were analyzed according to the Stern-Volmer equation: Fo/F = 1 + Ksv[Q], where Fo and F are the fluorescence intensities in the absence and presence of quencher, [Q] is the molar concentration of acrylamide and Ksv is the Stern-Volmer quenching constant.
Results
Peptide structure and peptide-membrane association
FTIR spectra of phospholipid-peptide mixtures were recorded as a function of temperature (heating and cooling mode) and lipid-peptide molar ratio (1:45, 1:30 and 1:10). The amide I’ band of DEPE- and DPPC-peptide mixtures () appeared exclusively in the membrane pellet obtained by centrifugation, suggesting that all peptide present is membrane-bound. The peptide structure was studied by decomposing the amide I’ band (1700–1600 cm−1), which mainly arises from the carbonyl stretching vibration in the peptide bond Citation[36]. Such results are listed in . Bands at 1620–1626 cm−1 and 1634–1636 cm−1 are characteristic of β-strands. Bands around 1640–1644 cm−1 were assigned to non-ordered polypeptide fragments. Bands at 1660–1665 cm−1 and 1670–1675 cm−1 corresponded to turns, while those at 1680–1695 cm−1 were ascribed not only to turns, but also to high frequency β-strands. Finally, bands around 1654–1656 cm−1 were assigned to α-helix.
Figure 1. FTIR amide I’ band spectra. Amide I’ band of P4 peptide (panels A, D), P6 peptide (panels B, E), and P7 peptide (panels C, F) in presence of DEPE (left panels) or DPPC lipid vesicles (right panels) at the temperature indicated. Bottom spectra of each panel includes band fitting analysis with the components bands and the reconstructed spectra in dashed line, that are virtually superimposed with the original spectra. The lipid:peptide molar ratio was 10:1 (panels A, B and C) and 45:1 (panels D, E and F). The buffer spectrum was subtracted from those of the samples containing the peptides. This Figure is reproduced in colour in Molecular Membrane Biology online.
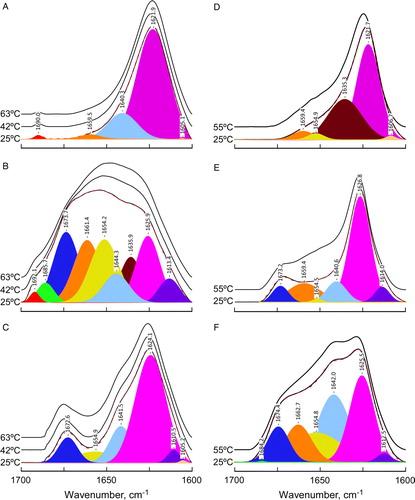
Table II. Amide I’ band components.
The main feature of the spectra of these peptides in the presence of either DPPC or DEPE was the prevalence of β-structure. The exception to such rule was for the peptide P6 in DEPE membranes, where other secondary structure motifs were present (B). In particular, P6 peptide in presence of DEPE vesicles showed a significant percentage (∼19%) of α-helix. Moreover, only this sample presented an amide II band near 1647 cm−1 (data not shown). Such band reflects slowly-exchanging or non-exchangeable amide protons which remain as such in the D2O media. Such behaviour could be explained by the presence of highly structured, non-exposed protein motifs, such as the proposed very stable α-helix, deeply buried in the hydrophobic domain of the lipid bilayer Citation[37]. In addition to this unique behaviour of P6, the spectra of either one of the three peptides in DEPE vesicles showed an increase in α-helical structure when taken in the presence of TFE at concentrations higher than 30% (data not shown). This trend is less clear for samples of the same peptides in the presence of DPPC lipids, which require much higher TFE concentrations (even higher than 70% TFE) to see significant increases in α-helix. These observations can be interpreted to favour the idea that not only P6, but also P4 and P7 have a certain propensity to adopt helical structures in environments that simulate more adequately the hydrophobic portion of the lipid bilayer.
The main low frequency β-strand component was present in all spectra and most likely corresponds to an ‘intermolecular’ motif, characteristic of a peptide aggregation phenomenon. This idea is consistent with the observed concentration-dependence of such β-component as illustrated in A for the P4 peptide in DEPE at three different lipid-to-protein molar ratios. Similar results were found also for the other two peptides (data not shown), both in presence of DEPE or DPPC lipids.
Figure 2. Temperature dependence of peptide conformation. (A) Absorbance ratio at 1625/1640 for P4 peptide in presence of DEPE lipid vesicles at different lipid:peptide molar ratios: 45:1 (Δ), 30:1 (▾) and 10:1 (•). (B) Left scale represents the temperature dependence of tyrosine infrared vibration for P7 peptide with DEPE lipid vesicles at lipid:peptide molar ratio 10:1. Right scale shows normalized absorbance ratio at 1624/1640 versus temperature increase in the same sample.
also shows the effects of increasing temperature on the spectra of the different peptides in the two lipid media. Although the increase in temperature causes only minor changes in spectral shape, the representation of the absorbance ratio 1624/1640 (A) versus temperature suggests that changes in peptide structure clearly occurs at temperatures matching those derived from the monitoring of lipid phase transitions, i.e., those based on the CH2 symmetric stretching and on the hydration of the phospholipids carbonyl group (see ). Finally, monitoring of ring stretching vibrations of tyrosine has been used as a probe for changes in tertiary structure of both peptides and proteins Citation[38]. B shows the occurrence of a 1515 cm−1 vibration in the P7 peptide, which has a tyrosine residue at its C-terminal end. Such a frequency value indicates that the tyrosine residue was in a hydrophilic environment, while its temperature dependence indicates that thermal unfolding of the peptides involves also changes in the microenvironment of side-chain groups, which also occurs in parallel with changes in the lipid phase.
Figure 3. FTIR temperature profiles of DEPE:peptide mixtures. Temperature-dependent changes in the intensity band ratio of the carbonyl stretching modes (A, C, E) and in the frequency of the CH2 symmetric stretching (B, D, F) observed in the FTIR spectra shown by peptide-free (closed circles), and P4 (A, B), P6 (C, D), P7 (E, F) peptide-containing DEPE phospholipid bilayers at 45:1 (inverted gray triangles) and 10:1 (open triangles) lipid:peptide molar ratio.
Peptide-lipid interactions determined by FTIR
Both, the carbonyl- and the methylene stretching bands in the infrared spectra of peptide/phospholipid samples have been studied as a function of temperature and peptide-lipid molar ratio to provide information on peptide-lipid interactions in these systems.
Membrane lipid interfacial region
The carbonyl stretching region showed two bands at 1740 and 1720 cm−1 for DEPE and DPPC membranes that were attributed to hydrated and dehydrated carbonyl groups of phospholipids, respectively Citation[39]. DPPC samples did not change at all in the presence of any of the peptides used in these studies. On the contrary different peptide effects were detected in the DEPE samples (). Thus P4 and P7 peptides decreased the 1740/1720 band ratio, while the P6 peptide increases dehydration of the carbonyl groups at the membrane interface (, panels A, C and D).
Phospholipid acyl chain region
Monitoring of the temperature dependence of the methylene symmetric stretching mode (?s(CH2)) at 2850 cm−1 allowed us to obtain the transition temperatures for the Lβ-to-Lα and Lα-to-HII phase transition (34.6°C and 61.3°C) in DEPE membranes (, panels B, D and F), as well as the Lβ‘-to-Pβ‘ pretransition and the Pβ‘-to-Lα phase transition (37.8 and 38.3°C, respectively) in DPPC membranes. Again none of the peptides produced any significant changes in the DPPC membranes and therefore, we did not pursue their study any further. However, in DEPE membranes, the frequency of the methylene stretching band was decreased by all peptides in a concentration dependent manner, which has been associated with an increase in the hydrocarbon chain conformational order in the bilayer core Citation[39]. Nonetheless, the Lβ-to-Lα phase transition temperature as monitored by such frequency was not altered by presence of any of the peptides. Finally, while P4 and P7 clearly decreased the temperature of the Lα-to-HII phase transition characteristic of DEPE membranes, P6 did not significantly affect such phase transition (data not shown). This seems in agreement with the calorimetric and X-ray diffraction data reported below.
Tryptophan fluorescence of peptides
The DEPE/peptide pellets from the centrifugation assays showed emission maxima at 342, 338 and 335 nm for P7-, P4- and P6-lipid mixtures, respectively. These are blue-shifted with respect to that of a Trp solution (354 nm), suggesting that Trp residues within the peptides were protected from exposure to the aqueous solvent, buried in a hydrophobic environment. Stern-Volmer constants calculated from acrylamide quenching experiments () indicate that P6 is more effectively buried in the hydrophobic environment than P4 and P7.
Figure 4. Tryptophan fluorescence. Stern-Volmer plots of tryptophan fluorescence quenching with acrylamide of DEPE:P4 (2.2 M−1) (--Δ--), DEPE:P6 (1.4 M−1) (––□––) and DEPE:P7 (3.2 M−1) (– –○– –) at 25°C. The excitation wavelength was at 290 nm and emission wavelength at 340 nm. Insert: Trp fluorescence emission spectra of Trp alone, lipidic pellets DEPE:P4 (----), DEPE:P6 (––––) and DEPE:P7 (– –) and the supernatants depleted of vesicles (doted line) recorded with an excitation wavelength of 280 nm. The lipid-peptide molar ratio was 20:1.
Effect of peptides on the lipid thermotropic phase behaviour
The calorimetric behaviour of DEPE-peptide samples did not appear as that of an ideal solution, not even for the lipid alone ().
Figure 5. DSC thermograms of DEPE-peptide mixtures. (A, C) Heating and (B, D) cooling scans of DEPE alone and in presence of P4, P6 or P7 peptide at a molar ratio 10:1. DSC runs were performed at a scan rate of 1°C/min. (E, F) Effect of the peptide concentration on the calorimetric data of Lβ-to-Lα and Lα-to-HII phase transitions for DEPE:P4 (--Δ--), DEPE:P6 (––□––) and DEPE:P7 (– –○– –) mixtures.
DEPE membranes showed a Lβ-to-Lα phase transition and a less energetic Lα-to-HII phase transition. DEPE:P7 and DEPE:P4 mixtures had a similar thermotropic behaviour. Increasing concentrations of P4 or P7 affected the Lα-to-HII phase transition by decreasing its transition temperature (TH), broadening the calorimetric peak and significantly affecting the transition enthalpy (∼12–20% at a lipid-peptide molar ratio of 10:1). P4 and P7 had only minor effects on the Lβ-to-Lα phase transition, although P7 broadened the thermotropic transition without affecting the transition temperature. Similar behaviour to that shown by DEPE:P4 and DEPE:P7 mixtures has been interpreted as due to a peptide aggregation process of in which local clusters of lipid-peptide could be formed Citation[40]. In contrast, P6 affected modestly the Tm and decreased linearly the enthalpy change of both the Lβ-to-Lα and Lα-to-HII phase transitions in a concentration-dependent manner (58% and 67%, respectively, at a lipid-peptide molar ratio of 10:1), reinforcing the idea of a deeper incorporation of P6 into DEPE membranes.
The effects of P4, P6 and P7 peptides on the thermotropic behaviour of DPPC membranes () were also studied. DPPC showed a Lβ‘-to-Pβ‘ pretransition (Tm = 36°C and ΔH = 0.7 Kcal/mol) and a Pβ‘-to-Lα phase transition (Tm = 41.5°C and ΔH = 6.0 Kcal/mol). The three peptides affected the calorimetric properties of DPPC membranes in a comparable way. Increasing concentrations of peptide (45:1, 30:1 and 20:1 lipid-peptide molar ratio) decreased the enthalpy of the main transition, Pβ‘-to-Lα, without affecting its transition temperature, being the effect of P4 higher than those of P6 or P7 (58% for P4 compared to 14–16% for P6 and P7 at lipid-peptide 30:1 molar ratio). Moreover, the peptides decreased the enthalpy of the pretransition, Lβ‘-Pβ‘ (58% for P4 and 25–30% for P6 and P7 at a lipid-peptide 30:1 molar ratio) and slightly affected the transition temperature (less than 1.5°C).
Figure 6. DSC thermograms of DPPC-peptide mixtures. DSC heating curves of DPPC alone and in presence of P4, P6 or P7 peptides at the lipid:peptide molar ratio indicated. DSC runs were performed at a scan rate of 1°C/min. The pre-transition of lipid mixtures is shown on an expanded scale.
Effect of peptides on the structural organization of membranes
Further information on the structural properties of DEPE- and DPPC-peptides mixtures was obtained by X-ray diffraction studies ( and ). The mesomorphic behaviour of DEPE was similar to that described previously Citation[34]. Working in quasi-equilibrium conditions, DEPE-peptide mixtures showed a phase sequence from gel (Lβ) to liquid-crystalline lamellar (Lα) and then to inverted hexagonal (HII) phases as the temperature increased. Comparatively, P7 followed by P4 exerted a high effect on the lamellar phase, inducing the HII phase transition in coexistence with the Lα phase at low temperature. In contrast, P6 did not affect significantly the Lα-to-HII phase transition. The structural parameters for DEPE were scarcely affected by the peptide concentration in the range 20:1 to 5:1 molar ratio (5.5 nm at 40°C and 6.4 nm at 68°C, for Lα and HII phases, respectively). On the other hand, the phase transition (Lβ‘ to Pβ‘ to Lα, ΔT = 37–43°C) of DPPC membranes and its structural properties (d Lβ‘=6.5 nm, d Pβ‘=7.3 nm and dLα=6.8 nm) were hardly altered by the peptides, except for the thermotropic recovery of the bilayer stacking, which was a slow kinetic process. Only P6 peptide slightly reduced the organization of the lamellar stacking of DPPC bilayers.
Figure 7. Linear plots of the X-ray scattering patterns of DEPE-peptide mixtures. Diffraction patterns of DEPE alone and in presence of P4, P6 or P7 at a molar ratio 20:1. The sequence of the patterns was acquired under quasi-equilibrium conditions, after equilibrating the sample during 15 min at each temperature. Successive diffraction patterns were collected during 15 s each minute. Phases identified are Lβ, Lα and HII. The Lβ-to-Lα phase transition was identified by the disappearance of the peak in the WAXS region.
Figure 8. Sequence of X-ray scattering patterns of DPPC-peptide mixtures. Diffraction patterns of DPPC alone and in presence of P6 or P7 at a molar ratio 20:1. The sequence of the patterns was acquired under kinetic conditions with a scan rate of 1°C/min. Successive diffraction patterns were collected for 15 s each minute. Only the heating sequence from 26–50°C is shown.
Discussion
Most of the studies in the field of peptide-lipid interactions studies involving transmembrane protein segments are based on the use of model lipid bilayers and simple synthetic peptides consisting of a variable length hydrophobic stretch of leucine and alanine residues, flanked, respectively, by tryptophane or lysine (WALP or KALP peptides) Citation[17]. In this report, however, we have chosen to use peptides with an amino acid sequence identical to the putative transmembrane segments of the human α2-AR. Our hope is that these more complex peptides would be better templates to understand the behaviour of transmembrane protein segments and underline the importance of interfacial anchoring interactions in defining membrane organization.
Structural features of peptides in the lipid bilayer
P4, P6 and P7 peptides were associated with DEPE and DPPC membranes as can be inferred from the infrared and Trp fluorescence data of the peptides and also by their effects on the properties of those lipids. The three peptides showed a mixture of conformations in both DEPE and DPPC membranes, with a prevalence of β-structure, especially in P4 and P7 peptides. P4 and P7 peptides were synthesized without the Lys residues flanking the putative TM4 and TM7 fragments in the α2-AR. Charged residues found at the flanks of TM helices usually play an important role in determining the topology of membrane proteins Citation[17]. Also, both P4 and P7 peptides have Pro residues, a classical helix-breaker Citation[41], at their C-terminal ends. To estimate the dimensions of P4 and P7, peptides were modelled (sequence between N-terminal up to the first Pro) as if they were standard α-helices and the resulting models were energy minimized. The distance between the Cα atoms of the outermost N- and C-terminal amino acids was estimated as 19.8 and 18.2 Å, for P4 and P7 peptides respectively. Calculations of the hydrophobic thickness of DEPE and DPPC bilayers give values of approximately 26 and 26.3 Å Citation[42], respectively, so both peptides modelled as α-helices came out shorter than the hydrophobic thickness of membrane (negative mismatch) and in this situation peptides should be expected to form macroscopic aggregates, in a similar way to WALP/KALP peptides Citation[43]. Indeed, synthetic peptides with the sequence of putative transmembrane segments of other GPCRs, either formed β-sheets or aggregates Citation[44–46].
In turn, P6 peptide contained the hydrophobic sequence of the putative TM6 segment plus the hydrophilic N-terminal adjacent stretch (REKR sequence). P6 peptide in DEPE membranes displayed an important percentage of α-helix (∼19%), in spite of having also a proline residue in its C-terminus (P-389 in the overall protein sequence), that is expected to introduce a distortion in the helical backbone Citation[41]. Furthermore, the amide II band, near at 1547 cm−1, has been observed only in P6-DEPE samples. These two observations suggest that P6 in DEPE have already a tendency to form highly stable helices, likely to be deeply buried in the hydrophobic core of the membrane Citation[47]. Indeed, the increased α-helical component seen in the infrared spectra when in presence of TFE (30% or higher), confirms the helical tendency of the peptide in the presence of DEPE lipids. Finally, modelling of P6 (only for the sequence NH2-FTFVLAVVIGVFVVCWF) as a standard α-helix, estimate the peptide length as 26.1 Å. Probably, hydrophobic mismatch for this peptide length is not important for DEPE membranes, but insufficient for DPPC membranes, where P6 is aggregated.
Effect of peptides on the phase behaviour of membranes
In addition to the differences in peptide structure as discussed above, P6 peptide interacted with DEPE membranes in a different way than P4 and P7 peptides. The main effect of P6 on the thermodynamic behaviour of DEPE vesicles was a linear decrease in the enthalpy of Lβ-to-Lα and Lα-to-HII phase transitions and a modest change in the Tm, with no significant effect on the cooperativity of the main phase transition. In addition, the X-ray diffraction study confirmed that P6 peptide did not induce the formation of a HII phase. The thermodynamic properties indicated that P6 behaves as a class II integral protein Citation[48] that is expected to interact with the hydrophilic and the hydrophobic regions of the lipid bilayer. The charged flanking residues at the N-terminus of the P6 would be situated around the lipid polar region facilitating the anchorage and electrostatic and hydrogen-bonding interactions with the oxygen atoms of the lipid, in particular with the lipid glycerol oxygens, as concluded from the analysis of the C = O stretching band. Previous studies using model α-helical segments flanked by Lys (KALP peptides) demonstrated specific interactions of this side chain as anchoring residue of transmembrane proteins, besides contributing to avoid peptide aggregation Citation[43], Citation[49], Citation[50].
On the other hand, the estimated length of P4 and P7 peptides is shorter than the hydrophobic thickness of the DEPE bilayer (26 Å). Therefore, they present a negative mismatch with the Lα phase. Under negative mismatch conditions both peptides aggregate (as explained above) but also induce the formation of HII phase below the TH of plain DEPE, as found also for WALP/KALP model peptides Citation[43]. Formation of such non-lamellar phase can be a way to adapt to mismatch. In HII phase short peptides span the distance between adjacent tubes and are surrounded by hydrocarbon tails of membrane lipids more disordered than in a bilayer, having therefore a reduced hydrophobic length. As a consequence, peptide incorporation promotes the HII phase in DEPE by lowering the corresponding phase transition temperature Citation[43].
This study constitutes the first attempt to examine the nature of the interactions between putative transmembrane segments with native sequences belonging to α2-AR and specific lipids. In essence, our findings serve to highlight the role of hydrophobic matching and interfacial anchoring phenomena which, as in the case of P6, appear as key factors to define the peptide arrangement within the lipid bilayer.
Acknowledgements
We thank Dr Oliver Vögler for the critical revision of the manuscript and helpful advices. We thank the reviewers and an Associate Editor for their constructive insights, their help and comments. This work was supported by grants II-05-051EC from Deutsches Elektronen-Synchrotron DESY, Hasylab (Hamburg, Germany) from the IHP-Contract HPRI-CT-2001-00140 of the European Commission, BFU2007-61071/BCM (Ministerio de Educación y Cultura, Spain and BANCAJA-UMH IP/UR/01 and Generalitat Valenciana GV07/017. Declaration of interest: The authors report no conflicts of interest. The authors alone are responsible for the content and writing of the paper.
References
- Wallin E, von Heijne G. Genome-wide analysis of integral membrane proteins from eubacterial, archaean, and eukaryotic organisms. Protein Sci 1998; 7: 1029–1038
- Bylund, DB. 2008. Adrenergic receptor alpha-2A, In. UCSD-Nature Molecule Pages. [serial online], Avalaible: http://www.signaling-gateway.org/. (Accessed July 29 2008).
- O'Rourke MF, Blaxall HS, Iversen LJ, Bylund DB. Characterization of [3H]RX821002 binding to alpha-2 adrenergic receptor subtypes. J Pharmacol Exp Ther 1994; 268: 1362–1367
- Link RE, Desai K, Hein L, Stevens ME, Chruscinski A, Bernstein D, Barsh GS, Kobilka BK. Cardiovascular regulation in mice lacking alpha2-adrenergic receptor subtypes b and c. Science 1996; 273: 803–805
- Filipek S, Teller DC, Palczewski K, Stenkamp R. The crystallographic model of rhodopsin and its use in studies of other G protein-coupled receptors. Annu Rev Biophys Biomol Struct 2003; 32: 375–397
- Schertler GF. Structure of rhodopsin and the metarhodopsin I photointermediate. Curr Opin Struct Biol 2005; 15: 408–415
- Rasmussen SG, Choi HJ, Rosenbaum DM, Kobilka TS, Thian FS, Edwards PC, Burghammer M, Ratnala VR, Sanishvili R, Fischetti RF, Schertler GF, Weis WI, Kobilka BK. Crystal structure of the human beta2 adrenergic G-protein-coupled receptor. Nature 2007; 450: 383–387
- Trabanino RJ, Hall SE, Vaidehi N, Floriano WB, Kam VW, Goddard WA, 3rd. First principles predictions of the structure and function of g-protein-coupled receptors: Validation for bovine rhodopsin. Biophys J 2004; 86: 1904–1921
- Freddolino PL, Kalani MY, Vaidehi N, Floriano WB, Hall SE, Trabanino RJ, Kam VW, Goddard WA, 3rd. Predicted 3D structure for the human beta 2 adrenergic receptor and its binding site for agonists and antagonists. Proc Natl Acad Sci USA 2004; 101: 2736–2741
- Konvicka K, Guarnieri F, Ballesteros JA, Weinstein H. A proposed structure for transmembrane segment 7 of G protein-coupled receptors incorporating an asn-Pro/Asp-Pro motif. Biophys J 1998; 75: 601–611
- Chung DA, Zuiderweg ER, Fowler CB, Soyer OS, Mosberg HI, Neubig RR. NMR structure of the second intracellular loop of the alpha 2A adrenergic receptor: Evidence for a novel cytoplasmic helix. Biochemistry 2002; 41: 3596–3604
- Chung DA, Wade SM, Fowler CB, Woods DD, Abada PB, Mosberg HI, Neubig RR. Mutagenesis and peptide analysis of the DRY motif in the alpha2A adrenergic receptor: Evidence for alternate mechanisms in G protein-coupled receptors. Biochem Biophys Res Commun 2002; 293: 1233–1241
- Jaakola VP, Rehn M, Moeller M, Alexiev U, Goldman A, Turner GJ. G-protein-coupled receptor domain overexpression in Halobacterium salinarum: Long-range transmembrane interactions in heptahelical membrane proteins. Proteins 2005; 60: 412–423
- Gether U, Lin S, Ghanouni P, Ballesteros JA, Weinstein H, Kobilka BK. Agonists induce conformational changes in transmembrane domains III and VI of the beta2 adrenoceptor. Embo J 1997; 16: 6737–6747
- Botelho AV, Gibson NJ, Thurmond RL, Wang Y, Brown MF. Conformational energetics of rhodopsin modulated by nonlamellar-forming lipids. Biochemistry 2002; 41: 6354–6368
- Alves ID, Salgado GF, Salamon Z, Brown MF, Tollin G, Hruby VJ. Phosphatidylethanolamine enhances rhodopsin photoactivation and transducin binding in a solid supported lipid bilayer as determined using plasmon-waveguide resonance spectroscopy. Biophys J 2005; 88: 198–210
- Killian JA, Nyholm TK. Peptides in lipid bilayers: The power of simple models. Curr Opin Struct Biol 2006; 16: 473–479
- Nyholm TK, Ozdirekcan S, Killian JA. How protein transmembrane segments sense the lipid environment. Biochemistry 2007; 46: 1457–1465
- Bystrom T, Strandberg E, Kovacs FA, Cross TA, Lindblom G. Influence of transmembrane peptides on bilayers of phosphatidylcholines with different acyl chain lengths studied by solid-state NMR. Biochim Biophys Acta 2000; 1509: 335–345
- Morein S, Koeppe IR, Lindblom G, de Kruijff B, Killian JA. The effect of peptide/lipid hydrophobic mismatch on the phase behavior of model membranes mimicking the lipid composition in Escherichia coli membranes. Biophys J 2000; 78: 2475–2485
- van der Wel PC, Pott T, Morein S, Greathouse DV, Koeppe RE, 2nd, Killian JA. Tryptophan-anchored transmembrane peptides promote formation of nonlamellar phases in phosphatidylethanolamine model membranes in a mismatch-dependent manner. Biochemistry 2000; 39: 3124–3133
- Liu F, Lewis RN, Hodges RS, McElhaney RN. A differential scanning calorimetric and 31P NMR spectroscopic study of the effect of transmembrane alpha-helical peptides on the lamellar-reversed hexagonal phase transition of phosphatidylethanolamine model membranes. Biochemistry 2001; 40: 760–768
- Zhang YP, Lewis RN, Hodges RS, McElhaney RN. Peptide models of the helical hydrophobic transmembrane segments of membrane proteins: Interactions of acetyl-K2-(LA)12-K2-amide with phosphatidylethanolamine bilayer membranes. Biochemistry 2001; 40: 474–482
- Morein S, Killian JA, Sperotto MM. Characterization of the thermotropic behavior and lateral organization of lipid-peptide mixtures by a combined experimental and theoretical approach: Effects of hydrophobic mismatch and role of flanking residues. Biophys J 2002; 82: 1405–1417
- de Planque MR, Killian JA. Protein-lipid interactions studied with designed transmembrane peptides: Role of hydrophobic matching and interfacial anchoring. Mol Membr Biol 2003; 20: 271–284
- Weiss TM, van der Wel PC, Killian JA, Koeppe RE, 2nd, Huang HW. Hydrophobic mismatch between helices and lipid bilayers. Biophys J 2003; 84: 379–385
- Lewis RN, Zhang YP, Liu F, McElhaney RN. Mechanisms of the interaction of alpha-helical transmembrane peptides with phospholipid bilayers. Bioelectrochemistry 2002; 56: 135–140
- van der Wel PC, Strandberg E, Killian JA, Koeppe RE, 2nd. Geometry and intrinsic tilt of a tryptophan-anchored transmembrane alpha-helix determined by (2)H NMR. Biophys J 2002; 83: 1479–1488
- Strandberg E, Ozdirekcan S, Rijkers DT, van der Wel PC, Koeppe RE, 2nd, Liskamp RM, Killian JA. Tilt angles of transmembrane model peptides in oriented and non-oriented lipid bilayers as determined by 2H solid-state NMR. Biophys J 2004; 86: 3709–3721
- Park SH, Opella SJ. Tilt angle of a trans-membrane helix is determined by hydrophobic mismatch. J Mol Biol 2005; 350: 310–318
- Harroun TA, Heller WT, Weiss TM, Yang L, Huang HW. Theoretical analysis of hydrophobic matching and membrane-mediated interactions in lipid bilayers containing gramicidin. Biophys J 1999; 76: 3176–3185
- Yeagle PL, Bennett M, Lemaitre V, Watts A. Transmembrane helices of membrane proteins may flex to satisfy hydrophobic mismatch. Biochim Biophys Acta 2007; 1768: 530–537
- Fraser CM, Arakawa S, McCombie WR, Venter JC. Cloning, sequence analysis, and permanent expression of a human alpha 2-adrenergic receptor in Chinese hamster ovary cells. Evidence for independent pathways of receptor coupling to adenylate cyclase attenuation and activation. J Biol Chem 1989; 264: 11754–11761
- Barcelo F, Prades J, Encinar JA, Funari SS, Vogler O, Gonzalez-Ros JM, Escriba PV. Interaction of the C-terminal region of the Ggamma protein with model membranes. Biophys J 2007; 93: 2530–2541
- Moffatt DJ, Kaupinnen JK, Cameron DG, Mantsch HH, Jones RN. Computer Programs for Infrared Spectroscopy. InNHCC Bulletined. National Research Council of Canada, OttawaCanada 1986
- Arrondo JL, Muga A, Castresana J, Goni FM. Quantitative studies of the structure of proteins in solution by Fourier-transform infrared spectroscopy. Prog Biophys Mol Biol 1993; 59: 23–56
- Surewicz WK, Mantsch HH, Chapman D. Determination of protein secondary structure by Fourier transform infrared spectroscopy: A critical assessment. Biochemistry 1993; 32: 389–394
- Fabian H, Mantsch HH. Ribonuclease A revisited: Infrared spectroscopic evidence for lack of native-like secondary structures in the thermally denatured state. Biochemistry 1995; 34: 13651–13655
- Lewis RNAH, Mannock DA, McElhaney RN. Membrane lipid, molecular structure and polymorphism. Lipid polymorphism and membrane properties, R Epand. Academic Press, San Diego, California 1997; 25–102
- Aranda FJ, Killian JA, de Kruijff B. Importance of the tryptophans of gramicidin for its lipid structure modulating activity in lysophosphatidylcholine and phosphatidylethanolamine model membranes. A comparative study employing gramicidin analogs and a synthetic alpha-helical hydrophobic polypeptide. Biochim Biophys Acta 1987; 901: 217–228
- Chou PY, Fasman GD. Empirical predictions of protein conformation. Annu Rev Biochem 1978; 47: 251–276
- Killian JA, Salemink I, de Planque MR, Lindblom G, Koeppe RE, 2nd, Greathouse DV. Induction of nonbilayer structures in diacylphosphatidylcholine model membranes by transmembrane alpha-helical peptides: Importance of hydrophobic mismatch and proposed role of tryptophans. Biochemistry 1996; 35: 1037–1045
- Killian JA. Synthetic peptides as models for intrinsic membrane proteins. FEBS Lett 2003; 555: 134–138
- Hunt JF, Earnest TN, Bousche O, Kalghatgi K, Reilly K, Horvath C, Rothschild KJ, Engelman DM. A biophysical study of integral membrane protein folding. Biochemistry 1997; 36: 15156–15176
- Xie H, Ding FX, Schreiber D, Eng G, Liu SF, Arshava B, Arevalo E, Becker JM, Naider F. Synthesis and biophysical analysis of transmembrane domains of a Saccharomyces cerevisiae G protein-coupled receptor. Biochemistry 2000; 39: 15462–15474
- Lazarova T, Brewin KA, Stoeber K, Robinson CR. Characterization of peptides corresponding to the seven transmembrane domains of human adenosine A2a receptor. Biochemistry 2004; 43: 12945–12954
- Zhang YP, Lewis RN, Hodges RS, McElhaney RN. FTIR spectroscopic studies of the conformation and amide hydrogen exchange of a peptide model of the hydrophobic transmembrane alpha-helices of membrane proteins. Biochemistry 1992; 31: 11572–11578
- Papahadjopoulos D, Moscarello M, Eylar EH, Isac T. Effects of proteins on thermotropic phase transitions of phospholipid membranes. Biochim Biophys Acta 1975; 401: 317–335
- Kandasamy SK, Larson RG. Molecular dynamics simulations of model trans-membrane peptides in lipid bilayers: A systematic investigation of hydrophobic mismatch. Biophys J 2006; 90: 2326–2343
- de Planque MR, Kruijtzer JA, Liskamp RM, Marsh D, Greathouse DV, Koeppe RE, 2nd, de Kruijff B, Killian JA. Different membrane anchoring positions of tryptophan and lysine in synthetic transmembrane alpha-helical peptides. J Biol Chem 1999; 274: 20839–20846