Abstract
P2X receptor function in the CNS is poorly understood, and currently available data are partly inconsistent. In the presented study, we investigated P2X3 receptors stably expressed in HEK293 cells. Non-stationary noise analysis of whole cell currents and rapid ATP application through flash photolysis allowed for assessing the single channel conductance (6.6 pS) and the fast activation kinetics of the receptor (20 ms). The characteristics of channel desensitization and pharmacological properties matched previous findings. The properties of wild type receptors were compared with P2X3 constructs carrying a fluorescent tag (ECFP or DsRed2) at the C-terminus. These fluorescently labeled subunits formed functional receptors, with neither the affinity of the ligand binding site nor channel properties (ion selectivity, gating kinetics, single channel conductance) differing from wild type. We conclude that both fusion proteins tested here are suitable for generating transgenic mice, which can be expected to promote understanding of the physiological role of P2X3 receptors in CNS signaling.
| Acronyms | ||
| human embryonic kidney cell line 293 | = | HEK293 |
| enhanced cyan fluorescent protein | = | ECFP |
| (enhancend) green fluorescent protein | = | (E)GFP |
| Discosoma sp. red fluorescent protein | = | DsRed2 |
| wild type | = | wt |
| untranslated region | = | UTR |
| neomycine phosphotransferase gene expression cassette | = | neo |
| coding sequence | = | CDS |
| adenosine 5′-triphosphate, P3-(1-(4,5-dimethoxy-2-nitrophenyl)ethyl) ester | = | DMNPE-caged ATP |
Introduction
P2X receptors belong to the superfamily of ligand gated ionotropic receptors. In contrast to many other direct ligand gated receptors, functional P2X receptors probably assemble as trimers formed from subunits with two transmembrane domains and intracellular N- and C-termini (Aschrafi et al. [Citation2004]; Nicke et al. [Citation1998]). Activated at very low ATP concentrations (Rettinger & Schmalzing [Citation2003]) they open nonspecific cationic channels, causing cell depolarization and increase in intracellular calcium ion concentration. These characteristics led to the general opinion that in the CNS, P2X receptors modulate synaptic transmission (reviewed by Robertson et al. [Citation2001]). However, in contrast to the relatively detailed knowledge of P2X receptor functions in the peripheral nervous system (Dunn et al. [Citation2001]), analysis of central neurons proved to be difficult. For example, inconsistent information is available about functional expression of P2X receptors in neurons of the hippocampus (Khakh et al. [Citation1999]; Khakh et al. [Citation2003]; Armstrong et al. [Citation2002]; Sim et al. [Citation2004]; Kukley et al. [Citation2004]). Moreover, although immunostaining indicated abundant expression of P2X receptors in glial cells of this brain area (Kukley et al. [Citation2001]), patch clamp analyses have so far failed to identify P2X receptor-mediated responses (Jabs et al. [Citation1997]; Kettenmann & Steinhäuser [Citation2005]). Difficulties in analyzing these receptors arise from their fast gating kinetics and very slow recovery from inactivation. The low specificity of currently available P2X antibodies and the lack of selective agonists or antagonists cause additional problems hampering functional studies of P2X receptors. To overcome some of these problems, generation of transgenic mice with fluorescently tagged P2X receptors might be useful. Such a mouse line would not only facilitate investigation of tissue distribution and developmental aspects of P2X receptor expression, but also electrophysiology and functional imaging would profit from the possibility to identify receptor-bearing cells online in living brain slices. The feasibility of this approach, however, rests on the functional integrity of the tagged receptor. In addition, red chromophores may be functional only as oligomeres, thus potentially limiting their usefulness for in vivo imaging studies (Sacchetti et al. [Citation2002]). Therefore, we employed ectopic expression in human embryonic kidney 293 cells (HEK293) of P2X3 receptors, labeled by tagging enhanced cyan fluorescent protein (ECFP) from the jellyfish Acquorea victorea or red fluorescent protein from Discosoma sp. reef coral (DsRed2) to the C-terminus. Previous work has indicated a close relationship between structural elements and physiological properties of ionotropic purinoceptors (Fabbretti et al. [Citation2004]; Zemkova et al. [Citation2004]). Specifically, desensitization of P2X receptors was shown to depend on the coupling between the C-terminal and ecto-domains (He et al. [Citation2002]; He et al. [Citation2003]). Furthermore, mutant studies suggested a role of the C-terminus for receptor trafficking (Chaumont et al. [Citation2004]). Since intracellular receptor domains also regulate channel gating and ionic permeation (Vial et al. [Citation2004]), C-terminal fusion of fluorescent proteins might confer artificial properties to the receptor complex. Functional fluorescent fusion proteins have been described for P2X1-GFP (Dutton et al. [Citation2000]), P2X2-GFP (Khakh et al. [Citation2001]; Chaumont et al. [Citation2004]), P2X4-GFP (Bobanovic et al. [Citation2002]), and P2X7-EGFP (Smart et al. [Citation2002]). Here, we determined critical pharmacological and biophysical properties of homomeric P2X3 receptors and tested whether tagging with two different types of fluorescent proteins affects receptor function. Non-stationary noise analysis of whole cell currents for the first time allowed us to assess the single channel conductance of the receptor. Moreover, flash photolysis of caged ATP was employed to assure rapid and synchronized drug delivery onto the whole cell surface, a prerequisite to quantitatively determine the fast kinetics of P2X3 receptor activation. Comparative analyses were performed with wild type (wt) receptors and ECFP- or DsRed2-tagged P2X3 constructs to investigate the affinity of the ligand binding site, as well as ion selectivity, activation, deactivation, desensitization and single channel conductance of the receptor pore. None of the parameters was modified in fluorescent receptors, suggesting that the tested fusion proteins are suitable for in vivo labeling of P2X3 receptors.
Materials and methods
Construction of recombinant plasmids
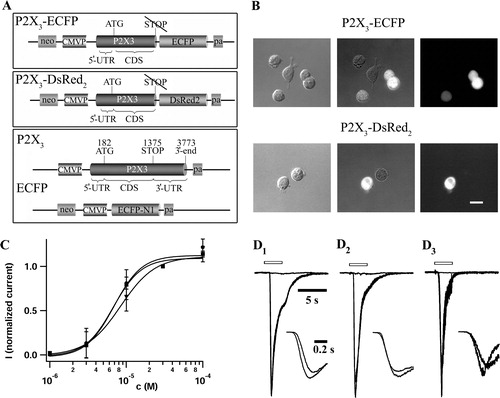
Rat P2X3 cDNA was a courtesy of C. Cheng (National Institute of Mental Health, Bethesda, USA). The pECFP-N1 and pDsRed2-N1 plasmids were purchased from BD Biosciences Clontech (Heidelberg, Germany). The generation and structure of derivative plasmids used in our experiments is described below (see also A).
Figure 1. C-terminal fusion of fluorescent proteins does not change the potency and the TNP-ATP induced inhibition of αβ-meATP mediated P2X3 receptor currents. (A) Recombinant plasmids used for the generation of transformant HEK293 cells. Upper panel: pP2X3-ECFP was constructed by an in-frame fusion of the ECFP gene with the P2X3 gene. The STOP codon and the entire downstream DNA region of the P2X3 gene has been deleted. Middle panel: pP2X3-DsRed2 was generated similarly, fusing the DsRed2 gene with P2X3 retaining the same reading frame. The STOP codon and downstream sequences of the P2X3 gene have also been eliminated in this construct. Lower panel: For the construction of HEK293 cells expressing separate P2X3 and ECFP genes, we used two transfer plasmids, pP2X3 and pECFP-N1. pP2X3 was generated by equipping the full-length P2X3 cDNA sequence with the constitutive human cytomegalovirus immediate early 1 promoter/enhancer, transcription termination and polyadenylation sequences (pa). (B) Micrographs of fluorescent fusion protein bearing HEK293 cells. Depicted are bright field (left panel) and fluorescence (right panel) pictures of P2X3-ECFP (upper part) or P2X3-DsRed2 (lower part) expressing cells. The superimposed images (middle panel) allow us to discriminate between fusion protein expressing and non-transformant HEK293 cells, with the latter serving as a negative control. The fluorescence pictures were taken with a FITC filter combination (B-2A, Nikon) for ECFP, and a TRITC filter combination (Nikon) for DsRed2 constructs. The scale bar represents 20 µm. (C) Unchanged potency of αβ-meATP at P2X3-DsRed2 and P2X3-ECFP receptors. Concentration–response relationships were measured for HEK293 cells expressing wt-P2X3 (circles), P2X3-DsRed2 (squares), and P2X3-ECFP (triangles) constructs. Increasing concentrations of αβ-meATP (1, 3, 10, 30, 100 µM) were applied successively through pressure application. Peak amplitudes of resulting whole cell currents (Vhold= − 80 mV) were normalized to the corresponding 30 µM response, averaged (n=7–10 for each construct), and plotted against the logarithm of agonist concentration. Applications to individual cells were separated by 6 min intervals. Symbols represent mean and SD. EC50 values and Hill coefficients were determined by fitting the data to a Hill equation; the parameters of the three receptor constructs were not different (). (D) Inhibition of αβ-meATP mediated receptor currents by TNP-ATP. Application of TNP-ATP (1 µM, 6 sec pre-application) to wt-P2X3 (D1), P2X3-ECFP (D2), and P2X3-DsRed2 (D3) in HEK293 cells reversibly inhibited receptor currents evoked by αβ-meATP (10 µM, 3 sec) (Vhold= − 80 mV). Typical responses before, during, and after washout of the antagonist are illustrated for each construct. Control currents of the three constructs were scaled to the wt-P2X3 response. Open bars indicate application of the agonist or the agonist/antagonist cocktail, respectively. The insets show control and recovery traces with higher time resolution. After washout, wt-P2X3 responses displayed recovery to 114%, while currents through P2X3-ECFP and P2X3-DsRed2 recovered to 86 and 81%, respectively. Inhibition by TNP-ATP was almost complete in all three cases.
The pP2X3 plasmid was constructed by placing the P2X3 cDNA under the control of human cytomegalovirus immediate early 1 promoter. Simian virus 40 transcription termination sequences and polyadenylation signal served as downstream regulatory elements of P2X3 gene. The expression cassette was subcloned to the EcoRI – XhoI restriction endonuclease recognition sites of the pUC18 vector generating pP2X3.
The pP2X3Δ plasmid was constructed by PCR amplification of a segment of the P2X3 cDNA containing the entire 5′-UTR (untranslated region) and coding sequence, but lacking the STOP codon and the rest 3′-UTR sequences. The forward PCR primer contained a HindIII linker sequence and the reverse primer contained a SalI linker tag for the easy subcloning and maintaining the correct reading frame of the P2X3 gene. The PCR fragment was first subcloned to PCRII-TOPO plasmid (Invitrogen, Karlsruhe, Germany) generating pP2X3Δ. The pP2X3-ECFP plasmid was generated by subcloning the HindIII-SalI fragment of pP2X3Δ containing the P2X3 gene to the same recognition sites of pECFP-N1. The pP2X3-DsRed2 was generated by subcloning the EcoRI fragment of pP2X3Δ containing the P2X3 gene to the EcoRI site of pDsRed2-N1. The correct nucleotide sequences of all constructs were confirmed by DNA sequencing.
Construction of transformant cell lines
HEK293 (Europ. Collection of Cell Cultures, Porton Down, UK) cell lines were transfected with the linearized recombinant plasmids containing chimeric P2X3-fluorescent protein genes by using cationic lipid Lipofectamine2000 (Invitrogen). Transformant cells were selected by geneticin (G418, 0.8 mg/ml, Sigma). For the construction of transformant cells separately expressing P2X3 and ECFP genes (i.e., in a non-fused form), plasmids pP2X3 and pECFP-N1 were co-transfected to HEK293. G418 resistant cells were further screened for fluorescence of ECFP protein by a fluorescent microscope (Axiovert 135, Zeiss, Jena, Germany). Electrophysiological recording of P2X3 currents further confirmed the insertion event. The expression of P2X3 receptor in the transformed cells was confirmed by immunohistochemical analysis. For the detection of P2X3 expression, a rabbit anti-P2X3 antibody (dilution 1:100; Oncogene, Merck Bioscience GmbH, Bad Soden, Germany) was used as a primary antibody and goat anti-rabbit antibody conjugated with either a fluorescent green (Alexa Fluor 488) or a red dye (Alexa Fluor 594), (both at a 1:1000 dilution; Molecular Probes, Leiden, The Netherlands) as secondary antibodies.
For fusion we used two common fluorescent proteins, ECFP and DsRed2, descending from two different species, the jellyfish aquorea victorea and the anemone discosoma sp., respectively. The non-fusion construct was used for assessment of control conditions.
Cell culture
HEK293 cells were cultured in 60-mm plastic dishes (Falcon, Becton Dickinson Labware, Franklin Lakes, NY, USA) at 37°C and 5% CO2 in humified air. The culture medium was Dulbecco′s Modified Eagle's Medium supplemented with 6 ml/l Penicillin/Streptomycin, 10% fetal bovine serum and 200 µg/ml geneticin (Invitrogen). Cells were split when grown to approx. 80% confluency. For electrophysiological recording, cells were plated on 12-mm glass coverslips coated with poly-D-lysine (Sigma, Taufkirchen, Germany). Recordings were carried out within 24–48 h following cell splitting.
Electrophysiology
For electrophysiology, coverslips were transferred to a recording chamber perfused with oxygenated bath solution (pH 7.38) consisting of (in mM): 150 NaCl, 5 KCl, 2 MgSO4, 2 CaCl2, 10 glucose, 10 Hepes. Patch pipettes (3–5 MΩ) were pulled from borosilicate capillaries (Hilgenberg, Malsfeld, Germany) using a pp830 micropipette puller (Narishige, Tokyo, Japan) and filled with internal solution (pH 7.25) of the following composition (in mM): 130 KCl, 2 MgCl2, 0.5 CaCl2, 5 BAPTA, 10 Hepes, 3 Na2ATP. Fluorescent HEK293 cells were selected using microscopes equipped with epi-fluorescence and infrared differential interference contrast illumination (Axioskop 2 FS, Zeiss; or Eclipse E600 FN, Nikon Europe B.V., Badhoevedorp, The Netherlands). Micrographs of HEK293 cells have been taken with a 8-bit gray scale camera (VX45, Optronis GmbH, Kehl, Germany). Whole cell currents were recorded (EPC7 or EPC8, Tida5.05 software, HEKA, Lambrecht, Germany) at room temperature (20–22°C), filtered at 3 or 10 kHz and sampled at 6 or 30 kHz. Holding potential was −80 mV unless otherwise stated. Data were analyzed with IgorPro 5.03 Software (Wavemetrics, Lake Oswego, USA). ATP, αβ-meATP, BzATP (Sigma), and TNP-ATP (Biotrend Chemikalien GmbH, Cologne, Germany) were pressure-applied using a multichannel DAD12 superfusion system (Adams and List, Westbury, NY, USA). Control application of bath solution via a wash channel always preceded (5 sec) and followed (5 sec) drug application to exclude pressure artifacts. In the case of receptor blocking experiments, short KCl pulses (50 mM, 1 sec) were used as a positive control of drug application. Quantitative analysis of receptor activation was performed employing the flash photolysis technique. ATP caged in P3-(1-(4,5-dimethoxy-2-nitrophenyl)ethyl) ester (DMNPE-caged-ATP) (100 µM, Molecular Probes) was liberated by a Xenon flash-lamp system (JML-C2; Rapp OptoElectronic, Hamburg, Germany). As recommended, apyrase 3.6.1.5 (0.2 units/ml, Sigma) was added to minimize the content of free ATP present in diluted caged ATP. The flash light guiding optical fiber was positioned about 1 mm in front of the patch pipette. Final adjustment was achieved through continuous illumination of the fiber with a red laser diode. Flash energy was adjusted to about 45 J.
Data analysis
Data are given as mean±standard deviation (SD). Significance differences were evaluated with Student's t-test (p ≤ 0.05). Self customized macro procedures (Igor 5.03) were used for non-stationary noise analysis, calculation of current reversal potentials, determination of cell capacitance, input and series resistance, and offline compensation for voltage clamp error and data fitting. Concentration-response curves were fitted according to a Hill equation:with Imax and Ioffset being maximum and non-specific offset current, c the agonist oncentration, EC50 the response at half maximal agonist concentration, and n the Hill coefficient. Non-stationary noise analysis was performed by dividing amplitude-over-time traces into equidistant time intervals of 16.8 ms, corresponding to 100 data points per interval. Linear regression was performed for each interval separately and the fitted linear curve was subtracted from the original current traces. The resulting curve was used for calculation of the variance so that each time interval delivered a variance level and a mean amplitude. Variance/amplitude pairs were sorted by amplitudes and plotted. If the current is caused by a superposition of opening and closing receptors with only one conductance level, this plot should result in a parabolic function described by
with isc being the single channel current, I the mean current, and n the number of channels. For small currents and many channels, this function is linear and the slope of the variance/mean current plot represents isc. Single channel conductance was calculated from isc at holding potential.
Results
Concentration–response analysis of P2X3 receptor constructs
In all P2X3-expressing HEK293 cells tested, ATP, αβ-meATP, and BzATP at sub-millimolar concentrations evoked rapidly rising and desensitizing inward currents (holding potential −80 mV). In contrast, non-transfected HEK293 cells failed to respond to any of the three substances. Since extracellular ATP in HEK293 cells is known to mediate effects besides the activation of P2X receptors (e.g., Fischer et al. [Citation2003]) and because ATP also produced slower recovery from desensitization than αβ-meATP, a selective P2X1,3 agonist (Sokolova et al. [Citation2004]), the latter we have chosen for further electrophysiological receptor characterization. P2X3 receptors are characterized by an exceptionally slow recovery from desensitization (Cook & McCleskey [Citation1997]). Since functional analysis usually required repeated application of agonists to individual cells, at first we determined the minimal interval necessary between two test pulses to avoid receptor desensitization. Intervals of at least 6 min ensured generating 6 to 10 reproducible responses to αβ-meATP (30 µM, 2 sec duration) at individual cells (amplitude fluctuation < 15%, n=4, data not shown). We noted that in most cells the first application did not induce the highest amplitude. In the following experiments, successive application to individual cells was always separated by 6 min intervals.
The potency of αβ-meATP at non-fused P2X3, P2X3-ECFP, and P2X3-DsRed2 containing receptors was assessed through concentration-response analysis (C). Four to five agonist concentrations were applied to individual cells. To account for variable cell size and receptor expression level, peak current amplitudes were normalized to the corresponding 30 µM value in each cell. Scatterplots of the respective construct were fitted according to the Hill equation. Figure 1C illustrates the similarity of concentration-response relations of the fusion constructs and wt-P2X3 receptors. Neither half maximal effective concentrations (EC50∼8 µM) nor Hill coefficients (n∼2) of the two constructs differed from the respective parameters of the wt receptor (cf. ).
Table I. Properties of P2X3 receptor constructs.
Receptor inhibition and determination of reversal potentials
Binding of αβ-meATP (10 µM, 3 sec) could be inhibited by the P2X1,3-specific antagonist, TNP-ATP (1 µM). The competitive antagonist was pre-applied for 6 sec and successively co-applied with the agonist for an additional 3 sec. As displayed in D, this caused an almost complete block of the receptor currents, with inhibition being reversible after antagonist washout. The parameters of receptor inhibition did not differ among the three P2X3 constructs tested (see ).
To examine whether the fluorescent protein fused to the C-terminus affects the ion selectivity of the P2X3 receptor pore, the reversal potential of receptor currents was determined. The fast receptor kinetics made it difficult to run a voltage ramp exactly at the time of maximal receptor conductance. On the other hand, the slow recovery from inactivation excluded the possibility to measure reversal potentials iteratively, by sweeping in the voltage clamp mode with varying holding potentials. Considering these limitations, two approaches were used to estimate zero current potentials.
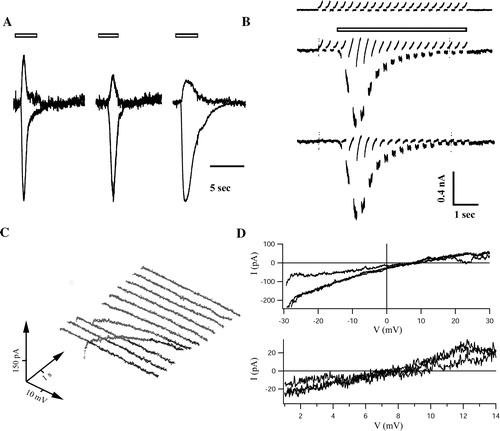
Firstly, αβ-meATP (30 µM, 3 sec) was applied while holding the cell at −20 and +20 mV, and reversal potential was determined from interpolation of peak currents assuming a linear I/V relationship (A). Secondly, during application short voltage ramps from −30 to +30 mV (duration of 200 ms) were applied every 350 ms (B) and I/V curves were constructed after subtraction of background currents. An exemplary plot is illustrated in C. The reversal potential was then determined from the I/V curve with the highest slope conductance (D). Both methods yielded similar reversal potentials of about +7 mV, which closely matched the equilibrium potential calculated according to the Goldman–Hodgkin–Katz voltage equation (+3.1 mV). The reversal potentials of the three receptor variants were not different ().
Figure 2. Analysis of reversal potentials of currents through P2X3 receptor constructs. (A) Pressure application of αβ-meATP (30 µM, 3 sec, open bars) induced receptor currents in HEK293 cells expressing wt-P2X3 (left), P2X3-ECFP (middle) and P2X3-DsRed2 (right). Responses were successively elicited at −20 and +20 mV (6 min intervals) and scaled to the −20 mV trace of the wt construct. The reversal potentials, determined by linear interpolation of peak currents obtained at −20 and the +20 mV, amounted to 3.6, 8.3, and 4.6 mV for wt-P2X3, P2X3-ECFP, and P2X3-DsRed2, respectively. (B) Voltage ramps (−30 to +30 mV, duration 200 ms, every 350 ms for 7 sec, Vhold= − 80 mV) were applied to a cell expressing P2X3-DsRed2. The upper panel illustrates a control recording (no agonist), the middle trace the response (Imax=943 pA) to pressure application of αβ-meATP (30 µM, 3 sec, indicated by the bar). Receptor currents were isolated subtracting the control trace from the response (bottom). Note that the slope of the ramps became steeper during receptor activation. This cell had a reversal potential of 7.1 mV. (C) Current voltage curves were plotted over time (waterfall plot; time runs from front to the back (0–7 sec), voltage from left to right (−30 to +30 mV) and current bottom-up. (D) Typical I/V curves, obtained at maximal receptor conductance, are given for each construct. The lower panel shows the reversal potentials at higher magnification. Currents reversed at 7.6, 7.5, and 7.1 mV for wt-P2X3, P2X3-ECFP, and P2X3-DsRed2, respectively.
Analysis of gating properties
Next we set out to compare the gating properties of the receptor constructs, because activation and desensitization kinetics critically determine receptor physiology. The expected time constant of receptor activation was in the range of a few milliseconds. Open pipette experiments were performed to reveal the speed of the DAD12 drug delivery system. Under our conditions, a 20–80% solution exchange was achieved between 30 and 80 ms (data not shown), which was too slow for quantitative analysis of P2X3 receptor activation. Therefore, flash photolysis of caged ATP was employed to assure fast and synchronized drug delivery over the whole surface of the receptor-bearing HEK293 cells.
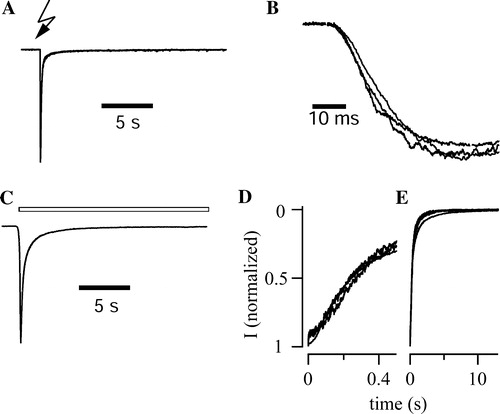
A shows a typical receptor current elicited by UV flash-triggered ATP liberation from DMNPE-caged-ATP (100 µM). The wt-P2X3 and the two P2X3 fusion protein-containing receptor variants did not differ in their 20–80% rise times, which were about 20 ms (B, ). The corresponding current decay was approximated by a bi-exponential data fit, yielding time constants of 131±47 ms (84%) and 1.6±1 sec for wt-P2X3 receptors (n=8), 96±20 ms (90%) and 1.1±0.3 sec for P2X3-DsRed2 receptors (n=6), 150±66 ms (81%) and 1.3±0.5 sec for P2X3-ECFP receptors (n=4). The speed of ATP clearance after UV-flash liberation is determined by (i) diffusion from the previously illuminated spot, and (ii) the speed of ATP degradation through the activity of the apyrase added (see Materials and methods). Because we have only limited information about the dynamic changes of the transmitter concentration under these conditions, receptor desensitization was assessed in the permanent presence of the agonist, αβ-meATP (30 µM), using pressure application (C). Receptor desensitization was well fitted by a bi-exponential function. About 80% of the currents declined with a fast time constant of about 250 ms (D) while the remaining 20% followed a slower time constants of about 1.5 sec (E; fit interval 20 sec). All three receptor constructs displayed similar time constants ().
Figure 3. Gating properties of P2X3 receptor constructs. (A) UV flash liberation of ATP from DMNPE-caged-ATP (100 µM) elicited fast inward currents in a cell expressing P2X3-DsRed2. The trace represents the mean of normalized responses recorded from 6 cells. (B) The rising phase of normalized, averaged UV-flash induced currents is given for wt-P2X3 (n=8), P2X3-ECFP (n=4), and P2X3-DsRed2 (n=6) with higher time resolution. Traces were superimposed to facilitate comparison of activation kinetics. (C) Pressure application of αβ-meATP (30 µM, 20 sec, open bars) elicited inactivating inward currents in a cell expressing P2X3-DsRed2. The trace represents the mean of normalized responses recorded from 7 cells. (D,E) To visualize fast and slow components of receptor desensitization, normalized mean currents are shown at different time scaling. Superposition of wt-P2X3 (n=6), P2X3-ECFP (n=5), and P2X3-DsRed2 (n=7) responses revealed that the currents declined by almost 80% within the first 500 ms (D). Neither the fast nor the slow component of desensitization (E) differed among the three P2X3 constructs.
Single channel analysis
Non-stationary noise analysis of whole cell currents (Heinemann [Citation1995]) was performed to estimate the single channel conductance of P2X3 receptors (for details see Materials and methods). It was assumed that the amplitude fluctuations of receptor-mediated currents were caused by opening and closing of receptor channels with one dominating conductance. illustrates the principal procedure.
Figure 4. Single channel analysis through non-stationary noise analysis. (A) Pressure application of αβ-meATP (30 µM, 20 sec, lower panel) elicited inward currents in a cell expressing P2X3-DsRed2 (Vhold= − 80 mV). The current trace was sectioned into 16.8 ms intercepts, corresponding to 100 data points. Variances and mean amplitudes were calculated for each interval, and variances were plotted against time (upper panel). (B) Linearization of the current trace was achieved by subtracting the linear fit (continuous lines) from the original trace (scatterplot) for each intercept. Exemplarily shown is a 100 ms segment of the trace, indicated by the arrow in (A). (C) Background and receptor-mediated current noise is visible after linearization (lower panel). Variances (upper panel) were calculated for each intercept. (D) Pairs of mean currents taken from (A) and corresponding variances obtained from (C) were sorted by amplitudes and plotted. The single channel conductance (7.65 pS) was estimated as the initial slope, determined by linear regression (continuous line) of the scatterplot.
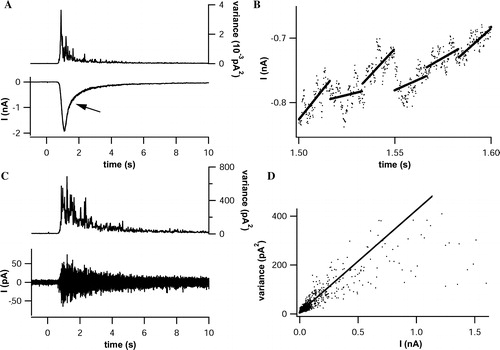
We controlled the consistency of the calculated conductance against small variations in (i) the length of the time window chosen (B), and (ii) the number of data points used for fitting the initial slope of the mean current-variance plot (D). Stable results were obtained for (i) time window intervals between 3.34 and 33.4 ms, corresponding to 20–200 current–time data pairs, and (ii) using a range of 0 to 100–250 pA for the fit, representing 60 to 90% of all data points of the mean current-variance plot. For further comparative noise analysis, we used time intervals of 16.7 ms (corresponding to 100 points) and a range of 0–150 pA for fitting the initial slope. The calculated single channel conductance ranged between 5 and 7 pS, and there was no significant difference between wt-P2X3 receptors and the fusion-protein receptor constructs ().
Discussion
In the present study, we analyzed biophysical properties of a wild type and two fusion variants of P2X3 receptors. Our aim was to determine properties of homomeric P2X3 receptors, and ascertain whether fusion of a fluorescent tag to the C-terminus of the receptor affects its function. By comparing receptors tagged with different fluorescent proteins, we wanted to evaluate whether this approach may have a general utility for in vivo imaging of P2X receptors. To test for proper receptor functioning, we investigated properties of the agonist binding site, ion selectivity of the channel pore, and the kinetics of the receptor gating. Tagged P2X3 constructs were compared with wt-P2X3 receptors expressed in the same cell culture system while keeping boundary conditions as constant as possible to improve reliability of the analysis. Our data indicate that the fluorescent tags do not alter the electrophysiological properties of P2X3 receptors. Knowledge of P2X3 functioning was extended by employing non-stationary noise analysis and rapid ATP application through flash photolysis to determine single channel conductance and activation kinetics of the receptor.
Previous work reported that the C-terminal region influences trafficking, cell surface expression and internalization of P2X receptors (Bobanovic et al. [Citation2002]; Chaumont et al. [Citation2004]). We show here that insertion of ECFP or DsRed2 into the C-terminus of recombinant P2X3 subunits does not hamper assembling and membrane expression of functional P2X3 receptors in HEK293 cells. Also, the receptor binding site appeared unaffected by the protein fusion, since no differences were observed in the action of the competitive antagonist, TNP-ATP (Thomas et al. [Citation1998]) or agonists, such as ATP, αβ-meATP and BzATP (Bianchi et al. [Citation1999]; Zemkova et al. [Citation2004]). The EC50 of αβ-meATP was in the same range as previously reported for ectopically expressed P2X3 receptors (e.g., Bianchi et al. [Citation1999]; Lachnit et al. [Citation2000]; Fabbretti et al. [Citation2004]). Two to three agonist binding sites were suggested for P2X receptors (Bean [Citation1990]). For all three P2X3 receptor constructs tested in our expression system, concentration–response analysis revealed Hill coefficients > 1, indicating positive cooperativity in binding and more than one binding site for αβ-meATP. In the case of P2X3 receptors, binding stoichiometry is still unclear, and published Hill coefficients varied from 1.1 to 1.6 (e.g., Fabbretti et al. [Citation2004]; Koshimizu et al. [Citation2002]). Our data suggest that C-terminal fusion does not alter P2X3 receptor binding characteristics.
The ion selectivity of the P2X3 receptor pore was assessed by determining the potential of current reversal. Since there were no significant differences among the three constructs, our data indicate that the C-terminal fusion did not influence receptor permeability and ion selectivity.
The biphasic inactivation kinetics and the slow recovery from desensitization of all three P2X3 receptor constructs were comparable to findings of rP2X3 receptors expressed in HEK293 cells (Fabbretti et al. [Citation2004]), ROS cells, and native dorsal root ganglion cells (Sokolova et al. [Citation2004]). Since receptor activation, assessed by ultra fast UV-flash triggered ATP uncaging, was also similar, we conclude that the fluorescence tag did not modify receptor gating. This result was not predictable, because recent studies described a close relationship between C-terminal structure and gating characteristics of P2X3 receptor channels (Koshimizu et al. [Citation2002]; Vial et al. [Citation2004]). So far, the single channel conductance of homomeric P2X3 receptors has been unknown. Using noise analysis, we determined a conductance of 6.6 pS for wt-P2X3 receptors. This value fits well with data from bull frog sensory neurons which express the P2X3 subunit. Bean et al. ([Citation1990]) inferred unitary currents from whole cell and outside-out patch recordings, yielding single channel conductances of 7.4 and 5 pS, respectively. Due to the rapid activation and desensitization of P2X3 receptors, we had to use a non-stationary approach to determine unitary channel activity. The single channel conductance of the two fluorescent constructs did not differ from the wt receptor ().
Taken together, there is no evidence of significant alterations in physiological function of rP2X3 receptors after C-terminal fusion of ECFP or DsRed2. Importantly, both fluorescent tags functioned equally well, thus indicating that the P2X3 receptor can be fused to different chromophores without altering its physiological properties. We presume that this molecular labeling can be extended to other P2X receptor subtypes, especially to those, which have been described to function with GFP as fusion partner (Dutton et al. [Citation2000]; Bobanovic et al. [Citation2002]; Khakh et al. [Citation2001]; Smart et al. [Citation2002]). Thus, genetic tagging of P2X receptors with different chromophores in transgenic mice may provide a powerful tool for the analysis of homo- and heterodimerization in vivo, for ontogenetic expression studies, functional imaging, and electrophysiological recordings. Online detection of living P2X3 receptor-expressing cells in acute preparations can be expected to boost understanding of the physiological role this receptor subtype plays in CNS signaling.
The authors wish to thank Dr Dirk Dietrich for fruitful discussions and lending UV flash equipment. They gratefully acknowledge the excellent technical assistance of Anne Zimmer, Angela Harmeth, Julia Essig, and Ingrid Krahner.
This work was supported by grants of the Deutsche Forschungsgemeinschaft (JA942/1 JA942/2, BONFOR O-126.0031, SFB-TR3, FOR 427), and Fonds der Chemischen Industrie (grant to C.S.).
References
- Armstrong JN, Brust TB, Lewis RG, MacVicar BA. Activation of presynaptic P2X7-like receptors depresses mossy fiber-CA3 synaptic transmission through P38 mitogen-activated protein kinase. J Neurosci 2002; 22: 5938–5945
- Aschrafi A, Sadtler S, Niculescu C, Rettinger J, Schmalzing G. Trimeric architecture of homomeric P2X2 and heteromeric P2X1 + 2 receptor subtypes. J Mol Biol 2004; 342: 333–343
- Bean BP. ATP-activated channels in rat and bullfrog sensory neurons: Concentration dependence and kinetics. J Neurosci 1990; 10: 1–10
- Bean BP, Williams CA, Ceelen PW. ATP-activated channels in rat and bullfrog sensory neurons: Current–voltage relation and single-channel behavior. J Neurosci 1990; 10: 11–19
- Bianchi BR, Lynch KJ, Touma E, Niforatos W, Burgard EC, Alexander KM, Park HS, Yu HX, Metzger R, Kowaluk E, Jarvis MF, Van Biesen T. Pharmacological characterization of recombinant human and rat P2X receptor subtypes. Eur J Pharmacol 1999; 376: 127–138
- Bobanovic LK, Royle SJ, Murrell-Lagnado RD. P2X receptor trafficking in neurons is subunit specific. J Neurosci 2002; 22: 4814–4824
- Chaumont S, Jiang LH, Penna A, North RA, Rassendren F. Identification of a trafficking motif involved in the stabilization and polarization of P2X receptors. J Biol Chem 2004; 279: 29628–29638
- Cook SP, McCleskey EW. Desensitization, recovery and Ca2 + -dependent modulation of ATP-gated P2X receptors in nociceptors. Neuropharmacology 1997; 36: 1303–1308
- Dunn PM, Zhong Y, Burnstock G. P2X receptors in peripheral neurons. Prog Neurobiol 2001; 65: 107–134
- Dutton JL, Poronnik P, Li G H, Holding CA, Worthington RA, Vandenberg RJ, Cook DI, Barden JA, Bennett MR. P2X1 receptor membrane redistribution and down-regulation visualized by using receptor-coupled Green Fluorescent Protein chimeras. Neuropharmacology 2000; 39: 2054–2066
- Fabbretti E, Sokolova E, Masten L, D′Arco M, Fabbro A, Nistri A, Giniatullin R. Identification of negative residues in the P2X3 ATP receptor ectodomain as structural determinants for desensitization and the Ca2 + -sensing modulatory sites. J Biol Chem 2004; 279: 53109–53115
- Fischer W, Wirkner K, Weber M, Eberts C, Koles L, Reinhardt R, Franke H, Allgaier C, Gillen C, Illes P. Characterization of P2X3, P2Y1 and P2Y4 receptors in cultured HEK293-HP2X3 cells and their inhibition by ethanol and trichloroethanol. J Neurochem 2003; 85: 779–790
- He ML, Koshimizu TA, Tomic M, Stojilkovic SS. Purinergic P2X2 receptor desensitization depends on coupling between ectodomain and C-terminal domain. Mol Pharmacol 2002; 62: 1187–1197
- He ML, Zemkova H, Stojilkovic SS. Dependence of purinergic P2X receptor activity on ectodomain structure. J Biol Chem 2003; 278: 10182–10188
- Heinemann SH. Guide to data aquisation and analysis. Single-channel recording2nd ed, B Sakmann, E Neher. Plenum Press, New York and London 1995; 53–90
- Jabs R, Paterson IA, Walz W. Qualitative analysis of membrane currents in glial cells from normal and gliotic tissue in situ: down-regulation of Na+ current and lack of P2 purinergic responses. Neuroscience 1997; 81: 847–860
- Kettenmann H, Steinhäuser C. Receptors for neurotransmitters and hormones. Neuroglia2nd ed, H Kettenmann, B Ransom. Oxford University Press, New York 2005; 131–145
- Khakh BS, Gittermann D, Cockayne DA, Jones A. ATP modulation of excitatory synapses onto interneurons. J Neurosci 2003; 23: 7426–7437
- Khakh BS, Proctor WR, Dunwiddie TV, Labarca C, Lester HA. Allosteric control of gating and kinetics at P2X4 receptor channels. J Neurosci 1999; 19: 7289–7299
- Khakh BS, Smith WB, Chiu C S, Ju DH, Davidson N, Lester HA. Activation-dependent changes in receptor distribution and dendritic morphology in hippocampal neurons expressing P2X2-Green Fluorescent Protein receptors. Proc Natl Acad Sci USA 2001; 98: 5288–5293
- Koshimizu TA, Ueno S, Tanoue A, Yanagihara N, Stojilkovic SS, Tsujimoto G. Heteromultimerization modulates P2X receptor-functions through participating extracellular and C-terminal subdomains. J Biol Chem 2002; 277: 46891–46899
- Kukley M, Stausberg P, Adelmann G, Chessell IP, Dietrich D. Ecto-nucleotidases and nucleoside transporters mediate activation of adenosine receptors on hippocampal mossy fibers by P2X7 receptor agonist 2′-3′-O-(4-Benzoylbenzoyl)-ATP. J Neurosci 2004; 24: 7128–7139
- Kukley M, Steinhäuser C, Jabs R. Distribution of P2X receptors on astrocytes in juvenile rat hippocampus. Glia 2001; 36: 11–21
- Lachnit WG, Oglesby IB, Gever JR, Gever M, Huang CC, Li XC, Jin H, McGivern JG, Ford APDW. Regulated expression of the rat recombinant P2X3 receptor in stably transfected CHO-K1 tTA cells. J Auton Nerv Syst 2000; 81: 75–81
- Nicke A, Bäumert HG, Rettinger J, Eichele A, Lambrecht G, Mutschler E, Schmalzing G. P2X1 and P2X3 receptors form stable trimers: a novel structural motif of ligand-gated ion channels. EMBO J 1998; 17: 3016–3028
- Rettinger J, Schmalzing G. Activation and desensitization of the recombinant P2X1 receptor at nanomolar ATP concentrations. J Gen Physiol 2003; 121: 451–461
- Robertson SJ, Ennion SJ, Evans RJ, Edwards FA. Synaptic P2X receptors. Curr Opin Neurobiol 2001; 11: 378–386
- Sacchetti A, Subramaniam V, Jovin TM, Alberti S. Oligomerization of DsRed is required for the generation of a functional red fluorescent chromophore. FEBS Lett 2002; 525: 13–19
- Sim JA, Young MT, Sung HY, North RA, Surprenant A. Reanalysis of P2X7 receptor expression in rodent brain. J Neurosci 2004; 24: 6307–6314
- Smart ML, Panchal RG, Bowser DN, Williams DA, Petrou S. Pore formation is not associated with macroscopic redistribution of P2X7 receptors. Am J Physiol Cell Physiol 2002; 283: C77–C84
- Sokolova E, Skorinkin A, Fabbretti E, Masten L, Nistri A, Giniatullin R. Agonist-dependence of recovery from desensitization of P2X3 receptors provides a novel and sensitive approach for their rapid up or downregulation. Br J Pharmacol 2004; 141: 1048–1058
- Thomas S, Virginio C, North RA, Surprenant A. The antagonist trinitrophenyl-ATP reveals co-existence of distinct P2X receptor channels in rat nodose neurones. J Physiol 1998; 509: 411–417
- Vial C, Roberts JA, Evans RJ. Molecular Properties of ATP-Gated P2X receptor ion channels. Trends Pharmacol Sci 2004; 25: 487–493
- Zemkova H, He ML, Koshimizu TA, Stojilkovic SS. Identification of ectodomain regions contributing to gating, deactivation, and resensitization of purinergic P2X receptors. J Neurosci 2004; 24: 6968–6978