Abstract
Advances in optical microscopy techniques and single-molecule detection have paved the way to exploring new approaches for investigating membrane dynamics and organization, thereby revealing details on the processing of signals, complex association/dissociation, chemical reactions and transport at and around the membrane. These events rely on a tight regulation of lipid-protein and protein-protein interactions in space and time. Fluorescence Correlation Spectroscopy (FCS) provides exquisite sensitivity in measuring local concentrations, association/dissociation constants, chemical rate constants and, in general, in probing the chemical environment of the species of interest and its interactions with potential partners. Here, we review some applications of FCS to lipid and protein organization in biomimetic membranes with lateral heterogeneities, which share some physico-chemical properties with cellular rafts. What we learn from investigations of lipid-lipid and lipid-protein interactions in simple model membranes can be regarded as an essential basic lecture for studies in more complex cellular membranes.
Introduction
The Singer and Nicholson hypothesis (Singer & Nicholson [Citation1972]) on the structure of the cellular membrane has been challenged in the past years. The rather simple picture of ‘proteins floating in a sea of lipids’ can hardly match the heterogeneous composition of the membrane. Up to a thousand structurally different lipids have been identified in a eukaryotic cell and one third of the proteins encoded in the entire human genome is estimated to belong to membrane proteins. Whatever the reason for such a chemical variability is, this complexity can generate a rather heterogeneous organization of membrane components and give rise to fluctuations, both in space and time, which are of potential relevance to the biology involved. The great challenge of figuring out ‘who is doing what’ has to go through the experimental effort of finding out ‘who is where and when’. In particular, lateral heterogeneities have gathered the attention of the researchers in the past decade, resulting in many models of non-random molecular distribution with different names, e.g., lipid rafts (Simons & van Meer [Citation1988], Simons & Toomre [Citation2000]), microdomains, confinement zones (Kusumi et al. [Citation2004]). With time, it has become clear that the complexity of the problem requires interdisciplinary studies with different techniques and on membrane systems of various levels of complexity. Certainly, model membranes raise some questions about relating the observations in artificial bilayers to those in the viable cellular membrane. Nevertheless, close-to-native model membranes offer a key biophysical system to tackle the problem of understanding the physical forces underlying molecular associations in the plane of the membrane. They offer the unique possibility of a bottom-up approach, in which complexity can be gradually raised from a minimal system that exhibits liquid domains.
Many techniques are applied to detect, identify and ultimately characterize lipid rafts, from traditional biochemistry to molecular biology up to biophysics (Simons & Vaz [Citation2004]). The most important outcome of all of these studies is that, if rafts are constantly present in the membrane organization, they most likely are very dynamic and small (below the optical resolution as determined by the diffraction limit). Information on dynamics of membrane components is, therefore, of primary importance to establish how rafts are organized, how they form, coalesce and distribute throughout the bilayer. In this respect, despite the, at times, insufficient spatial resolution, optical microscopy techniques, such as Fluorescence Recovery After Photobleaching (FRAP), Single Particle Tracking (SPT) and Fluorescence Correlation Spectroscopy (FCS) prove to be essential, non-invasive tools with high temporal resolution.
In this review, we first introduce Fluorescence Correlation Spectroscopy (FCS) and how this technique can be applied to membranes. We will briefly list some applications of FCS to cellular and model membranes. Then, we will introduce a model membrane system, so-called Giant Unilamellar Vesicles (GUVs), most suitable for (single-molecule) optical microscopy and review the current knowledge on applying FCS to GUVs, including how to overcome potential artifacts. We will also show what we can learn about liquid domains by FCS on domain-containing GUVs composed of lipids only and lipids and proteins. Finally, we will briefly list some promising developments of FCS, which are of potential relevance to membrane research, in general, and to lipid raft issues, in particular.
Technical background: Principle and experimental details
Fluorescence Correlation Spectroscopy (FCS) relies on the statistical analysis of fluorescence temporal fluctuations from a small open detection volume, which is defined by a laser beam focused onto the sample (Rigler & Elson [Citation2001]). Fluorescence fluctuations can arise from the diffusion of the optical species in and out of focus, as well as from any other process (chemical reaction, association/dissociation event, photodynamic process, conformational change), which switches the optical species between states with different emission properties. Hence, the autocorrelation function provides a statistically accurate quantification of local concentrations and various dynamic parameters (e.g., diffusion coefficients, kinetic rate constants, association/dissociation constants, triplet lifetimes), even within the same measurement if the processes of interest occur at different time-scales (Magde et al. [Citation1972], Schwille [Citation2001]).
The normalized fluorescence autocorrelation function G(τ) corresponds to the probability that, provided a particle is emitting inside the focal volume at a time 0, the same particle still emits inside the focal volume at a later time τ. If the optical species diffuses through the focus, this probability will decay over time in a fashion that is related to the mobility of the particle itself. Faster particles yield more rapid fluorescence fluctuations, thereby resulting into a faster decay of the probability G(τ).When the laser focus is positioned on a membrane bilayer, as in , and the optical species are confined to a two-dimensional Brownian motion within the plane of the membrane with diffusion coefficient Di, then the autocorrelation function can be written as follows:1 where <Ci> is the two-dimensional time average concentration of the species i in the detection area Aeff= πr02 (∼0.1 µm2), and τd,i is the average residence time of the species i. The focal volume is assumed to be a Gaussian function with 1/e2 dimension r0. The diffusion coefficient Di for the species i is inversely proportional to τd,i with τd,i= r02/4Di.
Figure 1. Top view of the focal plane and detection volume (top left). Optical species are spotted by the detector only if they diffuse into the detection volume. Scheme of a confocal microscope for dual-color fluorescence correlation spectroscopy (top right). Fluorescence fluctuations are recorded over time and applied to the correlation algorithm. The correlation function G(τ) is plotted as a function of time τ (bottom). This Figure is reproduced in color in Molecular Membrane Biology online.
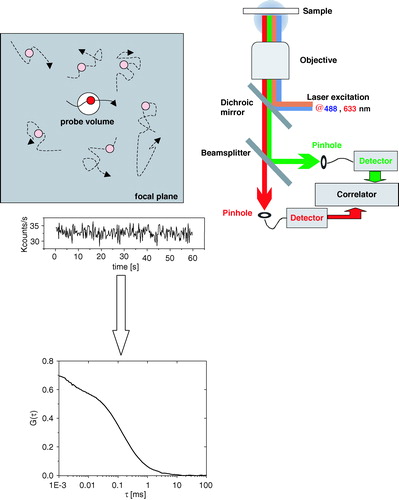
Typical FCS setups largely resemble the optical pathway of confocal microscopes with the exception that the beam is usually not scanned, and that the detection is performed by more sensitive avalanche photodiodes rather than PMTs (). For membrane applications, the position of the focus with respect to the source of signal is critical for the recording of artifact-free FCS curves and for the interpretation of the data. The combination of a FCS setup with an imaging module is therefore highly recommended.
FCS represents a very sensitive method to study intermolecular interactions and diffusion. From a theoretical point of view, the Brownian motion in biological membranes has been first analyzed by Saffman and Delbrück (Saffman & Delbrück [Citation1975]). In the case of particles freely diffusing in 2D, the diffusion coefficient scales with the logarithm of the hydrodynamic radius (defined as the cross-section of the particle along the direction perpendicular to the plane of the membrane). It is possible to resolve two distinct components in the FCS curve, but only if their particle cross-sections differ by a factor of ∼5–10. However, this holds within the assumptions of the Saffman-Delbrück model, that is: (i) the particle is regarded as a cylinder, with axis perpendicular to the plane of the bilayer (i.e., spanning both leaflets), moving about in the sheet in a Brownian fashion; (ii) the viscosity of the medium around the membrane is much lower than that of the membrane; (iii) the membrane is regarded as a continuous medium (Saffman & Delbrück [Citation1975]). In many cases, some of these assumptions may be too strict and/or the particle diffusion coefficient may become sensitive to specific lipid-protein interactions, which produce a large effect on the particle dynamics. The FCS data need, therefore, to be integrated with other experimental data to acquire more information on the stoichiometry of a molecular complex and/or the microviscosity of its environment.
For the sake of accuracy in the FCS data analysis for membranes, the focal spot is positioned at the top/bottom of a GUV, which is large enough to be considered as approximately planar (∼0.1 µm2) in the focal plane. Sometimes, thermal undulations of the bilayer in focus induce additional components in the FCS curve, characterized by long (compared to the real lipid diffusion time) diffusion times. Data affected by such artifacts should be rejected.
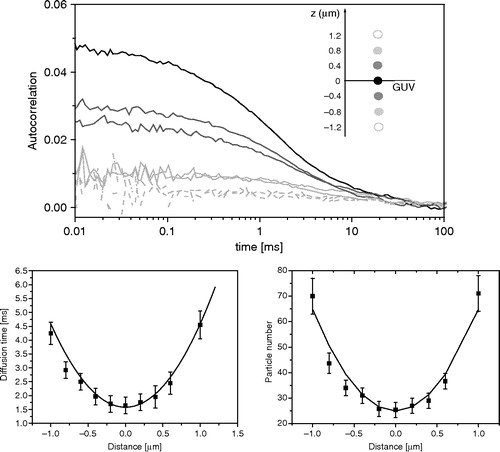
Furthermore, precautions need to be taken to rule out potential artifacts arising by the inaccurate positioning of the detection volume with respect to the bilayer. First of all, the optimal x,y,z position of the top/bottom side of GUVs is chosen by high resolution confocal scanning microscopy. It is known that, in planar systems, the diffusion times, τD, and the particle number, N, depend on the position of the focus, as follows (Benda et al. [Citation2003]):2
We recommend performing routine tests to calibrate for the detection area at the membrane and to check the lipid diffusion times and the particle number as a function of the bilayer z-position (see and Benda et al. [Citation2003], Milon et al. [Citation2003]). These plots help to identify the correct position of the focal plane with respect to the bilayer.
Figure 2. An accurate positioning of the focal volume on the membrane bilayer is crucial to record artifact-free correlation curves. G(τ) strongly changes as a function of the distance of the focal plane with respect to the bilayer along the optical axis z (top). As a consequence, both the particle diffusion time (bottom left) and the particle number in the detection volume (bottom right) change as a function of the distance of the focal volume from the membrane.
FCS on cellular and model membranes
Fluorescence-based imaging combined with FCS has been proven to be an invaluable tool for the analysis of molecular mobility both in live cells and model membranes (for review see Bacia & Schwille [Citation2003]). However, it also highlighted some problematic issues. First, photobleaching may induce temporal changes of the average fluorescence signal during data acquisition, which spoils the correlation time decay, thereby preventing any reliable fitting. Photobleaching often takes place when tracking membrane components, which diffuse very slowly or are immobile, as a result of interaction with the cytoskeleton and/or formation of large molecular complexes. By contrast, lipid analogs or some membrane-associated proteins are generally well accessible by FCS. For example, the diffusion of the lipid probe DiI-C18 in the plasma membrane of rat basophilic leukemia cells was followed by FCS (D∼10−9 cm2/s) (Bacia et al. [Citation2002]). Furthermore, as for other optical techniques which exploit a diffraction-limited illumination, a problem for FCS measurements at the plasma membrane arises from the crowded environment around the bilayer. As the detection volume spans not only the membrane itself but also part of the extra- and intracellular space, FCS will probe diffusion of all of the optical species present in that volume. This may cause problems in distinguishing between species diffusing at the membrane and those who are in the process of being (or already have been) endocytosed. Unfortunately, it is very often hard to discriminate between these species at and around the membrane on the basis of their dynamics, as the endocytosed vesicles have diffusion rates similar to those of particles diffusing in membranes. These problems pose important limits to potential applications of FCS in membranes of live cells.
The potential limitations in employing FCS to cellular membranes enhance the crucial importance of model membranes as a biomimetic system for investigating molecular dynamics. FCS has been applied to supported lipid bilayers deposited on mica and containing either one or two components (Benda et al. [Citation2003]). Recently, supported bilayers of ternary lipid mixtures (DOPC, DPPC and cholesterol) have been employed to examine in detail the mobility of lipid probes at specific sites (Burns et al. [Citation2005]). In this study, the authors discuss the potential of combining two techniques, FCS and Atomic Force Microscopy (AFM). The high temporal resolution needed to extract the dynamic parameters is provided by FCS, whereas the high spatial resolution can be achieved by AFM. Unfortunately, the use of supported bilayer poses some limitations in studying the diffusion behavior of membrane components. A non-ideal behavior of the lipid probe mobility was found, giving rise to two-component FCS curves (most likely due to the proximity of the bilayer to the glass substrate).
FCS on giant unilamellar vesicles
Giant Unilamellar Vesicles (GUVs) represent the ideal model membrane for (single-molecule) optical microscopy, as they provide a single spherical closed bilayer visible under the light microscope (diameter of 10–100 µm) and with a cell-like curvature (see A). Unlike supported bilayers, they are free-standing bilayers and, hence, do not engage unwanted interactions with the support material. Unlike black lipid membranes, their preparation does not involve the use of detergents and yields a more regular bilayer structure. GUVs prepared with the electroformation method, which was developed in the late 1980s (Angelova & Dimitrov, [Citation1986]), have recently become of key importance and employed for a wide range of applications, from studies of membrane thermal undulations up to mimicking biological processes of increasing complexity.
Figure 3. (A) Confocal image of GUVs composed of DOPC and 0.1 mol% of DiI-C18 (left panel) and 3D projection of a GUV reconstructed from a stack of confocal images at different z-positions (0.4 µm thick). (B) Lateral diffusion coefficients of various lipid analogs (0.001 mol%) diffusing in GUVs composed of DOPC. This Figure is reproduced in color in Molecular Membrane Biology online.
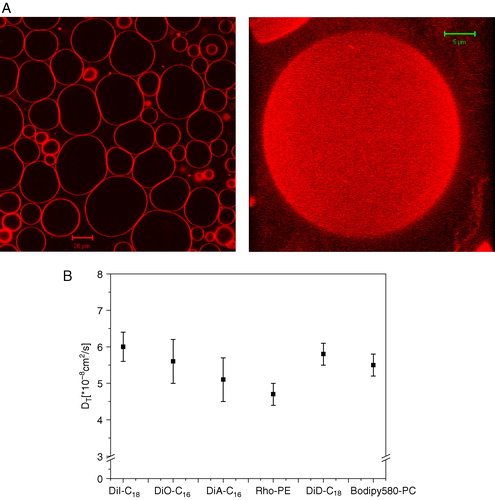
As they span the laser focus in the lateral direction and provide single bilayers, GUVs are ideally suited for FCS studies (see A). Lipid probes diffuse in single-component GUVs in a Brownian-like fashion and the corresponding FCS curves are well fitted to a single-component 2D Brownian diffusion model. Diffusion coefficients in fluid membranes are on the order of ∼1–20 µm2/s, depending on the temperature, lipid composition and on the ionic strength/type of buffer. These values are consistent with those obtained with other techniques, such as SPT (Schütz et al. [Citation1997]), FRAP (Dietrich et al. [Citation2001]) and diffusion NMR (Vist & Davis [Citation1990], Filippov et al. [Citation2004]).
Data on molecular diffusion coefficients and the analysis of the diffusion behavior helps to define the membrane organization in space and time, including the molecular packing and degree of conformational order. This type of information necessarily relies on the lipid analogs used in the experiment, which are typically assumed to behave as the surrounding non labeled lipids. However, in the complex membrane environment governed by a large variety of physical forces, minimal changes in the chemical structure might induce significant changes in intra- and intermolecular interactions. It is therefore reasonable to think that different lipid probes may diffuse at different rates in the same bilayer. But how different are the diffusion coefficients of lipid analogs? We tested various lipid probes and measured their diffusion coefficients in GUVs composed of DOPC (B). Lipid analogues such as DiI, DiA, DiD and DiO diffuse approximately at the same rate, without any appreciable difference between C16 and C18 chains. Significant differences were found only in a few cases (rhodamine-PE). The same lipid probes were tested in GUVs composed of DLPC and DMPC (Ld phase) and gave results, which were consistent with the DOPC GUVs. However, we cannot rule out that larger differences in lateral mobility of structurally distinct probes could be seen in bilayers with different lipid composition and/or different molecular packing.
FCS on phospholipid/cholesterol giant unilamellar vesicles
Lipid rafts are operationally defined on the basis of two criteria: (i) they are cholesterol-dependent (mainly enriched in sphingolipids and cholesterol), and (ii) they resist detergent extraction (leading to formation of the so-called, detergent resistant membranes, DRMs). Although the second of these tenets has been recently challenged by quantitative studies of the influence of detergent onto the membrane organization (Heerklotz [Citation2002]), the first statement still holds. Cholesterol is a crucial component for preserving the viability of the membrane environment and modulates lipid-lipid interactions by ‘fluidizing’ or ‘condensing’ when and where needed. Investigations of lipid-cholesterol mixtures span entire decades of membrane research. Several phase diagrams have been proposed in the literature for mono- and bilayer membranes containing binary mixtures of phospholipids and cholesterol (see for example McConnell & Vrljic [Citation2003]). In the case of phospholipids with a low melting temperature (Tm), it is not clear yet whether and for which phospholipids a coexistence region of Ld and Lo phases must be expected. In fact, at intermediate ratios researchers always failed to detect large, single phase domains, which led to the idea that domains may be too small to be detected.
GUVs composed of phospholipid and cholesterol mixtures are homogeneous under the light microscope (B; Veatch & Keller [Citation2003], Kahya et al. [Citation2003]). FCS data always showed single-phase behavior, at least for short-chain saturated and unsaturated phospholipids. The technique also provides information on the molecular packing induced by phospholipid-cholesterol interactions. Lipid mobility continuously decreases as the amount of cholesterol increases (A), thereby suggesting that cholesterol produces a condensing effect on the bilayer, by increasing the order of the lipid acyl chains.
Figure 4. (A) Lipid lateral diffusion coefficient as a function of molar percentage of cholesterol for DOPC/cholesterol (circles; left axis) and SM/cholesterol (triangles; right axis) mixtures. (B) Confocal image of GUVs composed of DOPC/cholesterol 1:1 and 0.1 mol% of DiI-C18. (C) Lipid lateral diffusion coefficient as a function of molar percentage of cholesterol for DOPC/SM/cholesterol mixture (black squares: total lipid mixture – no phase separation; grey squares: DOPC-enriched, Ld phase; triangles: SM-enriched, Lo phase). The dashed line sets the diffusion coefficient in pure DOPC GUVs. (D) Confocal image of GUV composed of DOPC/SM/cholesterol 1:1:1 mixture, 0.1 mol% of DiI-C18 (red) and 0.1 mol% of GM1 (bound to AF488-labeled CTX, green).
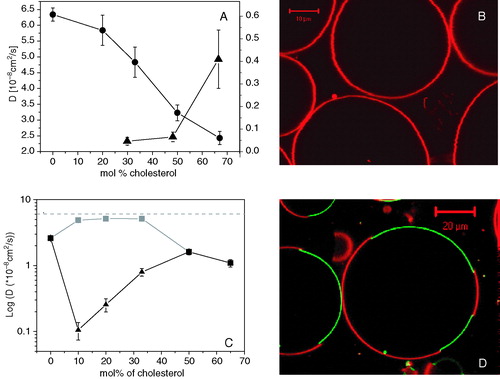
In the case of lipids with high Tm, at low cholesterol concentrations a solid phase is expected to coexist with a Lo phase. Again, the assignment of the phases and the boundaries of phase regions are problematic, due to lack of experimental evidences of domain formation. The reason for this could be, again, that domains are too small to be detected. FCS readily accessed lipid mobility for binary mixtures with more that 33% of cholesterol (data at room temperature), suggesting the ‘fluidizing’ effect of cholesterol and a decrease of order of the acyl chains (A). However, below 33% of cholesterol, FCS failed to provide reliable data as a result of the low lipid mobility, which caused the FCS curves to be affected by photobleaching.
FCS on heterogeneous giant unilamellar membranes: Lipid systems
Domain assembly has been observed by us and other groups in the case of ternary lipid mixtures. Relatively simple mixtures of a low melting temperature (Tm) lipid, a high Tm, such as sphingomyelin, and cholesterol, exhibit a very complex phase behavior, as demonstrated by the various versions of phase diagrams based on different techniques (de Almeida et al. [Citation2003], Veatch & Keller [Citation2003]). Liquid-liquid immiscibility has been observed over a wide range of lipid compositions and temperatures in the form of round micrometer-sized domains (Veatch & Keller [Citation2003], Bagatolli & Gratton [Citation1999]). We have explored several regions of the phase diagram for dioleoyl-phosphatidylcholine (DOPC), sphingomyelin (SM) and cholesterol (see D) by combining confocal imaging and FCS (Kahya et al. [Citation2003]). On one hand, confocal imaging would give a static picture of the domain morphology, provided that sufficient contrast is reached by the preferential partitioning of the fluorescent probe in one lipid phase over the other. On the other hand, FCS would give information on the lateral lipid diffusion and, hence, phase assignment and composition. FCS also helps to detect distinct phases, for instance in the case of low imaging contrast given by the fluorescent probe.
We studied in detail the effect of cholesterol on lipid mobility of equimolar mixtures of DOPC and SM. Here, cholesterol induces formation of immiscible lipid phases, a liquid-disordered one, Ld, (characterized by high lipid mobility) and a liquid-ordered one, Lo (with low lipid mobility). Lipid mobility changes dramatically upon changing the amount of cholesterol (in mixtures with equimolar amount of DOPC and SM). This suggests a change in the composition of the liquid domains, even if the domain morphology remains qualitatively unchanged in the imaging mode. Cholesterol mostly affects the lipid packing of the Lo phase, enriched in SM, as shown by the steep increase of the lipid lateral diffusion rate by almost one order of magnitude (C). By contrast, the mobility in the Ld phase hardly decreases. Furthermore, the difference in lipid mobility between Lo and Ld phase is significantly higher than previously believed (cfr. FRAP data on supported bilayers and GUVs (Dietrich et al. [Citation2001])) and strictly dependent on the amount of cholesterol. By comparison with the effect of cholesterol on lipid mobility in membranes either of pure DOPC or pure SM, an indication can be obtained of the composition of the two phases.
Optical imaging necessarily relies on the ability of lipid probes to associate with one phase rather than with the other. However, the phase assignment is not straightforward as the partition coefficient of a probe strongly depends on the lipid composition of the bilayer. For example, the lipid analog DiI-C18 prefers the Ld to the Lo phase in DOPC/SM/cholesterol mixtures but it mainly associates with the Lo phase in DOPC/DSPC/cholesterol mixtures (Scherfeld et al. [Citation2003]). In this respect, FCS offers an independent and reliable tool to assign lipid phases. Alternatively, one can exploit the spectral differences in the emission spectrum of a dye, LAURDAN, which equally partitions in all of the lipid phases. Its emission spectrum is sensitive to the alignment of the acyl chains within a bilayer, thereby allowing for discriminating a solid phase (relatively blue emission) from a Ld phase (relatively red emission) (Parasassi & Gratton [Citation1995]).
In conclusion, FCS provides a reliable methodology to assign lipid phases and gives an indication of the density of molecular packing depending on the lipid composition. Unlike SPT, it offers a reliable and highly accurate statistics in short time and, unlike FRAP, it does not require heavy labeling load, which could alter the lipid organization in the bilayer. However, in the conventional experimental geometry, FCS is bound to the diffraction-limited resolution and may be therefore not sufficient to detect and characterize domains smaller than the optical resolution. As briefly discussed in the last section of this paper, new strategies are needed to tailor the detection area of FCS acquisition and, thereby, improve the resolving power of the technique.
FCS on heterogeneous giant unilamellar vesicles: Lipid-protein systems
According to at least a part of the scientific community, proteins are likely to function as a site of nucleation for rafts, by recruiting other proteins and lipids, which best fit their structural contour (see for instance Mayor & Rao [Citation2004]). It is certainly very difficult to provide an experimental basis of evidence for this concept. Nonetheless, proteins are most likely involved in the raft formation and they certainly play a role in raft dynamics. It is, therefore, simply not enough to examine pure lipid systems. Model membranes and, in particular, GUVs can now incorporate various types of proteins, thereby extending the complexity of the system and its applications. We can then begin to answer questions concerning, for example, the influence of membrane proteins on the lipid organization in membranes of complex phase behavior and their partitioning behavior in distinct lipid phases. We set out to develop a biophysical tool to identify rules and structural requirements which are responsible for targeting membrane proteins to lipid environments of specific chemistry. We can then test whether and how the lipid matrix influences the mechanisms of function of membrane proteins.
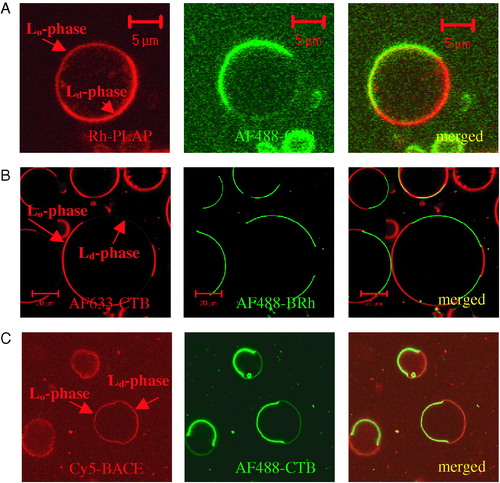
Putative raft-associated and non-raft proteins were reconstituted into domain-exhibiting GUVs (Bacia et al. [Citation2004], Kahya et al. [Citation2005]). Their spatial organization was observed by a combination of optical imaging and FCS. The human placental alkaline phosphatase (PLAP) was abundantly found in detergent resistant membranes (DRMs) after treatment with Triton X-100 at 4°C (Brown & Rose [Citation1992], Schroeder et al. [Citation1998]). However, it mainly associated with Ld phases in GUVs composed of DOPC/SM/cholesterol (1/1/1), as shown by FCS and by counterstaining the Lo phase with GM1-bound fluorescent cholera toxin (A). The same spatial organization was found for a similar GPI-anchored protein, the bovine intestine alkaline phosphatase (N. Kahya & S. Morandat, unpublished results). FCS measurements of local protein density in distinct phases revealed that at most 25–30% of PLAP partitioned into the Lo phase. Furthermore, antibody-mediated cross-linking caused the protein to associate more (up to 50%) with the ordered phase (Kahya et al. [Citation2005]). Although this data might seem surprisingly different from the expectations of a putative raft-associated protein, PLAP showed a higher affinity for Lo phase compared to other membrane proteins, e.g., syntaxin, synaptobrevin (Bacia et al. [Citation2004]) and bacteriorhodopsin (B; Kahya et al. [Citation2005]). However, we have too little statistics to bring forward the hypothesis that GPI-anchored proteins are targeted to Lo phases more than transmembrane proteins. Furthermore, there are clearly differences between partition coefficients of Lo phase of single-spanning membrane proteins. A protease (BACE) responsible for the cleavage of the amyloid precursor protein (APP) at its β-site was reconstituted into GUVs containing coexisting liquid domains (C) (Kalvodova et al. [Citation2005]). FCS measurements and confocal microscopy showed that 15–20% of BACE associated with Lo phase, still more than syntaxin/synaptobrevin do. Interestingly, when GM1 was included in the lipid composition and cross-linked with cholera toxin, BACE shifted more towards the Lo phase (C). On the confocal microscope, BACE equally distributed on the vesicle surface, although distinct lipid phases still coexisted, as demonstrated by CTB partitioning into one phase. This suggests either a specific GM1-BACE interaction, which drags BACE towards the Lo phase as a result of the GM1 cross-linking or a rearrangement of the lipid phases that increases BACE affinity for the ordered phase. On the other hand, some membrane (or membrane-bound) proteins were found to associate with Lo phases almost exclusively, such as cholera toxin (Kahya et al. [Citation2003]) or the GPI-anchored human prion (N. Kahya, unpublished results).
Figure 5. (A) Confocal images of GUVs composed of SM/DOPC/cholesterol 1:1:1 and 0.1% of GM1 containing the GPI-anchored rhodamine-labeled PLAP (Rh-PLAP). Red channel: fluorescence signal from Rh-PLAP, which partitions for 25% in the Lo-phase. Green channel: fluorescence signal from AF488-labeled cholera toxin (AF488-CTB), which partitions for 99% in the Lo phase. (B) Confocal images of GUVs composed of SM/DOPC/cholesterol 1:1:1 and 0.1% of GM1 containing the multi-spanning protein AF488-labeled bacteriorhodopsin (AF488-BRh). Red channel: fluorescence signal from AF633-labeled cholera toxin (AF633-CTB), which partitions for 99% in the Lo phase. Green channel: fluorescence signal from AF488-labeled bacteriorhodopsin (AF488-BRh), which partitions for 99% in the Ld phase. (C) Confocal images of GUVs composed of SM/DOPC/cholesterol 1:1:1 and 0.1% of GM1 containing the single-span Cy5-labeled BACE (Cy5-BACE). Red channel: fluorescence signal from Cy5-BACE, which partitions for 20% in the Lo phase. Green channel: fluorescence signal from AF488-labeled cholera toxin (AF488-CTB), which partitions for 99% in the Lo phase.
By collecting data from various membrane proteins of distinct topology, we begin to look for structural determinants, which may play a key role in modulating the affinity of a protein for one lipid environment versus another. With these results, we do not imply that Lo phases of these compositions should be regarded as cellular rafts, although it is thought that rafts are in a liquid state. However, this data help relate structural factors of membrane proteins to their affinity for an ordered versus a disordered lipid environment and give us information on the strength of lipid-protein interactions. Finally, they provide a simple model to pin down the factors that may increase-decrease the affinity for a specific environment (i.e., cross-linking, specific lipid-protein and/or protein-protein interactions).
Conflicting evidence exists as to whether rafts are mobile or immobile structures, whether the diffusional mobility of lipids and proteins is affected by their association with specific lipid environments and what are the factors that may perturb protein lateral diffusion. Studies in vivo have been carried out to characterize the diffusional behavior of putative raft and non-raft proteins (Kenworthy et al. [Citation2004], Goodwin et al. [Citation2005]). The lipid and protein diffusion coefficients at the cell surface are typically 10–100-fold slower in cell membranes than in model membranes. Several factors can contribute to a decrease in the mobility, e.g., anchoring of cytoskeleton components to the membrane and molecular crowding. The lateral diffusion properties of membrane proteins can be studied in vivo and compared to those in model membranes. For example, the diffusion of PLAP in distinct liquid domains was investigated by FCS (Kahya et al. [Citation2005]). According to the Saffman-Delbrück theory, a monomeric GPI-AP should ideally diffuse in the plane of the membrane at approximately the same speed of a lipid molecule. In our study, PLAP diffuses in both Ld and Lo phases with a diffusion coefficient, which is lower by a factor of ∼1.4 than that of lipids in the corresponding domains. The slow dynamics of the protein may be due to the nanoscale organization of GPI-APs that organize in dense clusters, as recently proven by time-resolved homo-FRET in live cells (Sharma et al. [Citation2004]). However, clustering of 2–4 subunits cannot fully explain the low mobility of PLAP. The protein dynamics might also reflect a rather large hydrodynamic radius due to specific lipid/cholesterol complexes, which form a thick shell around and move together with the protein. In the most likely scenario, a combination of these two possibilities is envisioned, consistent with the report by Sharma et al. ([Citation2004]) in which the small dense protein clusters have been shown to be specifically dependent on the presence of cholesterol.
New prospects for FCS in membrane research
Seeing the high spatial heterogeneity and fast dynamic exchange of components at the cellular membrane, lipids and proteins may give rise to small and short-lived types of rafts. We need, therefore, to track membrane components with high spatial and temporal resolution. In general, optical microscopy techniques are less invasive and offer higher temporal resolution compared to other technologies. However, the diffraction-limited spatial resolution poses some limitations to the analysis of the position and speed of single molecular components. Recent developments of the FCS technique have opened up new interesting prospects for FCS applications (see Kim & Schwille [Citation2003]). Coincidence analysis (i.e., cross-correlation amplitudes) improves the time resolution when looking at fast binding kinetics, for instance, of signaling processes (Winkler et al. [Citation1999], Heinze et al. [Citation2002]). Scanning FCS (Ruan et al. [Citation2004]) represents a powerful combination of temporal and spatial correlation and may offer a solution to photobleaching damages and spatial instabilities of the system of interest.
Many of these forefront technologies are still under development. The power of these techniques could also be improved by tailoring the FCS detection volume, for instance by spatially confining the acquisition. This could be achieved by combining FCS with Total Internal Reflection Fluorescence (TIRF) (Lieto et al. [Citation2003]), stimulated emission depletion (STED) (Kastrup et al. [Citation2005]) or exploiting other ways of illumination (Near-Field Scanning Optical Microscopy, NSOM). In conclusion, the advancements of FCS and other optical microscopy techniques hold great promise in gaining more in-depth knowledge of the biochemistry of membranes, from model up to cellular ones.
This paper was first published online on prEview on 27 January 2006.
We thank Kai Simons, Lucie Kalvodova, Sandrine Morandat and Dennis Merkle for useful discussions. This work was partially funded by EFRE Grant No. 4212/0402.
References
- Angelova MI, Dimitrov DS. Liposome electroformation. Faraday discuss. Chem Soc 1986; 81: 303–308
- Bacia K, Majoul IV, Schwille P. Probing the endocytic pathway in live cells using dual-color fluorescence cross-correlation analysis. Biophys J 2002; 83: 1184–1193
- Bacia K, Schwille P. A dynamic view of cellular process by in vivo fluorescence auto- and cross-correlation spectroscopy. Methods 2003; 29: 74–85
- Bacia K, Schuette CG, Kahya N, Jahn R, Schwille P. SNAREs prefer liquid-disordered over ‘raft’ (liquid-ordered) domains when reconstituted into giant unilamellar vesicles. J Biol Chem 2004; 279: 37951–37955
- Bagatolli LA, Gratton E. Two-photon fluorescence microscopy observation of shape changes at the phase transition in phospholipid giant unilamellar vesicles. Biophys J 1999; 77: 2090–2101
- Benda A, Beneš M, Marecek V, Lhotsky A, Hermens WTh, Hof M. How to determine diffusion coefficients in planar phospholipid systems by confocal fluorescence correlation spectroscopy. Langmuir 2003; 19: 4120–4126
- Brown DA, Rose JK. Sorting of GPI-anchored proteins to glycolipid-enriched membrane subdomains during transport to the apical cell surface. Cell 1992; 68: 533–544
- Burns AR, Frenkel DJ, Buranda T. Local mobility in lipid domains of supported bilayers characterized by atomic force microscopy and fluorescence correlation spectroscopy. Biophys J 2005; 89: 1081–1093
- De Almeida RFM, Fedorov A, Prieto M. Sphingomyelin/phosphatidylcholine/cholesterol phase diagram: boundaries and composition of lipids rafts. Biophys J 2003; 85: 2406–2416
- Dietrich C, Bagatolli LA, Volovyk ZN, Thompson NL, Levi M, Jacobson K, Gratton E. Lipid rafts reconstituted in model membranes. Biophys J 2001; 80: 1417–1428
- Filippov A, Oradd G, Lindblom G. Lipid lateral diffusion in ordered and disordered phases in raft mixtures. Biophys J 2004; 86: 891–896
- Goodwin JS, Drake KR, Remmert CL, Kenworthy AK. Ras diffusion is sensitive to plasma membrane viscosity. Biophys J 2005; 89: 1398–1410
- Heerklotz H. Triton promotes domain formation in lipid rafts mixtures. Biophys J 2002; 83: 2693–2701
- Heinze KG, Rarbach M, Jahnz M, Schwille P. Two-photon fluorescence coincidence analysis: rapid measurements of enzyme kinetics. Biophys J 2002; 83: 1671–1681
- Kahya N, Brown DA, Schwille P. Raft-partitioning and dynamic behavior of human placental alkaline phosphatase in giant unilamellar vesicles. Biochemistry 2005; 44: 7479–7489
- Kahya N, Scherfeld D, Bacia K, Poolman B, Schwille P. Probing lipid mobility of raft-exhibiting model membranes by fluorescence correlation spectroscopy. J Biol Chem 2003; 278: 28109–28115
- Kalvodova L, Kahya N, Schwille P, Ehehalt R, Verkade P, Dreschsel D, Simons K. Lipids as modulators of proteolytic activity of BACE: involvement of cholesterol, glycosphingolipids, and anionic phospholipids in vitro. J Biol Chem 2005; 280: 36815–36823
- Kastrup L, Blom H, Eggeling C, Hell SW. Fluorescence fluctuation spectroscopy in subdiffraction focal volumes. Phys Rev Lett 2005; 94: 178104
- Kenworthy AK, Nichols BJ, Remmert CL, Hendrix JM, Kumar M, Zimmerberg J, Lippincott-Schwartz J. Dynamics of putative raft-associated proteins at the cell surface. J Cell Biol 2004; 165: 735–746
- Kim SA, Schwille P. Intracellular application of fluorescence correlation spectroscopy: prospects for neuroscience. Curr Opin Neurobiol 2003; 13: 583–590
- Kusumi A, Koyama-Honda I, Suzuki K. Molecular dynamics and interactions for creation of stimulation-induced stabilized rafts from small unstable steady-state rafts. Traffic 2004; 5: 213–230
- Lieto AM, Cush RC, Thompson NL. Ligand-receptor kinetics measured by total internal reflection with fluorescence correlation spectroscopy. Biophys J 2003; 85: 3294–3302
- Magde D, Elson EL, Webb WW. Thermodynamic fluctuations in a reacting system-measurement by fluorescence correlation spectroscopy. Phys Rev Lett 1972; 29: 705–708
- Mayor S, Rao M. Rafts: scale-dependent, active lipid organization at the cell surface. Traffic 2004; 5: 231–240
- McConnell HM, Vrljic M. Liquid-liquid immiscibility in membranes. Annu Rev Biophys Biomol Struct 2003; 32: 469–492
- Milon S, Hovius R, Vogel H, Wohland T. Factors influencing fluorescence correlation spectroscopy measurements on membranes: simulations and experiments. Chem Phys 2003; 288: 171–186
- Parasassi T, Gratton E. Membrane lipid domains and dynamics detected by LAURDAN. J Fluorescence 1995; 5: 59–70
- Rigler, R, Elson, E ( editors). 2001. Fluorescence correlation spectroscopy: theory and applications. Berlin: Springer.
- Ruan Q, Cheng MA, Levi M, Gratton E, Mantulin WW. Spatial-temporal studies of membrane dynamics: scanning fluorescence correlation spectroscopy (SFCS). Biophys J 2004; 87: 1260–1267
- Saffman PG, Delbrück M. Brownian motion in biological membranes. Proc Natl Acad Sci USA 1975; 72: 3111–3113
- Scherfeld D, Kahya N, Schwille P. Lipid dynamics and domain formation in model membranes composed of ternary mixtures of saturated and unsaturated phosphatidylcholines and cholesterol. Biophys J 2003; 85: 3758–3768
- Schroeder RJ, Ahmed SN, Zhu Y, London E, Brown DA. Cholesterol and sphingolipid enhance the Triton X-100 insolubility of glycosylphosphatidylinositol-anchored proteins by promoting the formation of detergent-insoluble ordered membrane domains. J Biol Chem 1998; 279: 1150–1157
- Schütz GJ, Schindler H, Schmidt T. Single-molecule microscopy on model membranes reveals anomalous diffusion. Biophys J 1997; 73: 1073–1080
- Schwille P. Fluorescence correlation spectroscopy and its potential for intracellular applications. Cell Biochem Biophys 2001; 34: 383–408
- Sharma P, Varma R, Sarasij RC, Ira, Gousset K, Krishnamoorthy G, Rao M, Mayor S. Nanoscale organization of multiple GPI-anchored proteins in living cell membranes. Cell 2004; 116: 577–589
- Simons K, Toomre D. Lipid rafts and signal transduction. Nature Rev Mol Cell Biol 2000; 1: 31–39
- Simons K, van Meer G. Lipid sorting in epithelial cells. Biochemistry 1988; 27: 6197–6202
- Simons K, Vaz WL. Model systems, lipid rafts, and cell membranes. Annu Rev Biophys Biomol Struct 2004; 33: 269–295
- Singer SJ, Nicholson GL. The fluid mosaic model of the structure of cell membranes. Science 1972; 175: 720–731
- Veatch SL, Keller SL. Separation of liquid phases in giant vesicles of ternary mixtures of phospholipids and cholesterol. Biophys J 2003; 85: 3074–3083
- Vist MR, Davis JH. Phase equilibria of cholesterol/dipalmitoylphosphatidylcholine mixtures: 2H nuclear magnetic resonance and differential scanning calorimetry. Biochemistry 1990; 29: 451–464
- Winkler T, Kettling U, Koltermann A, Eigen M. Confocal fluorescence coincidence analysis: an approach to ultra high-throughput screening. Proc Natl Acad Sci USA 1999; 96: 1375–1378