Abstract
Atomic force microscopy has developed into a powerful tool in the study of phase separation in lipid bilayers. Its ability to image a semi-fluid surface under buffer at nanometre lateral resolution and Angstrom resolution vertically allows us to distinguish phase separated lipid domains, models of the elusive rafts postulated to exist as functional platforms in the cellular membrane, which may only rise 0.3 nm above the surrounding membrane. This review charts the history of this development, and includes a description of sample preparation techniques, factors affecting image contrast mechanisms, its use in the investigation of the pre-transition ripple phase, and in the localization of cell surface proteins.
Introduction
Complex mixtures of lipids can support multiple co-existing phases characterized by their molecular ordering, and the plasma membrane, unlike other cellular membranes, is an example of such a complex mixture. The observation that liquid-ordered lipid phases have a similar composition to detergent resistant membranes (DRMs) Citation[1–3] and that cholesterol depletion destroys liquid ordered phases, detergent resistance and raft functionality Citation[4], have led to the hypothesis that phase separated domains or lipid ‘rafts’ act as functional structures in the plasma membrane Citation[5], Citation[6]. These microdomains are enriched in sphingolipids and cholesterol and are thought to act as stable platforms in the fluid membrane to host functional components. However, many of the methods for studying rafts to confirm their existence and role are indirect and doubts have been raised over the interpretation of some data, in particular, it has been suggested that some techniques may even induce phase separation Citation[7].
There have been some excellent detailed reviews of lipid phase separation over the past few years Citation[8], Citation[9]. A bilayer consisting of a single lipid will undergo a phase transition at its melting temperature Tm, changing from a solid or gel phase to a liquid phase. The Tm is dependent mainly on the structure of the acyl chains in the bilayer interior. Saturated straight chains pack tightly and so melt at higher temperatures, whereas unsaturated lipids with a cis double bond kink do not pack well, are less ordered and therefore melt at lower temperatures. At intermediate temperatures, mixtures of these two types of lipid will phase separate into the solid and liquid components. The addition of other components influences this phase behaviour. When a sterol is introduced its rigid, planar structure intercalates between the close packed gel phase, disrupting the ordered structure and fluidizing it. The sterol has the opposite effect upon the unsaturated liquid phase, imposing conformational order to the flexible disordered acyl chains with its rigid structure, thereby condensing the lipid and increasing its packing density. In the presence of a sterol such as cholesterol the two phases are commonly referred to as the liquid ordered phase (lo) and liquid disordered phase (ld) Citation[10]. The gel or solid ordered (so) phase is not believed to exist under physiological conditions.
Chain packing is not the only determinant of lipid ordering, the head group also plays an important role. Interactions between head groups are governed by charge, hydrogen bonding and by size through steric hindrance of packing. Indeed, specific short range interactions between cholesterol and sphingolipids are thought to play an important role in the formation of rafts. There is evidence that cholesterol forms a stoichiometric complex with sphingolipids partly driven by hydrogen bonding and partly due to cholesterol relieving strain in the bilayer by filling voids amongst the hydrocarbon chains that are created by the bulky sphingomyelin head groups. The evidence for this complex model comes mainly from studies of lipid monolayers by McConnell and co-workers Citation[11]. The stoichiometry for lo phase formation appears to be close to 33 mol% cholesterol for both PC and sphingomyelin membranes. Another view, proposed by Feigenson et al. Citation[12], Citation[13], is that rather than a specific chemical interaction leading to a condensed phase, multibody interactions are more important. In what is termed the umbrella model, lipid head groups act to shield the predominantly hydrophobic cholesterol from water. A solubility limit for cholesterol in a membrane is reached when the sphingolipid head groups can no longer shield cholesterol and so the addition of more cholesterol to the system becomes unfavourable. This occurs at approximately 65 mol% cholesterol in PC membranes, and 57 mol% in PE membranes. It is this unfavourable free energy of cholesterol contact with water, rather than a favourable cholesterol-lipid interaction, that is proposed to dominate mixing behaviour. In all probability, these two models play a combined role.
Determining the structural properties of the putative raft domains in cells is made difficult due to the small size and transient nature of the domains in the structurally complex cellular membrane. In model bilayer systems some complexities are removed in order to render the problem more tractable. For instance, large gel or lo domains in giant unilamellar vesicles (GUVs) may be observed by simple light microscopy and suitable fluorescent dyes. However, consideration also has to be given to whether the measurement technique affects the system. For instance, there is strong evidence that detergent, which is used to separate rafts from non-raft lipids in cells, perturbs the bilayer structure before it solubilizes the lipid. Similarly, fluorescent probes that are highly versatile in reporting on the membrane structure and function may also interact with the membrane and interfere with the measurement. The planar nature of lipid bilayers makes them ideal for interrogation by atomic force microscopy (AFM). Lipid phases can be distinguished in the AFM due to changes in bilayer thickness caused by the differences in acyl chain packing. A great strength of the AFM is its ability to image under physiological conditions with little sample preparation, and it is capable of resolving structures ranging from nanometres to tens of microns in size. To date the majority of AFM studies have been on model systems – planar supported lipid monolayers or bilayers – and here we shall review the results of these studies with particular emphasis on phase separation and highlight the relevance to understanding lipid raft formation in the cell membranes.
Early atomic force microscope studies of lipidic films
The AFM, invented by Binnig et al. in 1986 Citation[14], was first used to image soft surfaces under aqueous conditions in the early 1990s Citation[15]. Studies of gap junctions (Hoh et al. 1991 Citation[16]), plasmid DNA (Hansma et al. 1992 Citation[17]), cell surfaces (Radmacher et al. 1992 Citation[18]) and cytoskeletal actin filaments within cells (Henderson et al. 1992 Citation[19]) are examples of the early successes of AFM for nanometre resolution biological imaging. Around the same time AFM was also applied to the study of supported monolayer films created using the Langmuir-Blodgett (LB) technique Citation[20] and gained favour because it avoided ambiguities that had been highlighted in the interpretation of images of such films generated by its sister technique, the scanning tunnelling microscope Citation[21], Citation[22]. Work in the following few years exploited the very high molecular resolution of the novel AFM instrument focusing on molecular ordering in single component systems such as LB mono- and multi-layers of cadmium arachidate Citation[23] and grain boundaries in highly crystalline films Citation[24]. Zasadzinski et al. (1991) Citation[25] used the LB technique to combine two monolayers as the opposing leaflets of a bilayer and the first AFM measurements of phase separation in multi-component LB bilayer films soon followed in 1992 Citation[26] when Overney et al. imaged a 50:50 molar mixture of arachidic acid and a partially fluorinated carboxylic acid bound ionically to a cationic polymer. Round islands of arachidic acid, 100 nm to 1 µm in diameter, were observed in a matrix of the carboxylic acid. Since the length of an arachidic acid molecule is about 0.5 nm greater than the fluorocarbon terminated carboxylic acid used, the islands that protruded above the background in the AFM images were assigned as the arachidic acid. Further information about the chemical difference between the phases was obtained by using the AFM in a friction force mode, where lateral friction between the surface and tip is measured simultaneously with the topographic image. The chemical make up of each phase could therefore be assigned with more confidence by reference to the friction response on surfaces of the pure components.
Phase structure in a monolayer of stearic acid was studied as a function of surface pressure by Chi et al. Citation[27] in 1993. As a monolayer is compressed at the air-water interface it will undergo various phase transitions, the main one being from a disordered liquid expanded (LE) phase to a more ordered liquid condensed, or liquid crystalline (LC) phase, with a transition region containing both phases. It was found that speed of compression of the monolayer affected the phase structure; a slow compression allowing time for larger, more regular domains to form, whilst a faster compression led to many more small domains with irregular structure. Although this result had been observed by fluorescence microscopy, the motivation of Chi's work was to study fine structure below the resolution limit of optical techniques. Much smaller domains could be observed, and the morphology of the domain boundaries was also found to vary with compression speed. Most importantly, the AFM allowed observation of phase separation without the need for a fluorescent dye; it was previously thought that the low concentration of dye would have no effect on phase structure, but the AFM study of domain morphology with and without dye (a sulphorhodamine labelled lipid, DPPE-SR) revealed dramatic changes in domain structure, even with the dye at very low concentration.
Yang et al. (1993) Citation[28] prepared supported phospholipid bilayers of DAPC as a substrate for cholera toxin. The bilayer, formed on freshly cleaved mica via two dips in an LB trough, was stabilized by uv-crosslinking of the DAPC-25 polymerizable lipid. This facilitated sufficiently high resolution imaging of the cholera toxin molecules to resolve the sub-units. The presence of defects in the stabilized bilayer allowed measurement of bilayer thickness. In a later paper Citation[29], Mou and Yang introduced the technique of creating artificial defects by scraping away a patch of bilayer using the AFM tip to expose the underlying substrate. Of course this will only work when the bilayer is in the gel phase, otherwise the fluid bilayers tend to flow around the AFM tip and immediately heal.
Bilayer preparation, Langmuir-Blodgett vs. vesicle fusion
An alternative to the LB technique for preparing supported bilayers is to fuse unilamellar vesicles directly onto the solid support Citation[30]. Small unilamellar vesicles (SUVs) with a diameter of 18–20 nm can be prepared by sonication of the lipid suspension. Alternatively, large unilamellar vesicles (LUVs) with a diameter or 50–200 nm can be created by repeated extrusion of the vesicle solution through a membrane filter with a small pore size (typically <200nm), the size of the filter pore controlling the size of the vesicle allowed through. The substrate is then exposed to the vesicle solution, the vesicles are adsorbed to the surface and they rupture (a process made more likely by the strain in the bilayer due to the small radius of curvature) and fuse to form a single continuous bilayer. The vesicle fusion technique was first used for AFM studies by Mou et al. (1994) Citation[28], Citation[29] and this seminal work has instigated the widespread use of AFM to study the phase behaviour of phospholipid mixtures. An extensive characterization of the formation of supported bilayers by vesicle fusion has been carried out by Brisson and co-workers using AFM, quartz crystal microbalance (QCM) and ellipsometry Citation[31–34]. The vesicle fusion technique removes the variable of surface pressure which must be set when preparing bilayers from two opposing monolayers by the LB technique. Surface pressure has a strong effect on monolayer phase structure. When studying monolayers as an analogue of bilayer membranes in the cell, a surface pressure of around 30 mN/m is generally used, but there is dispute about whether this is a suitable value. Various pressures have been advocated on the basis of matching the properties of monolayers to those of bilayers, such as the main transition temperature or surface area per molecule. For instance, Feng et al. Citation[35] looked in detail at this issue and concluded that higher pressures were more relevant. More recent evidence comes from an AFM study of the quenching of a 3:1 DOPC:DPPC bilayer from 60°C to 23°C Citation[36]. When prepared by the LB technique, a third intermediate height level appeared as the domains evolved, i.e., domains in the two leaflets are out of register. But when prepared by vesicle fusion, only two domain heights are seen, so domains grow across the leaflets in register. Whether this assumption that a bilayer behaves as two disconnected monolayer slabs is valid, or whether there are specific inter-leaflet interactions in bilayers Citation[37] is an important question, but the use of bilayers formed by vesicle fusion circumvents the issue. Conversely, an advantage of the LB technique is that the two leaflets can be of different compositions, the typical situation in plasma membranes. This advantage was utilized by Rinia et al. Citation[38] who created a wide variety of leaflet combinations and observed the different morphologies that resulted using AFM.
Phase separation in phospholipids monolayers/bilayers revealed by atomic force microscopy
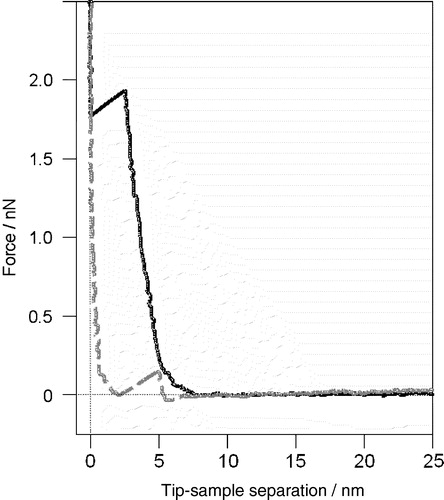
One of the first applications of AFM to the study of phase separation in phospholipid films was carried out by Dufrene et al. in 1997 Citation[39]. Mixed monolayers and bilayers of DSPE and DOPE were prepared on mica by the LB technique and imaged in air and under fluid. In both cases microscopic domains of DSPE standing proud of a DOPE phase were observed. The differences in height were larger than predicted, and this was explained by differences in the mechanical properties of the two lipids, the DOPE phase being deformed to a greater extent by the AFM tip. In a series of follow-up papers, they went on to characterize the mechanical properties of model membranes, with a detailed account of the interpretation of force spectroscopy measurements and tip-membrane forces Citation[40–42]. In contact mode AFM imaging a constant force is applied by the probe which will mechanically deform the underlying membrane and the amount of deformation is an intrinsic property of the material. As the applied force is altered, the difference in apparent height between lipid phases in the sample can change and a large enough force will cause the tip to breakthrough the membrane to the underlying substrate. The quantitative response of the membrane under mechanical load can be measured by AFM force-distance spectroscopy. shows a typical force-distance curve acquired on a fluid phase bilayer indicating this breakthrough at larger forces. A further influence on the apparent height difference between lipid phases is electrostatics which is described by DLVO theory Citation[43]. Muller and Engel investigated the effect of electrostatics on AFM imaging and concluded that the pH and electrolyte concentration of the buffer solution can be adjusted to screen out electrostatic forces Citation[44] to improve image quality. To effectively screen out the electrostatic contribution to the apparent thickness of a lipid bilayer, a buffer of at least 100 mM ionic strength is necessary. Measurement of absolute bilayer depth by contact mode AFM is therefore prone to error if imaging force and experimental conditions are not well controlled, particularly on the more fluid lipid phases. A study of the contrast mechanisms in contact mode AFM was carried out by Schneider et al. Citation[41], Citation[42]. Applied force was varied whilst imaging a phase separated bilayer such that the tip broke through one phase but not the other Citation[41], and image contrast as a function of hydrophilic or hydrophobic probe chemistry was also investigated Citation[42], finding that the hydrophobic tips broke through the bilayer at very low force. Measurement of absolute bilayer depth by contact mode AFM is therefore prone to error if imaging force and experimental conditions are not very well controlled and understood, particularly on the more fluid lipid phases. Experience has taught us that fluid tapping mode AFM with a light set-point is less prone to the height artifacts induced by indentation of the softer phase, but a comparison of the contrast mechanisms in fluid tapping mode AFM is currently lacking in the literature.
Figure 1. A characteristic AFM force-distance curve on a fluid bilayer. The unique profile can be used to verify the presence of a bilayer when imaging a featureless single lipid phase. As the AFM tip approaches (black solid curve) it first interacts with the bilayer approximately 6.5 nm from the mica surface. The bilayer then compresses beneath the tip to a thickness of 3 nm at a force of 2 nN before the tip breaks through to the mica substrate. As the force is reduced (grey dashed curve) the tip stays in contact with the mica until the force is ∼0 nN at which point the bilayer suddenly reforms beneath the tip pushing it out (unpublished observations: S. D. Connell & D. A. Smith).
As well as the buffer affecting the interaction of the AFM tip and bilayer, the presence or absence of Ca2 + ions was found to have a large influence on the phase behaviour of certain supported bilayers Citation[45]. Gel phase DPPC in a fluid DOPS or DOPC phase was investigated as a function of Ca2 + concentration. Without Ca2 + present large, well defined DPPC domains were found for both DPPC/DOPC and DPPC/DOPS mixtures, while the presence of Ca2 + caused small, isolated DPPC domains to form in the DOPS, but had no effect on the DOPC system. In studies of multilayered systems, Ca2 + has also been found to increase the gel-to-fluid transition temperature in serine containing lipids Citation[46]. A likely explanation is that cations bind in the head group region affecting the head group interactions, an effect which is also likely to influence the interaction between AFM tip and bilayer surface. For instance Ca2 + could bridge two PS molecules Citation[45], which each carry a dipole and negative charge, thereby reducing the repulsion exerted between the headgroups Citation[47] and allowing the bilayer to condense slightly, with a corresponding reduction in lateral pressure. This then leads directly to a change in phase morphology.
Domain formation in monolayers with a composition mimicking the outer leaflet of renal brush border membranes was investigated using AFM by Milhiet et al. Citation[48]. Sphingomyelin and POPC mixtures, at molar ratios varying from 2:1 to 4:1 were found to separate into large domains of a liquid expanded (LE) and liquid condensed (LC) phase. At 2:1, 33% of the surface area was LC, and at 4:1 58% was LC. The quantity of LC phase increases continuously with the quantity of the high Tm saturated lipid sphingomyelin. Cholesterol was then added to an intermediate 3:1 composition which had the effect of causing the individual LC domains to connect up into a network at 20 mol% cholesterol, indicative that the LC domains have become more fluid (i.e., a so to lo transition). Lateral heterogeneity was still present at 33 mol% cholesterol, but interestingly the difference in height between the phases was observed to continuously reduce as the cholesterol concentration was increased. This is further evidence that the LC domains are becoming progressively more fluid (so the bilayer mechanically deforms more) or is actually decreasing in depth due to disorder in the acyl chains. Either way, it is evidence of the fluidising effect of cholesterol on solid domains.
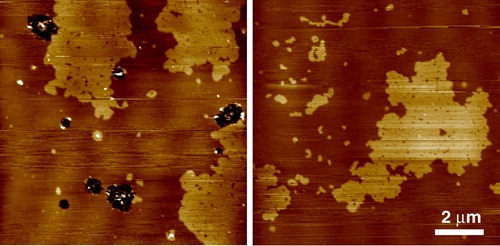
The gel phase separation of sphingomyelin (SM) in DOPC/SM and POPC/SM equimolar mixtures was analysed in detail using AFM by Giocondi et al. Citation[49]. They showed that under similar experimental conditions, SM gel microdomains adopt diverse structures in the fluid PC matrix, with variations in size, shape and structure, from large flat domains hundreds of nm in diameter, to assemblies of closely packed globular structures (). Gel-gel phase separation within SM domains was sometimes observed, and the structure of SM was in some way dependent on the PC species in the matrix, so the acyl chain of PC can affect organization within the SM microdomain. For this reason it is suggested that POPC/SM/chol should be used as a more suitable model for the outer leaflet of the plasma membrane, as POPC is a more biologically relevant unsaturated species, rather than DOPC which for various reasons has become the standard unsaturated lipid, despite it not existing in nature.
Figure 2. Tapping mode AFM images of equimolar sphingomyelin/DOPC bilayers under fluid. The SM enriched domains are in the gel phase characterized by the rough edges to the domains which are higher in the image than the surrounding fluid DOPC rich phase. Gel phase sphingomyelin can take on a wide variety of structures under apparently the same experimental conditions. In this case each domain is very large, up to many microns across, but on closer inspection many smaller domains can be seen to make up this structure (unpublished observations: S. D. Connell & D. A. Smith). This figure is reproduced in colour in Molecular Membrane Biology online.
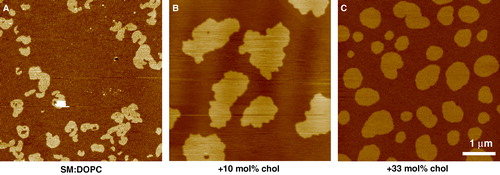
Considering its importance to the hypothesis that lipid rafts exist in cell membranes, there have been relatively few AFM studies on the effect of detergent resistant domains in model systems or cells. Rinia et al. Citation[50] created a supported bilayer using the vesicle fusion method starting with a 1:1 SM:DOPC mixture and then added cholesterol to make bilayers that exhibited varying degrees of gel, ld and lo phase separation. shows some typical images of a 1:1 SM/DOPC phase separated bilayer imaged with AFM in our laboratory. Gel phase domains are observed in the absence of cholesterol and at high cholesterol content lo phase regions, characterized by smoother edges and different bilayer thickness from the gel, are observed. Between 2 and 15 mol% cholesterol the phase separated domains had an appearance comparable to the gel phase domains in the absence of cholesterol. At 25 mol% cholesterol the raised domains have become the more fluid lo phase, coalescing and enlarging as a result. As cholesterol is increased in the bilayer a higher proportion of the bilayer surface area has been converted to the lo phase until by 50 mol% cholesterol content it was difficult to determine the surface coverage as the domains were so large. An interesting feature of this series is that the height difference between the phases reduces as cholesterol content increases with only a 0.4 nm difference at 50 mol% cholesterol.
Figure 3. Phase separation in single bilayers supported on mica imaged by tapping mode AFM under buffer at 23°C. All scans are 5 µm with a 5 nm z-range. (A) SM:DOPC 1:3 – domains of so phase SM surrounded by ld phase of mainly DOPC. Gel domains are small and fragmented with highly convoluted perimeters. (B) SM:DOPC 1:1 + 10 mol% cholesterol – domains still retain characteristics of the gel phase although they have now coalesced to form fewer larger domains. (C) SM:DOPC 1:1 + 33 mol% cholesterol – the domains are now in the lo phase and line tension and increased fluidity has smoothed the domain perimeters. Note the relative difference in height between the ld phase and the other domains progressively reduces as the cholesterol concentration increases from 1.4 nm in the case of so/ld, to 0.7 nm for the lo/ld system (unpublished observations: S. D. Connell & D. A. Smith). This figure is reproduced in colour in Molecular Membrane Biology online.
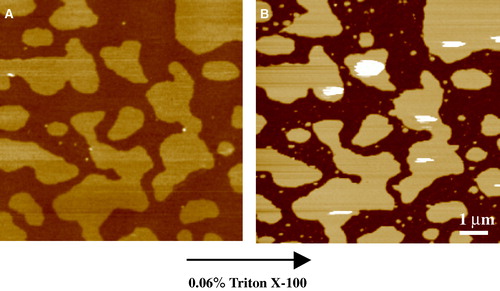
Rinia Citation[50] then treated the 0 mol% and 25 mol% cholesterol 1:1 SM:DOPC phase separated surfaces with 10% Triton X-100 at 4°C, a detergent used in raft extraction studies. At this temperature the ld phase was removed rapidly, leaving behind the lo or gel domains on the solid substrate, confirming the principle of detergent extraction of insoluble lipid rafts in model membranes at least Citation[50]. At room temperature at this detergent concentration they found that Triton removed all the lipid material. However, this detergent concentration is much larger than that normally used in detergent extraction experiments, which typically range from a maximum of 1% Triton down to 0.05% Citation[51–54], which is relatively close to the critical micelle concentration (cmc) at approximately 0.02%. The study by Wilson et al. Citation[53] contains references to others work in the field investigating the effect of varying detergent type and concentration on the detergent extraction of lipid rafts from cells. In room temperature experiments in our laboratory using more typical concentrations of Triton, just 0.06%, several times the cmc and therefore possessing a far weaker detergency effect than at 10%, the lo phase is left behind in an equimolar (1:1:1) SM:DOPC:cholesterol sample (). Clearly the conditions strongly influence the effects of detergent and more work is necessary in this area to fully understand the process of detergent extraction. Giocondi et al. Citation[51] imaged the detergent extraction of cell membranes in situ with AFM, observing the cellular surface break up into many isolated patches of detergent resistant membrane. They suggested that prior to isolation, the detergent plasma membrane fragments form domains 15–20 µm2, an order of magnitude larger than that estimated for the largest rafts in living cells, and this is due to a rearrangement induced by the Triton treatment.
Figure 4. Tapping mode AFM images taken under fluid of the effect of detergent on lipid bilayers of the canonical raft composition – equimolar DOPC, SM and cholesterol. (A) Phase separation of the ld and lo domains prior to detergent treatment. This composition appears to be close to a critical point, with a characteristic finger-like structure to the condensed domains. z-range = 5 nm. (B) Upon treatment with Triton X-100 for 10 minutes (at 0.06% just above its cmc), the ld phase is completely removed exposing the mica substrate but leaving behind detergent resistant domains that correspond closely to the lo phase. z-range = 12 nm (unpublished observations: S. D. Connell & D. A. Smith). This figure is reproduced in colour in Molecular Membrane Biology online.
Phase transitions and raft formation in the DOPC/SM/chol and POPC/SM/chol model systems were followed in real time by AFM in an ingeneous and continuous fashion by Lawrence et al. Citation[55] who used cyclodextrin (MβCD) to extract cholesterol and by Giocondi et al. Citation[56] using cholesterol loaded cyclodextrin (MβCD-chl) to add cholesterol to the membrane whilst imaging. Addition of (MβCD-chl) to POPC/SM and DOPC/SM supported bilayers led to the eventual disappearance of domains, forming a flat bilayer in the lo state. But whereas DOPC/SM exhibited a coexistence of lo-ld phases during the experiment, the POPC/SM system showed lo-gel phase separation as cholesterol was added. However, it was also noticed that cyclodextrin created defects in the bilayer, preferentially solubilizing SM from the membrane. As cyclodextrin is widely used to investigate the effects of cholesterol depletion on the function of real cells, interpretation of its effects with reference only to cholesterol concentration would therefore be erroneous.
Most AFM studies on phase separation in bilayers have been carried out on supported single bilayers due to their stability and ease of formation. However, there exists a body of evidence that interactions with the substrate modify the bilayer properties. For instance, neutron diffraction studies on a mixed DMPC/DSPC double bilayer (created by combining monolayers by the LB method) showed the upper bilayer to have properties more closely resembling that of free bilayers in vesicle solution Citation[57]. It has also been shown by differential scanning calorimetry that the main phase transition of a supported bilayer is shifted to a slightly higher temperature than found in vesicles Citation[58]. The influence of the support on the bilayer adjacent to the support can be seen directly in , a tapping mode AFM image of an equimolar mixture of SM:DOPC:Chol on a mica support taken under buffer. At the temperature during this experiment the system is in a single lo phase (S. D. Connell and D. A. Smith, unpublished data). The bilayer in contact with the mica is 5.2 nm thick, whereas the next three bilayers are around 6.3 nm in thickness. In addition to the electrostatic interaction between the mica and the headgroups of the first bilayer, there is also likely to be a difference in the thickness of the water layers between the mica and first bilayer compared with the thickness of water between subsequent bilayers. A recent AFM investigation into the main phase transitions in supported lipid bilayers resolved two transitions for the single component DMPC membrane, corresponding to the independent melting of each leaflet of the bilayer Citation[59]. Other effects of the substrate include non-equilibrium behaviour Citation[60], Citation[61] and molecular friction revealed by NMR Citation[63]. On the other hand, many other studies have shown that the domain structure and freedom of movement in supported bilayers are representative of their properties in free bilayers Citation[63], Citation[64] which is attributed to the presence of a water layer between the bilayer and support. For example, free movement of domains can be clearly seen in , a phase separated equimolar mixture of DMPC and DSPC. These domains must have a high degree of fluidity to allow them to flow across the surface, coalesce with neighbours and then reshape the boundary to minimize line tension.
Figure 5. Tapping mode AFM image taken under fluid of multiple bilayers of 1:1:1 DOPC:SM:chol on mica highlighting the influence of the substrate on the thickness of the first bilayer. Note that there is no phase separation in this case because at the temperature of the experiment the system is in a single lo phase. Thicknesses of bilayers, shown on the right, range from 5.2±0.1 nm adjacent to the mica, to 6.2±0.1 nm, 6.3±0.1 nm, and 6.4±0.1 nm for the subsequent bilayers (unpublished observations: S. D. Connell & D. A. Smith). This figure is reproduced in colour in Molecular Membrane Biology online.
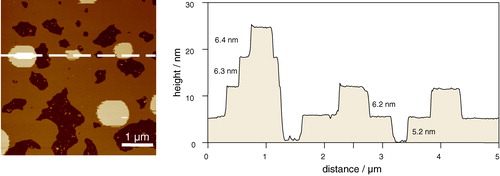
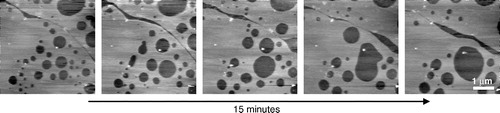
Figure 6. Tapping mode AFM images of a single bilayer formed by vesicle fusion on mica showing phase separation in a DMPC/DSPC 1:1 mixture. The temperature (31°C) is above the Tm for DMPC and below the Tm for DSPC. Proximity to the mica substrate does not prevent lipid mobility – small ld domains gradually flow and coalesce into large irregular domains, which are then pulled into a perfectly round shape to minimize line tension (unpublished observations: G. Li, S. D. Connell & D. A. Smith).
The ripple phase
The pre-transition or ripple phase (P′β) occurs a few degrees below the first-order main-transition in phospholipids and involves a two dimensional reorganization of the bilayer with long range order and hexagonal lattice packing. Its main feature is an asymmetric, saw-tooth rippled surface with a wavelength of between 10 and 30 nm, depending upon the lipid species. A metastable ripple phase can also form, dependent on the thermal history of the sample, with double the wavelength and a symmetric saw-tooth structure. Above and below this ripple phase temperature region the bilayers are planar. Early experimental evidence for the ripple phase came from x-ray diffraction and freeze fracture electron microscopy. A model for ripple phase was postulated by Heimburg Citation[65] in which a small proportion of the lipid has melted at the pre-transition temperature forming linear arrays of fluid phase molecules between gel phase arrays. Although this model was accepted there were many other aspects which required further study and where AFM has been successfully applied.
The first pioneering AFM study into the ripple phase came in 1994, when Mou et al. induced the formation of ripples in a single supported diC15-PC bilayer with the addition of Tris(hydroxymethyl)aminoethane, a common laboratory buffer solution Citation[28]. Two types of domain were observed, one thinner with a period of 18 nm and an amplitude of 0.3 nm, and the other several nanometres thicker with a period of 32 nm and amplitude of 1.2 nm. These were termed the λ and 2λ domains; the 2λ phase was thought to be equivalent to the metastable phase described above. The parallel ripples observed were micrometres in length and displayed bends of 60° or 120° arising from the hexagonal order in the packing. More recently, a series of papers from Jorgenson et al. Citation[66–68] have investigated ripple phase formation in DPPC and mixed DMPC/DSPC bilayers in great detail. In order to observe the ripple phase, it was necessary to prepare double bilayers. Ripple phase was never seen in the bilayer adjacent to the mica presumably for reasons of substrate interaction discussed above. shows some of our observations of the ripple phase in an equimolar DMPC/DSPC multi-bilayer displaying the characteristic 60° bends. A wavelength of 34 nm and amplitude of 1.0 nm suggests that these are 2λ domains. Below the pre-transition and above the main transition temperatures no ripple phase could be detected. In the two phase co-existence region above the main transition, it was found that the domains in the second bilayer have straight edges, reflecting the long range molecular order of the ripple phase. The unique ability of the AFM to image at nanometre resolution in a fluid environment whilst controlling the temperature was used to great effect by Kaasgard et al. (67) who followed the formation and disappearance of the ripple phase by cycling the temperature. The resolution of their images was such that they could observe this process one ripple at a time, occurring along the axis of the ripples. In another interesting study Leidy et al. Citation[68] used the ripple phase to study the secretory phospholipase A2 (PLA2) which catalyses the hydrolysis of glycerophopholipids. PLA2 selectively removed DMPC from the mixed DMPC/DSPC ripple phase bilayer with elongated holes forming along the axis of the ripples. As the DMPC was hydrolysed the ripple phase dissipated and the DSPC enriched bilayer healed and formed a flat gel phase bilayer.
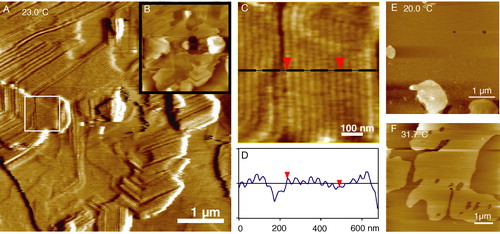
Figure 7. Tapping mode AFM images of multiple bilayers of 1:1 DMPC:DSPC showing the pre-transition or ‘ripple’ phase. The sample was incubated for 20 h at 23.0°C just below the main melting transition of DMPC (Tm = 23.7°C). (A) A friction (lateral force) image showing the morphology of the ripple phase including 120° bends due to the underlying hexagonal symmetry. Inset (B) is a height image of the same area to highlight the multilayer coverage. (C) A detail of the fine ripples from the region indicated by the white box in image A. (D) A line section through the ripples which have a wavelength of 34 nm and height of ∼1.0 nm. (E) Below the pre-transition temperature the uppermost bilayer is flat with both components in the gel phase. Bilayer thicknesses are 5.6 nm measured against the underlying mica at defects or from step edges on multiple bilayer patches. In (F) the temperature has been increased to 31.7°C above the main transition of DMPC but still below that of DSPC (Tm = 58.2°C) hence phase separation is observed (unpublished observations: G. Li, S. D. Connell & D. A. Smith). This figure is reproduced in colour in Molecular Membrane Biology online.
The effect of phase separation on the localization of cell surface proteins
One way to make a link between the behaviour of lipid phases in model membranes to function in real cells is to study the lateral organization of a functional membrane component in a supported lipid system. Yuan et al. took this approach Citation[69], Citation[70] using AFM to visualize the distribution of ganglioside GM1, the receptor for cholera toxin. A wide variety of monolayers and bilayers containing DPPC, DPPE, egg PC and cholesterol were created using the LB technique at high and low pressures and by vesicle fusion. Phase separated domains were observed as expected for systems without GM1. When GM1 was added to the system it localized in the centre and around the perimeter of the condensed phase but did not affect the overall phase structure. As more GM1 was added, it clustered to form filaments within the domain. A similar finding was made in an earlier study by Vie et al. (the first to study localization of GM1 by AFM) who observed GM1 in phase separated 1:1 DOPC:DPPC monolayers deposited at a relatively high pressure of 37 mN/m. Higher concentrations of GM1 localized at the DPPC:DOPC phase boundary encircling the domains. When GM1 was added to a pure DOPC monolayer it separated out into clumps, showing its complete insolubility in the disordered fluid phase lipid. Menke et al. Citation[71] extended the work with sphingolipid mixtures and found identical behaviour. Supported monolayers of SM/POPC, SM/DOPC and SM/POPC/ cholesterol were studied and in each case the GM1 was found to localize in the more condensed phase (SM or SM + cholesterol). This AFM data justified the common use of GM1 as a raft marker which had been established through electron microscopy Citation[72] and electron spin resonance spectroscopy Citation[73] but later contradicted when other electron microscopy studies indicated a random distribution Citation[74]. Importantly, Yuan also found that addition of GM1 to bilayers that are in a single lo phase induced the formation of sub-micron phase separated domains, too small to observe with fluorescence microscopy Citation[70]. This also occurred in the ternary SM/DOPC/cholesterol system in which GM1 localized into the SM and cholesterol rich lo phase forming small microdomains 40–100 nm in size Citation[75]. These were proven to contain the active GM1 by observing its interaction with cholera toxin in situ. It was suggested that this could provide a link between the larger domains seen in phase separated model membranes into which GM1 partitions and the small GM1 rich microdomains found in natural membranes. The same group then extended the study of this system with the use of near-field scanning optical microscopy to determine the position of dye labelled GM1 together with dye labelled lipid Citation[76]. In contrast to all the previous findings, the GM1-BODIPY complex partitioned into the Texas-red labelled fluid phase. The addition of the dye label (on the C5 hydrocarbon moiety) completely changed the preference of GM1 to partition into the fluid phase. Using a very small quantity of GM1-BODIPY added to native GM1 resulted in GM1 being found localized once again in the lo phase in domains typically 100–200 nm in size. Clearly great care must be taken when interpreting the partitioning of dye labelled species (particularly acyl chain labelled) in phase separated membranes.
Milhiet et al. took a similar approach to study the insertion in real time of the GPI anchored alkaline phosphatase (AP) into a DOPC/DPPC mix as a supported monolayer Citation[77] and as a bilayer Citation[78]. In each case insertion of AP via its GPI anchor was observed at the periphery of the DPPC gel phase domains with a few proteins locating inside the domains. This study was rapidly expanded in a subsequent paper Citation[79] which considered AP insertion into equimolar DOPC/SM with and without the addition of cholesterol. In the absence of cholesterol, as before, the AP localized at the boundary of gel/fluid domains but when cholesterol was added the AP was spread evenly across the lo phase domains. The importance of cholesterol was proved by adding a 0.4mM methyl-β-cyclodextrin (MβCD)-cholesterol complex to the gel phase SM/DOPC system with AP already attached to the boundary. As cholesterol was added to the bilayer over a period of an hour, the AP slowly diffused away from the edges of the domains and an even distribution in the lo phase was obtained.
Conclusions
The AFM has distinct advantages as an imaging tool in biology: it can image samples under physiological conditions in real time with nanometer resolution and it can provide detailed chemical and mechanical information. Lipid monolayers and bilayers are ideal samples for AFM and in recent years the technique has been widely applied to these systems with a great deal of success as this short review hopefully reveals. Undoubtedly there are challenges to be faced in extending the use of AFM to study real cell membranes, but the ability of the instrument to characterize membrane morphology and membrane bound protein structures under native conditions with high spatial resolution makes this effort highly worthwhile. In future, AFM will be widely used in conjunction with other biophysical techniques such as NMR, confocal microscopy and calorimetry to cast further light on the complex biophysics of cell membranes.
This paper was first published online on prEview on 24 January 2006.
References
- Schroeder F, Woodford JK, Kavecansky J, Wood WG, Joiner C. Cholesterol domains in biological membranes. Mol Membr Biol 1995; 12: 113–119
- Ahmed SN, Brown DA, London E. On the origin of sphingolipid/cholesterol-rich detergent insoluble cell membranes: physiological concentrations of cholesterol and sphingolipid induce formation of a detergent insoluble, liquid ordered lipid phase in model membranes. Biochemistry 1997; 36: 10944–10953
- Hooper NM, Turner AJ. Ectoenzymes of the kidney microvillar membrane. Differential solubilisation by detergents can predict a glycosyl-phosphatidylinisitol membrane anchor. Biochem J 1988; 250: 865–869
- Ilangumaran S, Hoessli DC. Effect of cholesterol depletion by cyclodextrin on the sphingolipid microdomains of the plasma membrane. Biochem J 1998; 335: 433–440
- Brown DA, London E. Structure of detergent-resistant membrane domains: does phase separation occur in biological membranes?. Biochem Biophys Res Comm 1997; 240: 1–7
- Simons K, Ikonen E. Functional rafts in cell membranes. Nature 1997; 387: 569–572
- Heerklotz H. Triton promotes domain formation in lipid raft mixtures. Biophys J 2002; 83: 2693–2701
- Edidin M. The state of lipid rafts. Ann Rev Biophys Biomolec Struct 2003; 32: 257–283
- Simons K, Vaz WLC. Model systems, lipid rafts and cell membranes. Annu Rev Biophys Biomol Struct 2004; 33: 269–295
- Sankaram MB, Thompson TE. Cholesterol-induced fluid-phase immiscibility in membranes. Proc Natl Acad Sci USA 1991; 88: 8686–8690
- McConnell HM, Radhakrishnan A. Condensed complexes of cholesterol and phospholipids. Biochim Biophys Acta 1993; 1610: 159–173
- Feigenson GW, Buboltz JT. Ternary phase diagram of Dipalmitoyl-PC/Dilauroyl-PC/Cholesterol: nanoscopic domain formation driven by cholesterol. Biophys J 2001; 80: 2775–2788
- Huang J, Feigenson GW. A microscopic interaction model of maximuum solubility of cholesterol in lipid bilayers. Biophys J 1999; 76: 2142–2157
- Binnig G, Quate CF, Gerber C. Atomic force microscopy. Phys Rev Lett 1986; 56: 930–933
- Hoh JH, Hansma PK. Atomic force microscopy for high resolution in cell biology. Trends Cell Biol 1992; 2: 208–213
- Hoh JH, Lal R, John SA, Revel JP, Arnsdorf MF. Atomic force microscopy and dissection of gap junctions. Science 1991; 253: 1405–1408
- Hansma HG, Vesenka J, Siegerist C, Kelderman G, Morrett H, Sinsheimer RL, Elings V, Bustamante C, Hansma PK. Reproducible imaging and dissection of plasmid DNA under liquid with the atomic force microscope. Science 1992; 256: 1180–1184
- Radmacher M, Tillman RW, Fritz M, Gaub HE. From molecules to cells: imaging soft samples with the atomic force microscope. Science 1992; 257: 1900–1905
- Henderson E, Haydon PG, Sakaguchi DS. Actin filament dynamics in living glial cells imaged by atomic force microscopy. Science 1992; 257: 1944–1946
- Tamm LK, McConnell HM. Supported phospholipid bilayers. Biophys J 1985; 47: 105–113
- Smith DPE, Bryant A, Quate CF, Rabe JP, Gerber C, Swallen JD. Images of a bilayer at molecular resolution by scanning tunnelling microscopy. Proc Natl Acad Sci USA 1987; 84: 969–972
- Fuchs H, Schrepp W, Rohrer H. STM investigation of Langmuir-Blodgett films. Surf Sci 1987; 181: 391–393
- Meyer E, Howald L, Overney RM, Heinzelmann H, Frommer J, Guntherodt HJ, Wagner T, Schier H, Roth S. Molecular-resolution images of Langmuir-Blodgett films using atomic force microscopy. Nature 1991; 349: 398–400
- Garnaes J, Schwartz DK, Viswanathan R, Zasadzinski JAN. Domain boundaries and buckling superstructures in Langmuir-Blodgett films. Nature 1992; 357: 54–57
- Zasadzinski JAN, Helm CA, Longo ML, Weisenhorn AL, Gould SAC, Hansma PK. Atomic force microscopy of hydrated phosphatidylethanolamine. Biophys J 1991; 59: 755–760
- Overney RM, Meyer E, Frommer J, Brodbeck D, Luthi RR, Howald L, Guntherodt HJ, Fujihira M, Takano H, Gotoh Y. Friction measurements on phase-separated thin films with a modified atomic force microscope. Nature 1992; 359: 133–135
- Chi LF, Anders M, Fuchs H, Johnson RR, Rigdorf H. Domain structures in Langmuir Blodgett films investigated by atomic force micrsoscopy. Science 1993; 259: 213–216
- Mou J, Yang J, Shao Z. Tris(hydroxymethyl)amnomethane induced a ripple phase in supported unilamellar phospholipid bilayers. Biochemistry 1994; 33: 4439–4443
- Mou J, Yang J, Huang C, Shao Z. Alcohol induces interdigitated domains in unilamellar phosphatidylcholine bilayers. Biochemistry 1994; 33: 9981–9985
- Brian AA, McConnell HM. Allogeneic stimulation of cytotoxic T cells by supported planar membranes. Proc Natl Acad Sci USA 1984; 81: 6159–6163
- Reviakine I, Brisson A. Formation of supported phospholipid bilayers from unilamellar vesicles investigated by atomic force microscopy. Langmuir 2000; 16: 1806–1815
- Richter RP, Brisson A. Characterisation of lipid bilayers and protein assemblies supported on rough surfaces by atomic force microcopy. Langmuir 2003; 19: 1632–1640
- Richter R, Mukhopadhyay, Brisson A. Pathways of lipid vesicle deposition on solid surfaces: A combined QCM-D and AFM study. Biophys J 2003; 85: 3035–3047
- Richter RP, Brisson AR. Following the formation of supported lipid bilayers on mica: A study combining AFM, QCM-D and ellipsometry. Biophys J 2005; 88: 3422–3433
- Feng S-S. Interpretation of mechanochemical properties of lipid bilayer vesicles from the equation of state or pressure-area measurement of the monolayer at the air-water interface or oil-water interface. Langmuir 1999; 15: 998–1010
- Giocondi M-C, Vie V, Lesniewska E, Milhiet P-E, Zinke-Allmang M, Le Grimellec C. Phase topology and growth of single domains in lipid bilayers. Langmuir 2001; 17: 1653–1659
- Nagle JF, Tristtram-Nagle S. Structure of lipid bilayers. Biochim Biophys Acta 2000; 1469: 159–195
- Rinia HA, Demel RA, van der Eerden JPJM, de Kruijff B. Blistering of Langmuir-Blodgett bilayers containing anionic phospholipids as observed by atomic force microscopy. Biophys J 1999; 77: 1683–1693
- Dufrene YF, Barger WR, Green JBD, Lee GU. Nanometer scale surface properties of mixed phosholipid monolayers and bilayers. Langmuir 1997; 13: 4779–4784
- Dufrene YF, Boland T, Schneider JW, Barger WR, Lee GU. Characterization of the physical properties of model biomembranes at the nanometer scale with the atomic force microscope. Faraday Discuss 1998; 111: 79–94
- Schneider J, Dufrene YF, Barger WR, Lee GU. Atomic force microscope image contrast mechanisms on supported lipid bilayers. Biophys J 2000; 79: 1107–1118
- Schneider J, Barger W, Lee GU. Nanometer scale surface properties of supported lipid bilayers measured with hydrophobic and hydrophillic atomic force microscope probes. Langmuir 2003; 19: 1899–1907
- Marra J, Israelachvilli J. Direct measurements of forces between phosphatidylcholine and phosphatidylethanolamine bilayers in aqueous electrolyte solutions. Biochemistry 1985; 24: 4608–4618
- Muller DJ, Engel A. The height of biomolecules measured with the atomic force microscope depends on electrostatic interactions. Biophys J 1997; 73: 1633–1644
- Reviakine I, Simon A, Brisson A. Effect of Ca2 + on the morphology of mixed DPPC-DOPCS supported phospholipid bilayers. Langmuir 2000; 16: 1473–1477
- Casal HL, Martin A, Mantsch HH, Paltauf F, Hauser H. Infrared studies of fully hydrated unsaturated phophatidylserine bilayers – effect of Li+ and Ca2 + . Biochemistry 1987; 26: 7395–7401
- Gregory D, Ginsberg L. Calcium association with phosphatidylserine – modification by cholesterol and phosphatidylcholine in monolayers and bilayers. Biochim Biophys Acta 1984; 769: 238–244
- Milhiet PE, Domec C, Giocondo M-C, Van Mau N, Heitz F, Le Grimellec C. Domain formation in models of the renal brush border membrane outer leaflet. Biophys J 2001; 81: 547–555
- Giocondi M-C, Boichot S, Plenat T, Le Grimellec C. Structural diversity of sphyngomyelin microdomains. Ultramicroscopy 2001; 100: 135–143
- Rinia HA, Snel MME, van der Eerden JPJM, de Kruijff B. Visualising detergent resistant domains in model membranes with atomic force microscopy. FEBS Lett 2001; 501: 92–96
- Giocondi MC, Vie V, Lesniewska E, Goudonnet JP, Le Grimellec. In situ imaging of detergent resistant membranes by atomic force microscopy. J Struct Biol 2000; 131: 38–43
- Schroeder RJ, Ahmed SN, Zhu Y, London E, Brown AB. Cholesterol and sphingolipid enhance the Triton X-100 insolubility of glycosylphospatidylinositol-anchored poteins by promoting the formation of detergent-insoluble ordered membrane domains. J Biol Chem 1998; 273: 1150–1157
- Wilson BS, Steinberg SL, Liderman K, Pfeiffer JR, Surviladze Z, Zhang J, Samelson LE, Yang L-H, Kotula PG, Oliver JM. Markers for detergent resistant lipid rafts occupy distinct and dynamic domains in native membranes. Molec Biol Cell 2004; 15: 2580–2592
- Field KA, Holowka D, Baird B. Structural aspects of the association of FcεRI with detergent resistant membranes. J Biol Chem 1999; 274: 1753–1758
- Lawrence JC, Saslowsky DE, Edwardson JM, Henderson RM. Real-time analysis of the effects of cholesterol on lipid raft behaviour using atomic force microscopy. Biophys J 2003; 84: 1827–1832
- Giocondi M-C, Milhiet PE, Dosset P, Le Grimellec C. Use of cyclodextrin for AFM monitoring of model raft formation. Biophys J 2004; 86: 861–869
- Fragneto G, Charitat T, Graner F, Mecke K, Perino-Gallice L, Bellet-Amalric. A fluid floating bilayer. Europhys Lett 2001; 53: 100–106
- Yang J, Appleyard J. The main phase transition of mica supported phosphatidylcholine membranes. J Phys Chem B 2000; 104: 8097–8100
- Charrier A, Thibaudau F. Main phase transitions in supported lipid single-bilayer. Biophys J 2005; 89: 1094–1101
- Stottrup B, Veatch S, Keller S. Nonequilibrium behaviour in supported lipid membranes containing cholesterol. Biophys J 2004; 86: 2942–2950
- Leonenko Z, Finot E, Ma H, Dahms T, Cramb D. Investigation of temperature induced phase transitions in DOPC and DPPC phospholipid bilayers using temperature controlled scanning force microscopy. Biophys J 2004; 86: 3783–3793
- Hetzer M, Heinz S, Grage S, Bayerl T. Asymmetric molecular friction in supported phospholipid bilayers revealed by NMR measurements of lipid diffusion. Langmuir 1998; 14: 982–984
- Ratto T, Longo M. Anomalous subdiffusion in heterogeneous lipid bilayers. Langmuir 2003; 19: 1788–1793
- Boxer SG. Molecular transport and organisation in supported lipid membranes. Curr Opin Chem Biol 2000; 4: 704–709
- Heimburg T. A model for the lipid pretransition: coupling of ripple formation with the chain-melting transition. Biophys J 2000; 78: 1164–1165
- Leidy C, Kaasgaard T, Crowe JH, Mouritsen OG, Jorgenson K. Ripples and the formation of anisotropic lipid domains:Imaging two component supported double bilayers by atomic force microscopy. Biophys J 2002; 83: 2625–2633
- Kaasgaard T, Leidy C, Crowe JH, Mouritsen OG, Jorgenson K. Temperature controlled structure and kinetics of ripple phases in one and two component supported lipid bilayers. Biophys J 2003; 85: 350–360
- Leidy C, Mouritsen OG, Jorgenson K, Peters GH. Evolution of a rippled membrane during phospholipase A2 hydrolysis studied by time resolved AFM. Biophys J 2004; 87: 408–418
- Yuan C, Johnston LJ. Distribution of ganglioside GM1 in L-α-dipalmitoylphospatidylcholine/cholesterol monolayers: A model for lipid rafts. Biophys J 2000; 79: 2768–2781
- Yuan C, Johnston LJ. Atomic force microscopy studies of ganglioside GM1 domains in phosphatidylcholine and phosphatidylcholine/cholesterol bilayers. Biophys J 2001; 81: 1059–1069
- Menke M, Kunneke S, Janshoff A. Lateral organisation of GM1 in phase separated monolayers visualised by scanning force microscopy. Eur Biophys J 2002; 31: 317–322
- Peters MW, Mehlhorn IE, Baber KR, Grant CWM. Evidence of a distribution difference between two gangliosides in bilayer membranes. Biochim Biophys Acta 1984; 775: 272–282
- Delmelle M, Dufrane SP, Brasseur R, Ruysachaert JM. Clustering of gangliosides in phospholipid bilayers. FEBS Lett 1980; 121: 11–14
- Thompson TE, Allieta M, Brown RE, Johnston ML, Tillack TW. Organisation of ganglioside GM1 in phospatidylcholine bilayers. Biochim Biophys Acta 1985; 817: 229–237
- Yuan C, Furlong J, Burgos P, Johnston LJ. The size of lipid rafts: An atomic force microscopy study of ganglioside GM1 domains in sphingomyelin/DOPC/cholesterol membranes. Biophys J 2002; 82: 2526–2535
- Burgos O, Yuan C, Viriot M-L, Johnston LJ. Two-color near-field fluorescence microscopy studies of microdomains (‘rafts’) in model membranes. Langmuir 2003; 19: 8002–8009
- Milhiet P-E, Vie V, Giocondi M-C, Le Grimellac. AFM characterization of model rafts in supported bilayers. Single Mol 2001; 2: 109–112
- Milhiet P-E, Giocondi M-C, Baghdadi O, Ronzon F, Le Grimellac, Roux B. AFM Detection of GPI protein insertion into DOPC.DPPC model membranes. Single Mol 2002; 3: 135–140
- Milhiet P-E, Giocondi M-C, Baghdadi O, Ronzon F, Roux B, Le Grimellac C. Spontaneous insertion and partitioning of alkaline phosphatase into model lipid rafts. EMBO rep 2002; 3: 485–490